[
Direct observation of the phonon energy in a Bose-Einstein condensate by tomographic imaging
Abstract
The momentum and energy of phonons in a Bose-Einstein condensate are measured directly from a time-of-flight image by computerized tomography. We find that the same atoms that carry the momentum of the excitation also carry the excitation energy. The measured energy is in agreement with the Bogoliubov spectrum. Hydrodynamic simulations are performed which confirm our observation.
pacs:
03.75.-b, 32.80.Pj]
In a Bose-Einstein condensate (BEC), the long wavelength excitations are phonons, characterized by a linear dispersion relation, as well as a wave function consisting of atoms with positive and negative momenta. Both the dispersion relation and the wave function were measured indirectly, by Bragg spectroscopy [1] [2].
A two-photon Bragg process coherently imparts an energy and momentum , determined by the frequency difference and the angle between the Bragg beams, to the condensate [3]. In Bragg spectroscopy, the two-photon energy is varied, and the response of the BEC to the two-photon Bragg transition is observed [4] [5] [1]. Thus, the directly measured energy is the photon energy. Calculating the excitation energy requires knowledge of the process by which the photons impart momentum and energy to the BEC. Analogously, excitations in superfluid He were observed indirectly, by measuring the momenta and the energies of scattered neutrons [6].
The phonon energy is much larger than that of a free particle with the same momentum, and consists mostly of interaction energy between the phonon and the condensate. When the trapping potential is turned off, all the interaction energy is transformed into kinetic energy during a short acceleration period [7].
In this letter we present a direct measurement of this energy from time-of-flight (TOF) images of the released atoms. Previously the ground state interaction energy of the condensate was also measured from TOF absorption images [7]. Since absorption images provide only the density of the cloud integrated along the axis of the absorption beam, whereas energy measurements require knowledge of the full density distribution, fits to model functions of the density were needed [7]. Here we use computerized tomography of the TOF absorption images, in which the cylindrical symmetry of the cloud is used to reconstruct the full density profile from a single absorption image.
Several measurements are performed using this technique. First, the ground state interaction energy of a released, unexcited BEC is measured and compared to the value extracted from a fit to the radial size of the absorption image. Second, the density distribution of a Bragg-excited condensate is reconstructed. A clear separation between a released-phonon cloud and a condensate cloud, which is not clear in the original absorption image, is visible. The energy and momentum added to the cloud by the Bragg pulse are measured from the reconstructed image. In this way the excitation energy is found without sweeping through frequencies, and by looking directly at images of the atoms. Finally, the energy carried by the released phonons is measured by observing the distribution of the total energy between the two clouds. Thus, we extract the excitation energy from a single absorption image. Hydrodynamic simulations of the phonon release process are performed and found to be consistent with our observations.
In a previous experiment the interaction energy between two identical condensates, with a large relative velocity, was measured by their interference pattern [8]. For this case a one-dimensional treatment was sufficient.
The relation between , the energy, and , the momentum, of an excitation in a homogenous condensate has the Bogoliubov form [9], where is the condensate density, is the coupling constant, given by , is the mass of the atoms, is the scattering length, and is the corresponding free-particle energy. According to the Feynman relation, the probability of creating an excitation with momentum is proportional to [10]. Excitations with , where is the healing length, are called phonons whose dispersion relation is approximated by the linear relation [11].
For an inhomogeneous condensate, we use the local density approximation (LDA) according to which the system behaves locally as a part of a homogenous condensate. The excitation energy is then defined by the average of the local excitation energies over the entire condensate [12],
| (1) |
where is the excitation energy corresponding to , is the structure factor of the condensate, and is the number of atoms.
In our experiment a nearly pure BEC of approximately 10 Rb atoms in the ground state, is formed in a QUIC type magnetic trap [13]. The thermal component of the cloud is measured to be 5% or less. The trap is elongated and cylindrically symmetric, with radial and axial trapping frequencies of Hz and Hz, respectively. The radial and axial Thomas-Fermi (TF) radii of the condensate are thus and [14]. averaged over the entire condensate.
The two Bragg beams, produced by the same laser, are detuned 6.5 GHz from the 5S1/2, F=2 5P3/2, F’=3 transition. The beams pass through two acousto-optic modulators that control the frequency difference between them. Bragg pulses of duration varying between 1 and 3 msec are applied to the condensate. The angle between the two beams is varied to produce excitations with varying momenta along the axis (to ensure cylindrical symmetry). The beams intensities are adjusted such that the number of atoms in the excitation is always less than 25% of the total number of atoms in the condensate. The frequency difference between the two beams is varied to produce excitations of different strengths. In the range of ’s measured, the dominant broadening of the Bragg resonance is due to the inhomogeneous density in the condensate [12], and is always narrower than the finite-time broadening of our pulses. Since the pulse frequency spectrum is broad compared to the excitation line width, excitations are formed at every point in the condensate [15]. Thus, the excitation energy is given, according to Eq.(1), by the average energy added per excitation, i.e. the energy added to the cloud by the pulse, divided by the number of excitations.
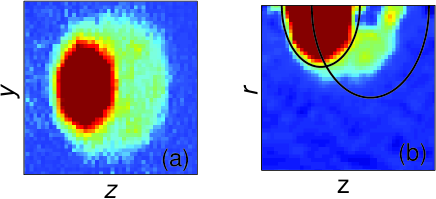
After the Bragg pulse, the magnetic trapping potential is rapidly shut off, and repulsion between atoms causes a short acceleration period, during which all the interaction energy is transformed into kinetic energy. After 38 msec of free expansion the cloud is imaged by an on-resonance absorption beam, perpendicular to . Figure 1a shows an absorption image for excitations with . Two overlapping clouds are seen. The left cloud corresponds to the condensate, and the right cloud to the released phonons. The right cloud is clearly larger in the radial direction than the left cloud, reflecting the interaction energy of the phonons.
In the TOF image, the atom’s position is proportional to their momentum. Therefore, if the density distribution after free expansion is known, we can directly calculate the energy and momentum of the atoms. The absorption picture only provides integrated along the absorption beam axis . However, since the cloud is cylindrically symmetric we reconstruct from a single absorption image using computerized tomography. According to the Fourier slice theorem, is reconstructed by evaluating [16]
| (2) |
where is the 1D Fourier transform of along the y direction, and is the zeroth order Bessel function. The center of coordinates is determined by a Gaussian fit to the BEC cloud. Figure 1b shows the reconstructed of Fig. 1a. The released-phonon cloud is seen to have a shell-like shape. A clear separation between the two clouds, which is not visible in Fig. 1a, is now seen. This separation is caused by the released repulsion energy between the two clouds.
From the reconstructed , the energy of the atoms is calculated as,
| (3) |
where msec is the time of flight, and is the in-trap z position of an atom with position z after TOF ( is approximately ). For the BEC cloud we take , where is the parabolic radius in the direction of an integrated parabola, fitted to the absorption image [7]. For the released-phonon cloud, we have no theory for . Thus, we take .
First, the energy of an unperturbed BEC is measured. To reduce background we measure the BEC energy within an ellipsoid with radii obtained from a parabolic fit to the absorption image. The average energy per atom is measured in 12 images of unperturbed BEC’s to be Hz, which is approximately equal to the value of Hz, obtained by the more conventional technique of fitting an integrated parabola to the same absorption images.
The energy of a Bragg-excited BEC is then measured in the combined volume of two ellipsoids, centered around the BEC cloud, and the released-phonon cloud (see Fig. 1b). The size of the second ellipsoid is enlarged to include all the atoms in the released-phonon cloud. A reference image with no excitations is subtracted in the area of the released-phonon cloud to exclude the energy carried by the thermal atoms. The measured momentum of the cloud, divided by , yields the number of excitations. During the pulse the average energy per atom in the condensate cloud decreases by 12%. We take the time-averaged value Hz to be the relevant value.


The filled circles in Fig. 2 are the measured energy of the atoms in both clouds as a function of the measured number of excitations for . The slope of these points is Hz and corresponds to the energy of a single excitation. It is in agreement with Hz, calculated from the Bogoliubov dispersion relation in the LDA and also with the measured value of [1] Hz. Figure 3 shows the excitation energies measured this way at four different momenta. The measured energies agree well with the Bogoliubov excitation spectrum for our measured in the LDA with no fit parameters, indicated by a solid line.
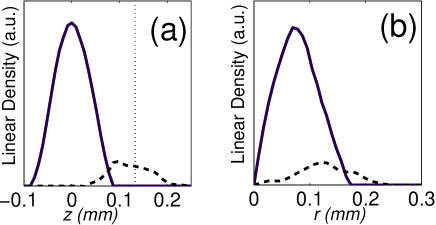
In the reconstructed of Fig. 1b, the condensate cloud and the released-phonon cloud are distinct and separate. Figure 4a and 4b show the linear density profile in each of the clouds, along the z and the r directions respectively, for . The released-phonon cloud is significantly larger than the condensate cloud in the r direction.
The condensate cloud seems not to be distorted by the interaction with the phonons. This may imply that each phonon is repelled by a fraction of the condensate that is much heavier than the phonon. Since the condensate cloud is much heavier than the phonon cloud, this would suggest that most of the excitation energy is carried by the released-phonon cloud. In order to check this hypothesis, we measure the energy of each cloud separately. The open circles in Fig. 2 are the measured energy in the released-phonon cloud only, as a function of the measured number of excitations. From a linear fit, the slope of these points is Hz. When the average energy of an atom in the condensate cloud is subtracted from this value [17], we get an energy of Hz per excitation in the released-phonon cloud, which is consistent with the Bogoliubov value Hz. This indicates that all of the excitation energy is indeed carried by the atoms in the released-phonon cloud.
The filled circles in Fig. 5 are the excitation energies, measured from the slope of the energy of the released-phonon cloud versus the number of excitations. Except for the point, the measured points agree with the Bogoliubov spectrum in the LDA, indicated by a solid line.

Given that all the excitation energy is carried by the released-phonon cloud, this energy can be extracted from a single image. This technique requires the collection of far less data than does the indirect measurement, where an entire spectrum is needed. The open circles in Fig. 5 are the excitation energies extracted from the image with the largest number of excitations, for each . These points agree with the filled circles measured from the slope.
During the release process some of the interaction energy is transformed into motion in the direction, causing the condensate to recoil. The zero of momentum is therefore not at the center of the condensate cloud, introducing a systematic error in our procedure. For the higher values the interaction energy is transformed mainly into motion in the radial direction so this systematic error is negligible. For the smaller values a larger fraction of the energy is transformed into motion in the direction. This may explain the low energies measured at the point.
We perform hydrodynamic simulations of the release of the excited cloud [14]. Excitations at different initial positions in the condensate are chosen with a probability . The condensate is then released and the excitations propagate with an initial momentum . The force at each time step is equal to the gradient of the interaction energy in the condensate at the current position of the excitation, multiplied by a factor, accounting for the excitation’s initial interaction energy. Since the excitations are a small perturbation, the condensate is assumed to expand as would an unperturbed condensate [7]. The calculated average energy of the excitations minus the average energy of the BEC, after 38 msec of free expansion, is shown by the dotted line in Fig. 5. The simulations are seen to be consistent with the observation that the released-phonon cloud carries all of the excitation energy.
In conclusion, the interaction energy of phonons in a Bose-Einstein condensate is directly measured by computerized tomography of TOF images. The excitation energy is extracted from a single absorption image. This measurement of the excitation energy relies solely on images of the atoms, and does not require any information about the photon energy. Furthermore, no assumptions are made with respect to the shape of the cloud, except for cylindrical symmetry. The measured energy is found to agree with the predicted Bogoliubov spectrum in the LDA. After the cloud is released, the excitation energy is seen to be carried by the same atoms that carry the excitation momentum. Hydrodynamic simulations of the release process are performed, and are found to be consistent with our experimental findings.
Computerized tomography of cold atomic clouds could also be used for the observation of non-trivial density profiles, such as the -wave scattering shell of two colliding clouds, vortices, solitons, or the fringe pattern of two interfering condensates. In cases of cylindrical symmetry, computerized tomography requires only a single absorption image.
REFERENCES
- [1] J. Steinhauer et. al., Cond. Mat. 0111438.
- [2] J. M. Vogels et. al., Cond. Mat. 0109205.
- [3] M. Kozuma et al., Phys. Rev. Lett. 82, 871 (1999).
- [4] J. Stenger et. al., Phys. Rev. Lett. 82, 4569 (1999).
- [5] D. M. Stamper-Kurn et. al., Phys. Rev. Lett. 83, 2876 (1999).
- [6] D. G. Henshaw and D. B. Woods, Phys. Rev. 121, 1266 (1961).
- [7] Y. Castin and R. Dum, Phys. Rev. Lett. 77, 5315 (1996).
- [8] J. E. Simsarian et. al., Phys. Rev. Lett. 85, 2040 (2000).
- [9] N. N. Bogoliubov, J. Phys. (USSR) 11, 23 (1947).
- [10] R. P. Feynman, Phys. Rev. 94, 262 (1954).
- [11] D. Pines and Ph. Nozieres, ”The theory of quantum liquids” (Addison-Wesley, 1966, 1988), Vol. I.
- [12] F. Zambelli et. al., Phys. Rev. A 61, 063608 (2000).
- [13] T. Esslinger et. al., Phys. Rev. A 58, R2664 (1998).
- [14] F. Dalfovo et. al., Reviews of Modern Physics 71, 463 (1999) .
- [15] Indeed, no correlation is found between the energy per excitation of the pulse and the pulse center frequency.
- [16] M. Born and E. Wolf, ”Principles of optics” (Cambridge university press, 7 edition, 1999) ch. IV.
- [17] For excitations with , the number of atoms in the released-phonon cloud is approximately equal to the number of excitations, and the condensate cloud energy decreases by roughly per excitation. For lower values the number of atoms in the released-phonon cloud is less than the number of excitations, and the ratio between the two is found to be . The condensate cloud energy however, decreases by roughly per excitation for all values.