Study of the Ce(Rh1-xPdx)2Si2 alloy: evidence for itinerant character of the magnetic order in CeRh2Si2.
Abstract
We present electrical resistivity () and specific heat () measurements of alloys on the Rh rich side of the phase diagram of the Ce(Rh1-xPdx)2Si2 system and compare the results with those obtained at intermediate and low Rh concentrations. The analysis of the -evolution of the entropy and the scaling behaviour of and clearly confirm a separation of the magnetic phase diagram into two regions. The region , showing a concentration independent characteristic temperature , while for decreases down to . This characteristic temperature is obtained by scaling the results as a function of the reduced temperature . At low Pd-content, the antiferromagnetic ordering temperature decreases very rapidly from in pure CeRh2Si2 to at . With higher Pd concentration it stabilized at whereas the magnitude of the anomalies in and in the susceptibility around are further reduced and disappear at . This is in contrast to the behavior found on the Pd-rich side, where decreases continuously to zero with increasing Rh content. The pronounced differences observed between both phase boundaries and the drastic effect of doping on the Rh rich side suggest an itinerant character in CeRh2Si2, in contrast to the localized character of CePd2Si2. A further evidence for the itinerant character in CeRh2Si2 is given by the dependence observed for , which scales with of the prototype itinerant compound YCo2. The exponent () of the power law observed in at low presents a broad minimum with in the intermediate concentration range , which we attribute to the effect of the random atomic distribution of Rh and Pd in this region.
pacs:
71.10HfNon-Fermi-liquid ground states, electron phase diagrams and phase transition in model systems and 71.27.+a Strongly correlated electron systems; heavy fermions1 Introduction
The exceptionally high Néel temperature of CeRh2Si2, ,1Godart83 remains a puzzling question after almost twenty years, having escaped the many attempts of explanation based on mechanisms applicable to other Ce intermetalic compounds. The exceptional magnitude of this can be appreciated by comparing it with that of GdRh2Si2 () using the de Gennes factor,2Szytula86 from which nearly two orders of magnitude difference should be expected. The main difficulty for finding a realistic description of this compound is related to the fact that it lies within the not yet well defined boundary between the applicability of local or itinerant models. In the case of CeRh2Si2, there are specific arguments in the literature supporting each type of model. For the localized moment scenario, one finds that: i) the magnetic moment along the -axis3Quezel84 ( at ) is close to that of a Ce localized moment, after correcting for crystal electric field effects (CEF); ii) the previously reported specific heat jump4Graf98 at , , is close to the value for a local doublet system in a mean field theory; iii) in coincidence, the related entropy gain is close to the value expected for a doublet ground state (GS). Although a two step metamagnetic transition (observed at 26 Tesla) was taken as evidence for a local moment system,5settai97 this argument is not conclusive because metamagnetic transitions are also predicted for anisotropic itinerant systems, 6Gignoux97 a strong anisotropy being a clear property of the system at hand.5settai97
A strong mixing between the Ce-4f and conduction states supporting the itinerant description was recognized early from the large Curie-Weiss temperature: 3Quezel84 , suggesting a Kondo temperature () even larger than for this compound, though the strong anisotropy was observed in magnetic susceptibility () on single crystals7araki98 with (in the direction) and a value four times larger in the basal plane. On the other hand, was obtained from the width at the quasi-elastic line in inelastic neutron scattering,Severing89 whereas NMR results suggest a much higher value .Kawasaki98 Neutron diffraction experiments in CeRh2Si2 show an incommesurate antiferromagnetic structure of itinerant character 8kawarazaki95 close to , which becomes commensurate at lower temperature. From the Si-NMR results much smaller magnetic moment () is estimated, and together with the high value suggests an itinerant character of the CeRh2Si2 magnetic ground state.9Delong91 The large difference in the determination between neutron diffraction and Si-NMR results indicates that the characteristic time of the measurement is important due to the dynamic nature of the magnetic correlations. Above , the electrical resistivity () increases on a characteristic energy scale of , larger than but comparable to an expected CEF splitting.5settai97 These values, together with the variation under pressure supports the argument that band spin fluctuations contribute significantly to the conduction electron scattering.10Thompson86
Within the scope of a Doniach-type description,11Doniach77 CeRh2Si2 is a paradigmatic case. With the highest value among the CeT2Si2 compounds it has to be placed at the top of the Doniach diagram.12Endstra93 Such a position is coherent with the evolution of the CeRh2(Si,Ge)2 system,13Godart89 where the increase of the volume due to the substitution of Si by Ge leads to a decrease of . This argument is complemented by the pressure dependence measurements on stoichiometric CeRh2Si2, which also shows a decrease of down to about 10 K at approximately 1 GPa and the disappearance of the related anomaly above that pressure.14Thompson00 However, when the comparison is performed with respect to other CeT2Si2 compounds it becomes contradictory in terms of the absolute and values, because for T=Rh the Kondo temperature is much larger than that for T=Pd or Cu, despite the fact that these compounds have a “less magnetic” behavior.12Endstra93 The pressure effect shows that, despite the high value, the magnetic order breaks down at the lowest pressure value within this family of Ce-compounds. The extreme sensitivity of this magnetic interaction is also evident with respect to GdRh2Si2 (there 1GPa reduces by only 10% 2Szytula86 ), or CePd2Si2 (which requires a three times higher pressure to suppress the magnetic order despite the fact that is three times lower15Mathur98 ).
At present, the large amount of information accumulated on CeRh2Si2 is not conclusive enough to elucidate whether this compound has to be considered as local or itinerant in its magnetic behavior. This ambiguity is mainly related to the fact that it is placed at the peculiar position where the energy associated to competing parameters, like and , are comparable. New independent information can be provided by studying the evolution of this system when those parameters are continuously modified driving the compound to a more local scenario. This purpose can be achieved only by selective alloying, because pressure increases the itinerant character by increasing the hybridization. The chance to enhance the local character is provided by partial substitution of Rh with Pd in the Ce(Rh1-xPdx)2Si2 system, which was recently shown to form continuously.16Trovarelli98 A preliminary investigation indicated a complex magnetic phase diagram.17Berisso99 Taking advantage of the fact that CePd2Si2 behaves as a localized magnet, a direct comparison of both ends of the Ce(Rh,Pd)2Si2–phase-diagram should give more information about the nature of the magnetic state of CeRh2Si2.
2 Experimental and results
For the present detailed study further samples on the Rh rich region and some reference La(Rh1-xPdx)2Si2 alloys were prepared following the same sample preparation procedure and experimental techniques previously described.16Trovarelli98 ; 17Berisso99
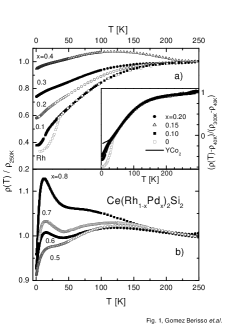
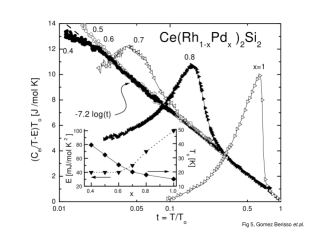
Due to its sensitivity to the nature of the electronic scattering, the electrical resistivity is one of the physical properties to be investigated when a distinction between local and itinerant electronic character is required. As reported in Fig. 1, in this system the temperature dependence of the electrical resistivity, , shows quite different features for both concentration extremes. Due to the microscopical cracks in the sample, the geometrical factor and consequently the absolute resistivity values, cannot be determined unambiguously. Therefore the values were normalized at 250 K for allowing a better comparison. As already mentioned in Ref. 5settai97 , in stoichiometric CeRh2Si2 increases continuously with a characteristic energy scale of approximately 100 K. This behavior persists up to 30% of Pd doping, but above that concentration another relative maximum develops at low temperature (at approx. , as seen in Fig. 1b). This maximum becomes more pronounced with increasing Pd-content. The main feature is that the temperature of both resistivity maxima practically does not change with concentration, while the relative strength of the electronic scattering changes significantly. On the Pd rich side, the double maximum typical for trivalent Ce intermetallics compounds with (CEF-splitting) is observed (see Fig. 1b). The maximum at low temperature is attributed to the electronic scattering by the GS and the other by the excited CEF level, both being enhanced by the Kondo effect.21Cornut-72
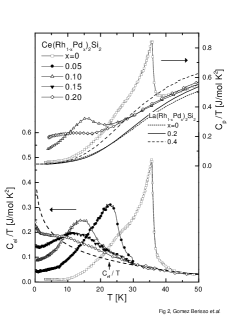
The temperature dependence of the electronic contribution to the specific heat () at low Pd doping () is shown in Fig. 2. This contribution was evaluated from the measured specific heat () as: , where is the phonon contribution extracted from La isotypic compounds with =0, 0.2, 0.4 and 1. As it can be seen in the upper part of Fig. 2, the Ce-based samples on the Rh-rich side () show quite similar values at . Below 10 K, La-based samples on the Rh rich side (=0 and 0.2) also show a little difference in the phonon contribution. In contrast, from to , increases significantly with after a drastic enhancement between and 0.4. Therefore the phonon subtraction for the Ce-based samples was calculated using the extrapolation of the La and 0.2 samples for the Rh rich region and that between and 1 for the rest of the samples. This non-monotonous variation of upon Pd doping suggests a change in the phonon spectrum around . However, no structural transition was detected from the X-ray data: only a change in the -dependence of the -ratio at that concentration.
Our sample of pure CeRh2Si2 shows a larger jump at , , than previously reported in the literature,4Graf98 which exceeds the mean field prediction. This peak in at is better observed in thermal expansion,7araki98 and is probably related to the opening of a magnetic excitation gap due to the strong Ising-type anisotropy of this compound. A further weak anomaly associated with the change of the magnetic propagation vector is also observed at 25 K.22Grier84
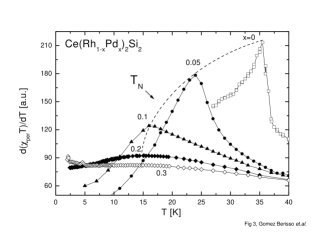
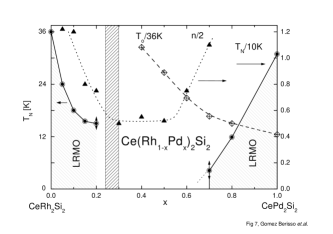
A small amount of Pd () already leads to a strong decrease of and a pronounced broadening of the anomaly in . Further increase of the Pd concentration () leaves the temperature of the maximum almost unchanged but reduces the size of the anomaly, which eventually disappears between and . Due to the broadening, the analysis of the anomaly in does not lead to a reliable determination of . More precise values can be obtained from the susceptibility by looking at the derivative and defining as the temperature of the maximum (see Fig. 3). This demonstrates very clearly the rapid drop of from 36 K in pure CeRh2Si2 to 18 K at and then the leveling off at around for (see also the phase diagram in Fig. 7). This is in sharp contrast to the Pd-rich region, where drops monotonously with increasing Rh content and extrapolates to 0 K at . The broadening of the anomaly is also much less pronounced on the Pd-rich side. The disappearance of the anomaly without a concomitant decrease of to 0 K on the Rh-rich side indicates that the degrees of freedom involved in the magnetic transition as well as the free energy gained in that transition decrease with Pd content and eventually vanish, whereas and thus the strength of the magnetic interaction still has a finite value.
Within the intermediate concentration region (), is well described by a logarithmic decrease, with a downward curvature at low temperature, as typically observed in systems lying close to a magnetic instability.20Moriya The low temperature value increases proportionally to the Pd-concentration up to , where the onset of the magnetic order of CePd2Si2 is observed.
3 Discussion
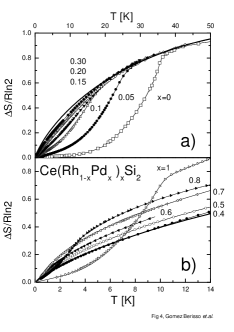
Once the intrinsic differences of doping effect on was establishes between Pd and Rh rich sides, we shall analyze further properties to gain insight into the nature of the ground state on both extremes of the alloy system. The most important parameter is the characteristic energy related to the delocalization of the 4f-electrons. A rough idea about its dependence on the composition can be obtained by looking at the evolution of the entropy. In Fig. 4a, we show the entropy gain as a function of temperature up to 50 K on the Rh-rich side, and in Fig. 4b that of the intermediate and Pd-rich samples up to 14 K. Within the experimental dispersion, the entropy gains in the Rh-rich samples merge above the respective into a common curve. As it will be shown later, this curve can be described by a simple function which relates the results in the Rh-rich samples to those at intermediate and high Pd-contents. The merging to a common function means that one can define a magnetically-non-ordered state (hereafter, normal state) for all the Rh-rich samples. The temperature dependence of the (electronic/magnetic) entropy of this normal state corresponds to the common function and determines the entropy observed at for a given composition. This is a result expected in the case where one energy scale determines (and thus or as in Fig. 2b) of the normal state whereas a second independent energy scale determines the ordering temperature. This can be compared with some quasi one-dimensional spin systems, where of the normal state is determined by the intrachain exchange and by the interchain exchange, or for a superconductor (or a Spin Density Wave) were the normal state is determined by the electron density of states (i.e., the band width) whereas (or ) is determined by the interaction between the quasiparticles. In those cases, the change of the ordering temperature () leads to a change of the entropy at () in accord with the temperature dependence of the entropy of the normal state. However, this would not be the case in a purely localized three-dimensional antiferromagnet where, reducing the exchange strength (and thus ) would not change the entropy collected at . Therefore this result is a very strong indication that in the Rh-rich region there is a characteristic 4f-energy which is independent of the composition. This characteristic energy governs the normal state and it is not related to the magnetic order but to the hybridization energy of the 4f-electrons.
In contrast to the Rh-rich region, the entropy gain in the intermediate and in the Pd-rich regions increases continuously with the Pd-content. This indicates a continuous decrease of the characteristic energy with increasing for . A more precise analysis can be performed by fitting the data of the samples with using a scaling formula proposed for systems close to a magnetic instability, 26Sereni with , and being two free parameters corresponding to a characteristic energy and the linear background contribution to the specific heat, respectively. The fits and the concentration dependence of and are shown in Fig. 5. decreases continuously from 40 K at to 15 K at , whereas increases continuously from 40 to 100 mJ/mol K2. The corresponding and curves are shown as reference functions in Fig. 4b (continuos line) and Fig. 5 (straight line), respectively. The fitting parameters, obtained for =0.4, can be used to fit the entropy of the common normal state observed in the Rh-rich region indicating that, despite the change of regime, there is a smooth evolution of the normal state from the to the region. One should notice that the value we obtain for CeRh2Si2 and CePd2Si2 (42 K and 15 K, respectively) are close to the values of 33 K and 10 K given by the inelastic neutron scattering.Severing89 This supports the applicability of the scaling formula. The scaling further implies that, in the absence of magnetic order (i.e., in the concentration range ), is inversely proportional to at very low temperatures, as it occurs in the single ion Kondo model with . For the samples showing magnetic order this is no longer true, since part of the degrees of freedom contributing to condense into the magnetic state. Thus the analysis of the composition dependence of and demonstrates a continuous evolution of the normal state from pure CeRh2Si2 to pure CePd2Si2. Nevertheless, a clear break in the -dependence of the characteristic energy occurs at , since is constant for but decreases continuously for . This change of regime underscores the different nature of the Ce ground state in both concentration limits.
As mentioned before, no discontinuity in the crystalline parameters is observed in this system16Trovarelli98 the “”-ratio, as was already mentioned, undergoes one of the largest variations observed among the Ce 122 intermetallics with ThCr2Si2 type structure,Just96 changing from for CeRh2Si2 to 2.33 for CePd2Si2, with a weak variation in the slope at . A concomitant modification in the magnetic structure is observed between CeRh2Si2 (with the moments ordered along the -axis) and CePd2Si2 (with the staggered magnetic moments on the basal plane). 22Grier84 Such a drastic difference makes a continuity in the LRMO between both stoichiometric extremes unlikely. One would instead expect a disordered or frustrated magnetic region between those phases, but our results show that also the character of the f-electron localization is changing.
Further information can be obtained from a more detailed analysis of the resistivity, since its temperature dependence is dominated by the effect of the magnetic scattering. On the Rh-rich side, a clear scaling in the dependence can be observed when the measured is normalized to its value at 40 K right above and at high temperature, i.e. , as displayed in the inset of Fig. 1a. This scaling holds only for the alloys that show magnetic order (i.e. ), indicating that the magnetic component involved in the electronic scattering has a different nature for the low Pd doping range than in the intermediate region. It is worth noting that the resistivity of YCo2,24Hauser98 a prototype of band spin fluctuation system, fits into this scaling, as shown in the inset of Fig. 1a. This is a strong evidence for the itinerant character of the electronic properties of these alloys. Such a scaling also supports the fact that the energy which characterizes the Rh-rich region does not change with concentration. Despite its relatively large curvature, the dependence cannot be attributed to an intermediate valence behavior (like in CeRh2 for example25Harrus85 ) because of LRMO at lower temperature.
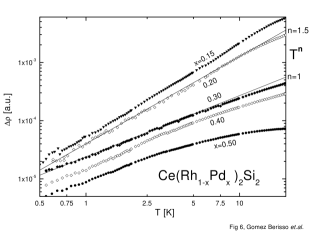
The disappearance of the magnetic order is connected with a profound change in the low energy excitations. This is evidenced in the resistivity, which at low temperatures was found to follow a power law with an exponent that changes systematically with composition. As an example we show in Fig. 6 the temperature dependent part of the resistivity, , in a log-log plot for the concentration range . Here, the disappearance of the magnetic order leads to a strong decrease of to values close to 1, characteristic for non-Fermi Liquid systems. 28hvl For and we found values of larger than 2 (see Fig. 7)as expected for compounds showing LRMO.
The present investigation of the Ce(Rh1-xPdx)2Si2 system allows us to propose a more detailed phase diagram. We have included in Fig. 7 the magnetic phase boundaries, , the evolution of the characteristic energy as deduced from the scaling of , as well as the exponent of the power law in at low temperatures. The change in the evolution of , as deduced from the and results, suggests the division of the magnetic phase diagram into two regions with a crossover region between and (hatched area). On the Rh-rich side, a strong decrease of coexist with a constant , while the suppression of the magnetic order occurs at a finite in the crossover region. On the Pd-rich side of the crossover region, decreases continuously with increasing , with the slope becoming weaker once the magnetic order appears. The part of the phase diagram on the right (Pd-rich) side of the crossover region corresponds to the expected for a transition from a non-ordered to a magnetically ordered Kondo-lattice system. Simple appropriate models, like that proposed by Doniach, predict a monotonous decrease of with increasing in the vicinity of the transition, just as observed here for increasing Rh doping in CePd2Si2. Therefore this part of the phase diagram is in agreement with the present picture of CePd2Si2 as a localized antiferromagnet. In contrast, the part of the phase diagram on the left (Rh-rich) side of the crossover region cannot be explained within such a localized Doniach-model, since the magnetic order is suppressed without a concomitant increase of the characteristic energy. There, the scaling of the resitivity with that of YCo2 and the evolution of the entropy with doping support an itinerant type of magnetic order. Itinerant magnets are sensitive to disorder (more than localized ones), especially if the ordered state is close to the stability limit. This is certainly the case for CeRh2Si2 as shown by the strong suppression of the LRMO with pressure (one order of magnitude larger than for CePd2Si2). Then, the rapid suppression of the magnetic order upon Pd-doping despite a constant characteristic energy can easily be accounted for by the disorder due to the doping.
4 Conclusions
The main result of this investigation is that the Rh-rich and the Pd-rich parts of the Ce(Rh1-xPdx)2Si2 system behave very differently. On the Pd-rich side, increasing the Rh-content leads to a pronounced increase of the characteristic 4f-energy and a concomitant continuous decrease of down to 0 K. This side of the magnetic phase diagram corresponds to the predictions of models based on localized f-electrons, supporting the current interpretation of a localized antiferromagnetic state in CePd2Si2. In contrast, on the Rh-rich side, Pd doping leads to a continuous decrease of the degrees of freedom involved in the magnetic ordered state and to the disappearance of the magnetic state at a finite , despite the fact that the characteristic energy is not affected by the Pd-doping. This points to an itinerant type of magnetic order in CeRh2Si2, which is destroyed by the disorder introduced by the Pd-doping. Further evidence for the itinerant character is that in the Rh-rich region scales with that of YCo2, a prototype band spin-fluctuation system. The change of slope in the dependence of on composition between and suggests that the change from the itinerant to the localized regimes takes place in that region. In the intermediate region , we observe in a power law with an exponent close to 1, which we attribute to the disorder induced by the alloying and to the absence of long range magnetic order.
Acknowledgements.
This work was partially supported by joint programs between Fundacion Antorchas (Arg.) and Alexander von Humboldt Stiftung (Germ.) #A-13391/1-003, Fundación Antorchas and DAAD (Germ.) #13740/1-88 and ANPCyT: project PICT #03-3250. MGB, PP and JGS, are members of the Consejo Nacional de Investigaciones Científicas y Técnicas (Arg.).References
- (1) C. Godard, L. C. Gupta and M. F. Ravet-Krill, J. Less Comm. Met., 94, 187 (1983).
- (2) A. Szytula, A. Budkowski, M. Slaski and R. Zach, Solid State Commun. 57, 813 (1986).
- (3) S. Quezel, J. Rossat-Mignot, B. Chevalier, P. Lejay and J. Etorneau, Solid State Commun. 49, 685 (1984).
- (4) T. Graf, M.F. Hundley, R. Modler, R. Movshovich, J.D. Thompson, D. Mandrus, R.A. Fisher and N.E. Phillips, Phys. Rev. B 57, 7442 (1998).
- (5) R. Settai, A. Misawa, S. Araki, M.Koski, K. Sigiyama, T. Takeuchi, K. Kindo, Y. Haga, E. Yamamamoto and Y Önuki, J Phys. Soc. Japan 66, 2260 (1997).
- (6) Gignoux, Schmitt, Handbook Magn. Materials., Ed: Buschow, Vol.10, ch.2 (1997).
- (7) S. Araki, A. Misawa, R. Settai, T. Takeuchi and Y. Önuki, J. Phys. Soc. Japan 67, 2915 (1998).
- (8) A. Severing, E. Holland-Moritz and B. Frick, Phys. Rev. B 39, 4164 (1989).
- (9) Y. Kawasaki, K. Ishida, Y. Kitaoka and K. Asayama, Phys. Rev. B 58, 8634 (1998).
- (10) S. Kawarazaki, Y. Kobashi, J.A. Fernandez-Baca, S. Murayama, Y. Önuki and Y. Miyako, Physica B 206&207, 298 (1995).
- (11) L. De Long, J.G Huber and K.S. Bedell, J. Magn. Magn. Matter. 99, 171 (1991).
- (12) J.D. Thompson, RD Parks and H. Borges, J. Magn. Magn. Matter.- 54-57, 377 (1986).
- (13) S. Doniach, Physica B 91, 231 (1977).
- (14) T. Endstra, G.J. Nieuwenhuys and J.A. Mydosh, Phys. Rev. B 48, 9595 (1993).
- (15) C. Godart, L.C. Gupta, C.V. Tomy, J.D. Thompson and R. Vijayaraghavan, Europhys. Lett. 8, 375 (1989).
- (16) J.D. Thompson, H. Hegger, D. Louca, G.H. Kwei, R. Movshovich, C. Petrovic and J.L. Serrao, J. Alloys and Comp. 303-304, 239 (2000).
- (17) N.D. Mathur, F.M. Grosche, S.R. Julian, I.R. Walker, D.M. Freye, R.K.W. Haselwimmer and G.G. Lonzarich, Nature 394, 39 (1998).
- (18) O. Trovarelli, M. Gómez Berisso, P. Pedrazzini, D. Bosse, C. Geibel, J. G. Sereni and F. Steglich, J. Alloys and Comp. 275-277, 569 (1998).
- (19) M. Gómez Berisso, P. Pedrazzini, J. G. Sereni, O. Trovarelli, C. Geibel and F. Steglich, Physica B 259-261, 68 (1999).
- (20) D. Cornut and B. Coqblin, Phys. Rev. B 5, 4541 (1972).
- (21) B. H. Grier, J. M. Lawrence, V. Murgai and R. D. Parks, Phys. Rev. B, 29, 2664 (1984).
- (22) T. Moriya and T. Takimoto, J. Phys. Soc. Jap., 64, 960 (1995).
- (23) J.G. Sereni, C. Geibel, M. Gómez Berisso, P. Hellmann, O. Trovarelli, F. Steglich, Physica B 230-232, 580 (1997).
- (24) G. Just and P. Paufler, J. Alloys and Compounds 232, 1 (1996).
- (25) R. Hauser, E. Bauer and E. Gratz, Phys. Rev. B 57, 2904 (1998).
- (26) A. Harrus, T. Mihalisin and E. Kemly, J. Magn. Magn. Matter. 47&48, 93 (1985).
- (27) H. v. Löhneysen, J. Phys.: Cond. Mat. 8 9689 (1996).