Phase Transitions in the Bilayer Quantum Hall Effect
Abstract
We measured the magnetoresistance of bilayer quantum Hall (QH) effects at the fractional filling factor by changing the total electron density and the density difference between two layers. Three different QH states were separated by two types of phase transition: One is the spin transition and the other is the pseudospin transition. In addition, two different hystereses were detected, one of which is specific to bilayer systems. The phase transitions and the hystereses are described well by a composite fermion model extended to a bilayer system.
pacs:
73.43.-f,73.43.Nq,73.21.Fg,71.10.PmIn bilayer electron systems, interlayer Coulomb and tunnelling interactions provide an additional degree of freedom, which produce rich phenomena with no counterpart in individual two dimensional systems spielman . A good example is the bilayer quantum Hall (QH) state at the filling factor . A phase transition has been observed at as revealed by magnetotransport measurements SawadaPRL ; SawadaPRB , light-scattering Pellegrini ; Pellegriniscience and capacitance spectroscopy Khrapai . In the weak interlayer correlation case, electrons in each layer configure the monolayer QH state separately. This state is the compound state with , which is a spin-polarized state. When the interlayer correlation is enhanced, this compound state transits to a spin-unpolarized QH state. In a conventional system, cyclotron energy is very large cyc and the Landau orbital degree of freedom is frozen. Thus, the observed phase transition is due to the spin and layer degree of freedom.
The fractional QH effect (FQHE) is intuitively understood based on the composite fermion (CF) model Jain , where basic particles are CFs obtained by attaching an even number of flux quanta to electron. At the filling factor , the attached flux exactly cancels the applied magnetic field. As the field deviates from , CFs are subjected to the effective magnetic field and quantized into CF Landau levels. The series of FQHE at are interpreted as integer QH effect (IQHE) of CF at . For instance, the FQHE is mapped to the IQHE. However, there exists significant difference because the CF-cyclotron gap is comparable to the Zeeman energy. In the monolayer QH states, indeed, phase transitions have been observed Du , which arise from a competition between the Zeeman and CF-cyclotron energies. Moreover, the hystereses Kronmuller1 ; Kronmuller2 ; Cho ; Eom ; Smet ; Hashimoto observed around and in monolayer systems have attracted much attention recently. Thus we expect rich phases to appear in the bilayer QH state, where CF-Landau orbital, spin and layer degrees of freedom all come into play.
In this Letter, we study the magnetoresistance at in a bilayer system by changing the total electron density and the density difference between two layers and map out the phase diagram in the - space, where () is the electron density in the front (back) layer. In the phase diagram, three different QH states and a no-QH area were observed. The QH states were elucidated by the activation energy measurements. In addition, two types of hysteresis were detected. One of the hystereses, specific to bilayer systems, is our new finding. These phases are described well by a CF model extended to a bilayer system on the understanding that collective Coulomb interactions renormalize not only the CF cyclotron energy but also the Zeeman and tunnelling energies.
Our sample was grown by molecular beam epitaxy on a (100)-oriented GaAs substrate. It consists of two GaAs quantum wells of 200 Å width separated by a 31-Å-thick barrier of Al0.33Ga0.67As Muraki . The tunnelling energy gap is K. The electron density in each layer is controlled by adjusting the front and back gate voltages. The low temperature mobility is 2 cmVs with cm-2. Measurements were performed with the sample mounted on a goniometer with a superconducting stepper motor GONO in a dilution refrigerator. Standard low-frequency ac lock-in techniques were used. All magnetoresistance data were taken at 50 mK with the magnetic field sweep rate 0.06 T/min and the current 20 nA.
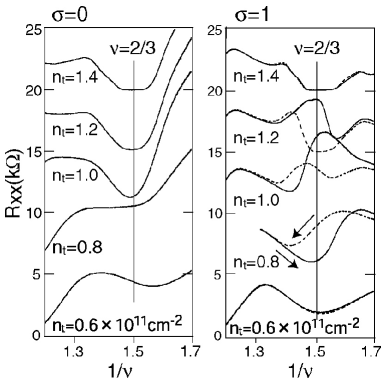
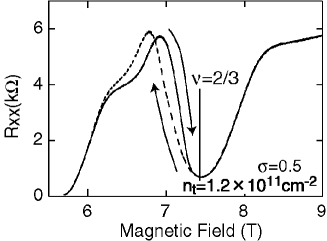
In Fig. 1, we show how the state evolves as the total electron density changes in the perpendicular field (), where is the total magnetic field. Data are given for two limiting cases, i.e. the balanced density point () and the monolayer point (). At both points, the magnetoresistance becomes zero at higher density, where QH states are well developed. At , the minimum of gets weaker with decreasing , and collapses at cm-2, followed by a reappearance of the minimum at cm-2 Suen ; Lay . At , on the other hand, we observed a totally different behavior: A significant difference in between upward (solid trace) and downward (dashed trace) magnetic-field sweeps was observed for a wide range of magnetic field covering the entire region. We call it type-G hysteresis (G stands for the ground state, as we explain later).
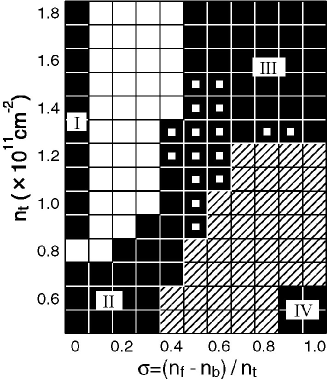
We repeated similar measurements for in the range of cm-2 and made a phase diagram (Fig. 2) QH . In the phase diagram, four QH (black) areas labeled I, II, III and IV are clearly recognized. Area I is completely separated by the no-QH (white) area, while area IV is connected with areas II and III by the type-G hysteresis (hatched) region. On the other hand, the low density phase at (area II) evolves continuously into the high density phase at (area III). In these two areas (II and III), we observed a new type of hysteresis (small white squares in the black) region, which we name type-E hysteresis (E stands for excitation levels). We discuss this hysteresis later in Fig. 5.
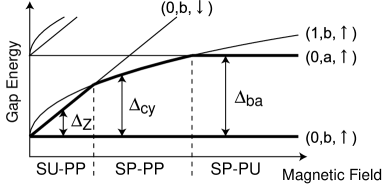
We explain these four QH areas based on the CF model extended to a bilayer system. CF energy levels are split by the Zeeman , pseudo-Zeeman and CF-cyclotron energies (Fig. 3). We use the pseudospin language to deal with the layer degree of freedom. The pseudo-Zeeman energy is the energy gap between the bonding (b) and antibonding (a) states MurakiSSC , , which is equal to at and increases with applying a bias voltage. The origin of the CF-cyclotron gap is a Coulomb interaction HLR , and we set , where is a dimensionless coefficient, is the dielectric constant, is the magnetic length in the effective magnetic field and is the magnetic field at . We label each CF energy level as (), where , and are the CF-Landau orbit, pseudospin and spin indices. At , two CF energy levels are occupied.
When is high at the balanced density point (area I), is large and is small, and then the spin-polarized and pseudospin-unpolarized (SP-PU) state is realized. In this state, the intralayer interaction dominates the interlayer interaction, and in each layer electrons configure the monolayer QH state. When the density is off-balanced (), the filling factor in the front and back layers deviate from 1/3, and the compound state collapses. Thus, this state is stable only at . In area IV, where is small and is large, the spin-unpolarized and pseudospin-polarized (SU-PP) state is realized. When is increased from area IV to III, the SU-PP state transits to the spin-polarized and pseudospin-polarized (SP-PP) state. Even at , has a finite value , which exceeds the CF-cyclotron gap at low density. Thus, the QH state in area II is the SP-PP state. Accordingly, the SP-PP state persists continuously from area II to III.
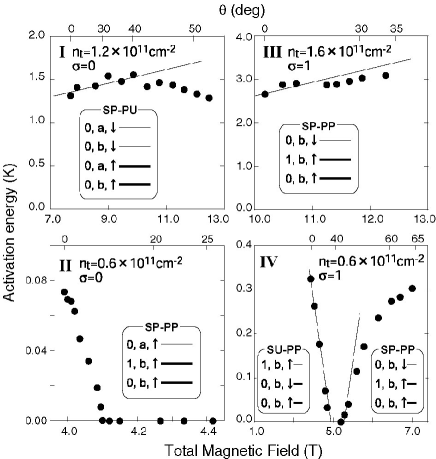
To elucidate these bilayer QH states more in detail, we measured the activation energy by tilting the sample in the magnetic field with keeping fixed, where is determined from the temperature dependence of the magnetoresistance LK : . Figure 4 shows the activation energy in the four QH areas as a function of the total magnetic field , where is the in-plane magnetic field. As is increased, increases and decreases Hu , where is the gyromagnetic ratio, is the Bohr magneton and is the layer separation. In area I and III, initially increases, which indicates that the excitation gap is the Zeeman energy. In area II, when is increased only by 0.1 T, the activation energy becomes zero. Although we increased up to 13 T, a QH state did not reappear. The excitation gap of this state is , because decreases . In area IV, the activation energy first decreases and shows a pronounced transition at 5 T. This behavior is interpreted as the phase transition from the SU-PP to SP-PP states due to the increased Eisenstein ; Engel . This SP-PP state is the same as the one in area III.
We analyze the phase transition points based on the noninteracting CF model (Fig.3). We start with the phase transition point between the SP-PP (area II and III) and SP-PU (area I) states at the balanced point (). It occurs due to the crossing of the levels (1,b,) and (0,a,) at
| (1) |
The transition occurs at cm-2 in our data (Fig. 2). As mentioned above, the SP-PU state made of (0,b,) and (0,a,) does not exist in the unbalanced configuration () and the no-QH area develops between the areas I and III as in the white area in Fig. 2. Then, eq. (1) determines the phase boundary between the SP-PP state and the no-QH area. The transition point shifts to higher as is increased, .
Next, we discuss the transition point between the SP-PP (area II and III) and SU-PP (area IV) states, where the Zeeman and CF-cyclotron gaps become equal,
| (2) |
The transition occurs at cm-2 in the monolayer limit () in our data (Fig. 2). When decreases, decreases because electrons tend to extend over both of the layers and the Coulomb energy decreases. It follows from eq. (2) that . Hence, the total density at the transition point decreases as SUPP . This explains why the SP-PP state is realized at higher density near the monolayer point (area III) but at lower density around the balanced point (area II).
In this way, the phase diagram for is interpreted qualitatively by the noninteracting CF model. However, some refinement is needed quantitatively. We focus on the coefficient of the CF cyclotron gap. From eq. (2) we obtain at . We have argued that it decreases as decreases, and hence must be much smaller than , as is suggested in our phase diagram (Fig. 2) SUPP . However, from eq. (1) we obtain at , which is almost ten times bigger than the one implied by eq.(1). We have reached this inconsistency by assuming that collective Coulomb interactions renormalize only the CF cyclotron energy as in the noninteracting CF theory of the monolayer FQHE. This simple picture fails in the bilayer FQHE. The above inconsistency would be resolved by the understanding that collective Coulomb interactions renormalize also the Zeeman and tunnelling energies of CFs.
Finally, we discuss the two types of the hysteresis. Type-G hysteresis was observed between the SU-PP and SP-PP states. This type of hysteresis has already been observed in various monolayer systems, and argued to be caused by domain morphology in the ground state Cho ; Eom ; Smet . The ground state consists of the spin-polarized and spin-unpolarized domains at the crossover point of the two states. The hysteresis would result from a conspiracy between electronic and nuclear polarization Kronmuller1 ; Kronmuller2 ; Hashimoto .
Type-E hysteresis is distinguished from type-G one by the fact that the ground state does not change. Thus, type-E hysteresis is not due to the domain morphology of the ground state. We notice that type-E hysteresis appears not exactly at but only on the lower field side of (Fig. 5). We speculate the origin of the hysteresis as follows. At the lower field side of , many quasiparticles are created in excitation levels of . The SP-PP state in areas II and III have different excitation levels (0,a,) and (0,b,), as shown in the insets of Fig. 4. These upper CF levels are almost degenerate with one another in the small white square area in the phase diagram (Fig. 2). We would conclude that type-E hysteresis occurs due to the domain morphology involving different spin excitation levels. As far as we are aware of, type-E hysteresis has not been observed before.
In summery, we made the phase diagram for by changing the total electron density and the density difference between two layers. In the phase diagram, three different spin/pseudospin QH states were observed. The SP-PP state is realized at lower density around the balanced point, while at higher density near the monolayer point. A no-QH area develops between the SP-PU and SP-PP states. Moreover, two types of hysteresis were observed. One is due to the crossover of different spin ground states, and the other is associated with crossing of different spin excitation levels. We have interpreted the phase diagram by a CF model extended to a bilayer system. These phases are caused by the spin, layer and composite fermion Landau orbital degrees of freedom.
The research was supported in part by Grant-in-Aids for the Scientific Research from the Ministry of Education, Science, Sports and Culture (Nos. 10203201, 11304019, 08159), the Mitsubishi Foundation and the Asahi glass Foundation, CREST-JST and NEDO ”NTDP-98” projects.
References
- (1) I. B. Spielman, J. P. Eisenstein, L. N. Pfeiffer, and K. W. West, Phys. Rev. Lett. 84, 5808 (2000).
- (2) A. Sawada et al., Phys. Rev. Lett. 80, 4534 (1998).
- (3) A. Sawada et al., Phys. Rev. B 59, 14888 (1999).
- (4) V. Pellegrini et al., Phys. Rev. Lett. 78, 310 (1997).
- (5) V. Pellegrini et al., Science 281, 799 (1998).
- (6) V. S. Khrapai et al., Phys. Rev. Lett. 84, 725 (2000).
- (7) In GaAs, the cyclotron energy is about 60 times lager than the Zeeman energy when .
- (8) J. K. Jain, Phys. Rev. Lett. 63, 199 (1989).
- (9) R. R. Du et al., Phys. Rev. B 55, R7351 (1997).
- (10) S. Kronmller et al., Phys. Rev. Lett. 81, 2526 (1998).
- (11) S. Kronmller et al., Phys. Rev. Lett. 82, 4070 (1999).
- (12) H. Cho et al., Phys. Rev. Lett. 81, 2522 (1998).
- (13) J. Eom et al., Science 289, 2320 (2000).
- (14) J. H. Smet et al., Phys. Rev. Lett. 86, 2412 (2001).
- (15) K. Hashimoto, K. Muraki, T. Saku, and Y. Hirayama cond-mat/0111403.
- (16) K. Muraki, N. Kumada, T. Saku, and Y. Hirayama, Jpn. J. Appl. Phys. 39, 2444 (2000).
- (17) M. Suzuki, A. Sawada, A. Ishiguro, and K. Maruya, Cryogenics 37, 275 (1997).
- (18) T. S. Lay, T. Jungwirth, L. Smrka, and M. Shayegan, Phys. Rev. B 56, R7092 (1997).
- (19) Y. W. Suen et al., Phys. Rev. Lett. 72, 3405 (1994)
- (20) Though the hysteresis depends on the magnetic sweep rate and the current, we selected suitable condition (0.06 T/min, 20 nA) to judge whether the hysteresis exists.
- (21) B. I. Halperin, P. A. Lee, and N. Read, Phys. Rev. B 47, 7312 (1993).
- (22) K. Muraki et al., Solid State Commun. 112, 625 (1999).
- (23) Some gaps are in the order of 10 mK, which is the same order of the experimental temperature. We have confirmed that qualitatively the same results are obtained from the Liftshitz-Kosevich formula, which is known to be valid at relatively higher temperatures before the resistance minima disappear and fits for small energy gaps. D. R. Leadley et al., Phys. Rev. Lett. 79, 4246 (1997).
- (24) J. Hu and A. H. MacDonald, Phys. Rev. B 46, 12554 (1992).
- (25) J. P. Eisenstein, H. L. Stormer, L. N. Pfeiffer, and K. W. West, Phys. Rev. B 41, 7910 (1990).
- (26) L. W. Engel et al., Phys. Rev. B 45, 3418 (1992).
- (27) Note that, though the QH state in the area IV has been observed only at a low and large corner in Fig. 2, it is expected to extend toward for lower : QH states are hard to observe at lower density, cm-2, where the mobility is lowered.