de Haas-van Alphen effect in single crystal MgB2
Abstract
We report observations of quantum oscillations in single crystals of the high temperature superconductor MgB2. Three de Haas-van Alphen frequencies are clearly resolved. Comparison with band structure calculations strongly suggests that two of these come from a single warped Fermi surface tube along the direction, and that the third arises from cylindrical sections of an in-plane honeycomb network. The measured values of the effective mass range from . By comparing these with band masses calculated recently by three groups, we find that the electron-phonon coupling strength , is a factor larger for the -axis tube orbits than for the in-plane network orbit, in accord with recent microscopic calculations.
The discovery of high temperature superconductivity in MgB2 nagamatsu01 has led to great interest in this hexagonal layered compound. Early isotope effect work clearly showed that phonons are important budko01 , but subsequent experiments and calculations by a number of groups have revealed some unusual features, such as the possible existence of two distinct superconducting gaps bouquet01 ; chen01 ; manzano01 ; szabo01 , that may be associated with two different bands liu01 ; shulga01 .
The bandstructure of MgB2 has been calculated by a number of groups kortus01 and recently, photoemission experiments uchiyama have confirmed its qualitative features. Studies of the de Haas-van Alphen (dHvA) effect provide crucial information about the electronic properties of metals and superconductors. Observation of quantum oscillations allows the shape of the Fermi surface and the effective masses of carriers on individual Fermi sheets to be found. Then, together with band-structure calculations, electron-phonon coupling constants can be obtained shoenberg . Here we report a detailed study of the dHvA effect in single crystals of MgB2. Three dHvA frequencies are clearly resolved in our data, and can be assigned to two distinct, orthogonal Fermi surfaces parallel to the main symmetry axes of MgB2 kortus01 . The effective masses corresponding to these three frequencies have been measured and compared with recent calculations by three groups. The comparison shows clearly that the electron phonon enhancement is large for the c-axis tube and much smaller for the in-plane electron-like tube.
The single crystals used in this work were grown in Tokyo by high pressure synthesis, as described in Ref. lee01 . Two crystals from the same batch were studied in parallel using sensitive piezo-resistive cantilevers to measure the torque () taillefer99 ; bergemannphd – crystal A at Cambridge using a 4He cryostat with a 15 T magnet and crystal B at Bristol using a 3He cryostat with an 18 T magnet. The dimensions of the crystals A and B were m3 and m3 respectively (the shortest side being along the -axis). Thermal contact between the crystals and nearby calibrated thermometers was ensured by immersion in 3He or 4He liquids or a few mbars pressure of exchange gas. Both cryostats had a single-axis low-temperature rotatable sample stage and angles were measured to a relative accuracy of at least 1∘. For crystal A, the alignment was verified from the symmetry of high resolution, torque versus angle sweeps near the -axis at 15 T, while for B a correction of 6∘ was applied to make the dHvA frequencies symmetrical about the crystal axes. The data obtained in both sets of experiments were essentially identical.

Fig. 1 (panels a-c) show torque versus magnetic field data footnote1 for both crystals as a function of angle, as the crystals were rotated from [001] () to [100] (). Initially, the orientation of the -axis was determined from the platelet shape and the anisotropy of the upper critical field . As expected, the torque signal goes to zero at the principal symmetry directions ( and 90∘) but is already sizable only a few degrees away. The signal was easily resolved over a wide field range, giving well defined dHvA frequencies [see the fast Fourier transforms (FFTs) in Fig. 1 (panel d)]. Two frequencies ( and ) were observed for field sweeps carried out within 45∘ of the -axis [Fig. 1(a)], while only a single frequency was found for fields nearer the plane [Fig. 1(b) and (c)].
The dHvA signals were analyzed in the conventional way using the Lifshitz-Kosevich (LK) expression shoenberg ; wasserman for the oscillatory magnetization of a 3D Fermi liquid
| (1) |
where is the dHvA frequency [, is the extremal orbit area in -space]; is the phase; , and are the damping factors from impurity scattering, temperature () and spin splitting respectively. = , where is the unenhanced or ‘bare’ band mass shoenberg ; wasserman and is the scattering time. where , and is the quasi-particle effective mass, that is enhanced over by both electron-electron and electron-phonon interactions, and is the free-electron mass. The spin splitting phase factor is given by where is the Landé -factor for electrons in a given orbit, and is the enhancement of the Pauli susceptibility from electron-electron interactions alone.

Fig. 2 (upper panel) shows the angular dependence of the three dHvA frequencies observed in both crystals on rotating from [001] to [100]. There is excellent agreement between the two sets of data. The strong, nearly cosine angular dependence of and suggests that they arise from cylindrical sections along the -axis. The small deviations from a strict dependence are shown in inset (a) of Fig. 2. Assuming a simple cosine -axis dispersion [i.e., ], Yamaji yamaji89 derived a formula which accounts for the ‘magic-angle’ magnetoresistance maxima in quasi-2D organic superconductors. This gives the angular dependence of the two frequencies, , arising from extremal areas of a single warped cylinder as,
| (2) |
In this expression, the first term is the mean frequency , the prefactor of the second term is and is the Bessel function. Here and represent and at , and may be taken directly from the data, so this equation has no free parameters. The good agreement shown in inset (a) of Fig. 2 implies that and are the two extremal orbits of a single warped tube. As shown in inset (b), for the other orbit, is remarkably constant (to within 1 over 40∘) implying that it is cylindrical with very little warping.
In Fig. 2 (lower panel), we show results obtained in a second experiment on crystal A in which the -axis was aligned at 15∘ from the rotation axis and the magnetic field was rotated approximately within the basal plane. Two minima separated by were observed, consistent with the hexagonal symmetry of MgB2. The minimum value of in the upper panel agrees with that in the lower panel (after correcting for the 15∘ offset) showing that when , in the upper panel, lies along the [100] symmetry direction.
Temperature dependent studies were made for all three frequencies from 1.35 K to 12 K (crystal A) and from 0.36 K to 12 K (crystal B) and analyzed in the standard way by fitting the data to the damping factor [Eq. (1)]. Fits for crystal B are shown in Fig. 3, and values of obtained in this way for both crystals are given in Table 1. Measurements of were made with approximately 20∘ off a symmetry axis. The values in Table 1 have been multiplied by [or ] to correct for the usual angular dependence of the mass for a tubular band. This correction is less than 8%.
| orbit | ||||
| Freq. [T] | A | 535 | 1530 | 2688 |
| B | 546 | 1533 | 2685 | |
| 728 | 1756 | 2889 | ||
| Mass | A | 0.53 0.01 | 0.6800.03 | 0.4460.01 |
| B | 0.553 0.01 | 0.648 0.01 | 0.441 0.01 | |
| 0.251 | 0.312 | 0.315 | ||
| [ps], ( [Å]) | A | 0.18 (500) | 0.18 (660) | 0.10 (750) |
| B | 0.14 (380) | 0.15 (580) | 0.09 (680) |

In the inset to Fig. 3 we show the angular dependence of the dHvA amplitude near [100], for both crystals. There is a pronounced dip between 14∘ and 18∘. The slight difference for the two crystals is ascribed to small alignment errors about an axis perpendicular to the axis of rotation. No such dip was observed for and . We believe the dip for is a ‘spin-zero’, which is often observed in dHvA studies when the areas of spin-up and spin-down extremal orbits differ by a half-integral number of Landau quanta, leading to destructive interference in the oscillatory magnetization. This dip was shown to persist to at least 4.2 K. Since comes from a tubular surface, whose effective area , it is easily shown that such zeros occur at angles given by , with . As before, includes band effects and electron-electron enhancement but not electron-phonon enhancement of the standard type shoenberg . This is because the Pauli susceptibility of a metal can be enhanced by electron-electron interactions, e.g., by the Stoner mechanism, but not by the electron-phonon interaction. Our data give , and for and this gives .
The scattering rates of the three orbits were extracted using two procedures. We either subtracted a smoothly varying background and fitted the whole field sweep to Eq. (1) (or more precisely, /), or fitted Eq. (1) to 1.5 oscillations in to give the dHvA amplitude with the thermal damping factor removed (), as a function of . In both cases we used the values of from Table 1 in the factor and set = 1. In field regions where the sample is clearly in the normal state, the first method gives excellent fits to Eq. (1) for all three frequencies. Scattering times derived from fits for both crystals and all frequencies are shown in Table 1. Making the approximation that all three frequencies arise from circular areas in -space, we can obtain for each area and hence , and the mean free path . These are also shown in Table 1.
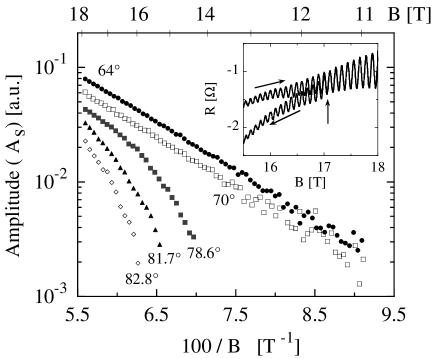
The second procedure removes thermal damping effects and reveals changes in the amplitude () versus plots caused by the onset of superconductivity below . As shown in Fig. 4 at angles of 70∘ or less, the usual exponential behavior is obtained, (with slopes 1/ as expected for a tubular surface). However, for angles nearer to the plane, the Dingle plots become non-linear because of additional damping caused by the growth of the superconducting gap, as has been observed in many superconductors (see for example Ref. janssen98 ). This observation proves that our dHvA signals arise from MgB2 rather than any impurity phase. The inset to Fig. 4 shows hysteresis arising from superconductivity that roughly corresponds to the onset of non-linearity in the Dingle plot. However, the slope of the Dingle plot for remains high above 17 T, suggesting that the superconductivity has not been entirely suppressed in the reversible region.
Recently, detailed bandstructure calculations, including estimates of dHvA frequencies and masses, have been carried out by three independent groups harima ; mazin02 ; elgazzar02 . All calculations predict two warped cylinders along the direction and two honeycomb networks in the basal plane. Comparison of the calculated frequencies with our experimental data shows that and arise from the smaller warped cylinder along the -axis while corresponds to the electron-like, in-plane tubular network whose median plane contains the A,H and L symmetry points. The discrepancies with theory are less than 300 T (see Table 1) which is only 0.2 % of the area of the hexagonal Brillouin zone. Therefore, we can confidently compare our experimental values of with the calculated values of to obtain the electron-phonon enhancement factors (). We find = 1.20, 1.08 and 0.40 for , and respectively, which compare favorably with the calculated values = 1.25,1.25 and 0.47 (Refs. liu01 ; mazin02 ; choi02 ).
The detailed angular dependence of , and has been calculated by Harima harima . We find this also agrees with our data and supports the Yamaji analysis given above. The calculated values of for also allow us to estimate the Stoner enhancement of the susceptibility. We find the enhancement on this orbit, which is twice the calculated value of 0.26 mazin02 .
The remaining discrepancy with theory concerns the absence of other dHvA orbits in the present study, particularly those arising from the second -axis tube and the other in-plane network (band 4 in the notation of Ref. harima ). In view of the discrepancies of 300 T mentioned above, it is possible that the smallest orbits ( T) are actually even smaller or absent. The non-observation of the other orbits could well be due to the relatively short mean-free-path of our crystals. Experiments to higher field and/or with purer crystals will clarify this point.
In summary, we have presented dHvA data for two single crystals of the new superconductor MgB2 that are in excellent agreement with each other and in good agreement with the most recent band structure calculations. The present work provides direct evidence that the electron-phonon interaction is large on the inner -axis cylinder and much smaller on the in-plane honeycomb network. This supports microscopic theories of superconductivity that invoke two bands with very different properties liu01 ; shulga01 .
JRC is grateful to D. E. Farrell for introducing him to the cantilever technique during a sabbatical year in Cambridge in 1997 and to J. W. Loram and W. Y. Liang for their support. We thank S. Drechsler, H. Harima, S. M. Hayden, J. Kortus, I. Mazin, M. Springford, G. Santi, and J. A. Wilson for helpful discussions. This work was supported by the NEDO (Japan) as Collaborative Research and Development of Fundamental Technologies for Superconductivity Applications and the EPSRC (U.K.). PJM gratefully acknowledges the support of the Royal Society (London).
References
- (1) J. Nagamatsu, N. Nakagawa, T. Muranaka, Y. Zenitani and J. Akimitsu, Nature 410, 63 (2001).
- (2) S.L. Bud’ko et al., Phys. Rev. Lett. 86, 1877 (2001).
- (3) F. Bouquet et al., EuroPhys. Lett. 56, 856 (2001).
- (4) X.K. Chen, M.J. Konstantinović, J.C. Irwin, D.D. Lawrie and J.P. Franck, Phys. Rev. Lett. 87, 157002 (2001).
- (5) P. Szabó et al., Phys. Rev. Lett. 87, 137005 (2001).
- (6) F. Manzano, A. Carrington, N.E. Hussey, S. Lee, A. Yamamoto, S. Tajima, Phys. Rev. Lett. 88, 047002 (2002).
- (7) A.Y. Liu, I.I. Mazin and J. Kortus, Phys. Rev. Lett. 87 087005 (2001).
- (8) S.V. Shulga, S.-L. Drechsler, H. Eschrig, H. Rosner, and W.E. Pickett, cond-mat/0103154.
- (9) see for example, J. Kortus, I.I. Mazin, K.D. Belashchenko, Phys. Rev. Lett. 86, 4656 (2001).
- (10) H. Uchiyama, K.M. Shen, S. Lee, A. Damascelli, D.H. Lu, D.L. Feng, Z.-X. Shen, and S.Tajima, cond-mat/0111152.
- (11) D. Shoenberg, Magnetic Oscillations in Metals, (Cambridge University Press,1984). ISBN 0521 224802
- (12) S. Lee, H. Mori, T. Masui, Y. Eltsev, A. Yamamoto and S. Tajima, J. Phys. Soc. Japan 70, 2255 (2001).
- (13) C. Lupien, B. Ellman, P. Grütter and L. Taillefer, Appl. Phys. Lett. 74, 451 (1999).
- (14) C. Bergemann, Ph.D. Thesis (University of Cambridge) (1999).
- (15) The piezolever sensitivity was Nm/ (low field measurements in the diamagnetic state showed that this factor changed by less than 5 % between 1.4 K and 10 K). Typical noise levels were m (Nm).
- (16) A. Wasserman and M. Springford, Adv. Phys. 45, 471 (1996).
- (17) K. Yamaji, J. Phys. Soc. Japan 58, 1520 (1989).
- (18) T.J.B.M. Janssen, C. Haworth, S.M. Hayden, P.J. Meeson and M. Springford, Phys. Rev. B 57, 11698 (1998).
- (19) H. Harima, cond-mat/0201452 (to appear in Physica (Amsterdam) C); and private communication.
- (20) I.I. Mazin and J. Kortus, cond-mat/0201247.
- (21) S. Elgazzar et al., cond-mat/0201230; H. Rosner et al., cond-mat/0203030.
- (22) H.J. Choi, D. Roundy, H. Sun, M.L. Cohen, and S.G. Louie, cond-mat/0111182.