First time determination of the microscopic structure of a stripe
phase:
Low temperature NMR in La2NiO4.17
Abstract
The experimental observations of stripes in superconducting cuprates and insulating nickelates clearly show the modulation in charge and spin density. However, these have proven to be rather insensitive to the harmonic structure and (site or bond) ordering. Using 139La NMR in La2NiO4+δ with , we show that in the hole doped nickelate below the freezing temperature the stripes are strongly solitonic and site ordered with Ni3+ ions carrying in the domain walls and Ni2+ ions with in the domains.
pacs:
PACS numbers: 76.60.-k, 74.72.Dn, 75.30.Ds, 75.40.GbStripe phases have by now been observed in a variety of doped Mott-insulators, like cuprates, nickelates and manganites[1]. Nevertheless there is still a remarkable lack of knowledge on the details of the charge- and spin distributions in these novel electronic phases. At the same time there is a growing body of theoretical literature dealing with the microscopic origin of stripe formation, predicting stripes starting from rather different physical perspectives[1, 2, 3, 4, 5]. Given its potential connections for instance to the mechanism of superconductivity, it is a matter of high urgency to find out how the stripes look like in detail. In this regard the various theories lead to quite different predictions. Because the spin- and charge distributions are inhomogeneous, NMR with its microscopic sensitivity could in principle yield important information. However, in cuprates attempts in this direction have been frustrated due to the anomalous, glassy ordering dynamics obscuring the static signal. Neutron scattering shows that both in cuprates and nickelates the correlation length of the stripe order is relatively small. This disorderly nature comes to play in NMR [6, 7] in the form of a peculiar loss of signal intensity (wipe-out)[6, 7, 8, 9, 10, 11] explained by a spread in very short spin-dephasing times [6, 10, 11]. Even at the lowest temperatures the signal recovery is only partial indicating that this dynamics is still at work at temperatures as low as 0.3 K in the cuprates, prohibiting attempts to deduce information about the static order from the NMR data [7]. We demonstrate here that in a nickelate stripe system the nature of the stripe order (established by neutron scattering) can be deduced in detail from NMR, despite the strong similarities with the cuprate NMR at higher temperatures. We find the stripe structure to be strongly solitonic, with sharply defined charge stripes with a width which is not exceeding the lattice constant by much. Surprisingly, they look quite like the site centered stripes predicted by early mean-field calculations for the nickelate system[12].
Before analyzing the low temperature line shape, which is the central issue of this Letter, we first introduce the main features of the NMR line shape, derive the value of the hyperfine coupling and explain the partial recovery of the signal intensity from the relaxation data.
The NMR measurements were performed on the same La2NiO4.17 crystals as measured before[9, 13], by sweeping the external field at various frequencies. The crystal symmetry is almost tetragonal[14], which makes the 139La-spectra () strongly dependent on the direction of the magnetic field with respect to the crystallographic axes.
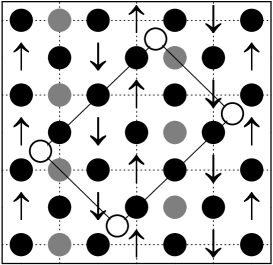
In La2NiO4.18, with hole doping very close to La2NiO4.17, details about the excess oxygen atoms positions are available[14]. The interstitial oxygen sites are at (0.183a, 0.183b, 0.217c) or equivalent positions. A scenario for the excess oxygen ordering is shown in Fig.1. There is one excess oxygen atom for each six unit cells. The number of 139La sites, which are far from the excess oxygen atoms, is twice as large as the number closest to the excess oxygen atoms. For La2NiO4.17, using simple point charge calculations, we expect the interstitial oxygen to change the electrical field gradient (EFG) around the La-sites and to split the 139La NMR line into two: an A-line due to A-sites with the main component of the EFG () along the -axis and a B-line due to two times less abundant B-sites with the crystal field gradient in the ()-plane. This prediction is in agreement with the experimental intensity ratio of line A to B [9, 15].
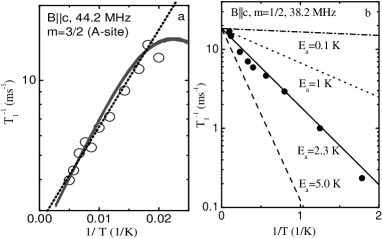
Above 50 K, the 139La relaxation rates can be fitted by an Arrhenius expression , see Fig. 2a [9]. Fits allow for a (full or half gaussian) distribution in activation energies around K with a width of K. Above the magnetic freezing temperature the rates for line A are at least twice the rates of line B, and have almost the same temperature dependence [9]. To extract the amplitude of the fluctuating fields and its correlation time from the relaxation data, the value of the hyperfine constant is needed. This constant can be determined in several ways. In doped La2CuO4 the static internal magnetic field amounts to about 0.1 T [6], which is similar to the value found in the undoped case [16]. Because the hyperfine field at the lanthanum site in the nickelates is calculated to be about 18 times larger than in the cuprates [17], its value will be around 1.8 T. Yoshinari [18] reported a value of about T/ for the hyperfine coupling in Sr-doped nickelates with an ordered moment of . The so obtained internal field of 1.6 T agrees well with the internal field of about 1.78 T reported by Wada et al. [19] for La2NiO4.10. Also by comparing our susceptibility and linewidth data at high temperature we can estimate the hyperfine field to be about 2.0 T, consistent with the earlier quoted values [13]. Using a hyperfine field of 1.8 T, the fit to the relaxation data gives a value of 2600 s-1 for , and hence s. has almost the same dependence as . It deviates only for K.
The relaxation data below 20 K can not be fitted by the same parameters, see Fig. 2b. The rates can be reproduced by , with K and the strength of the fluctuating field. Measurements of the rates were performed for different satellites at 38.2 MHz. Using the same methods as described in Ref.[6], a magnetic origin for the fluctuating fields is found at 160 K, 90 K and 1.6 K.
The wipe-out of the 139La NMR signal intensity and its partial reappearance below 11 K [9] can be explained in the same terms as used before in the cuprates [6] indicating a distribution in spin dephasing times, hence activation energies[15]. At low temperatures only nuclei relaxing with activation energies lead to the measured signal, while the others will have dephasing rates higher than Hz down to very low temperatures. Even at 0.5 K slow spin fluctuations apparently prevent the full recovery of the signal. The intensity recoveries can be fitted with K and K[15]. These results are consistent with the relaxation data because only nuclei with the higher activation energies will be visible.
What are the implications of these observations? In the renormalized classical limit below charge ordering the spin correlation rate will be proportional to the spin correlation length divided by the spin wave velocity : , with the spin stiffness[6, 7]. In La2NiO4.17 according to diffraction studies the stripes have a finite and temperature independent correlation length[20, 21]. If this has a dynamic origin, it will be consistent with a distribution in activation energies or ’s. Possible sources for such a distribution in the spin dynamics are dislocations [22, 23] in the domain pattern or elastic deformations [23].
We now come to the central part of this paper. We will show that although the interstitial oxygens have a direct influence on the La signal via the electric field gradients, it is still possible using 139La NMR to probe the charge and spin ordering in the NiO2 plane.
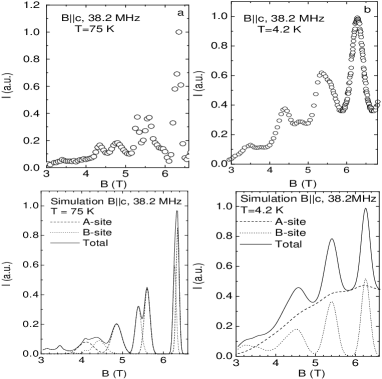
Below 15 K, when the signal starts to regain some of its intensity, the NMR lines are largely broadened. In Figs. 3,4 the spectra are shown for and . Simulations of the spectra taking into account the quadrupolar and Zeeman contributions [24] are shown in the lower panels. The spectra can be decomposed into 2 La sites, one with resolved satellites and the other with overlapping lines due to much stronger magnetic broadening. Magnetic freezing or ordering is also visible in the bulk magnetic susceptibility, which starts to deviate from the Curie law and peaks at K[9, 13, 25]. The peak in indicates a series of cusps at different spin freezing temperatures close to 17 K and can be due to spin frustration or spin clusters[25].
We first show that contrary to the observation in the cuprates [7], the low temperature line pattern in the nickelate is not due to motional narrowing. In case of two lines separated by the condition for motional narrowing [6, 24] is that the correlation time for the (spin) fluctuations is much less than . The splitting is given by times the value of the internal field : . The value of is coupled to the relaxation rate via . Hence the condition can be rewritten as . Using typical values for T, MHz and s, .
What is the information we might extract from the lineshape data? The high data will be sensitive for the EFG parameters and the low data in addition for the internal or local field. Since the internal field lies in the -plane, the spectra for will be rather insensitive to the local field. For the antiferromagnetic alignment of the electron spins we expect to lead to a splitting of the lines. The simulations of the spectra are shown in the lower panels. The principal axes of the EFG with respect to the crystal axes are described by Eulerian angles () [26] and the external magnetic field is described by polar angles () with respect to crystallographic axes.
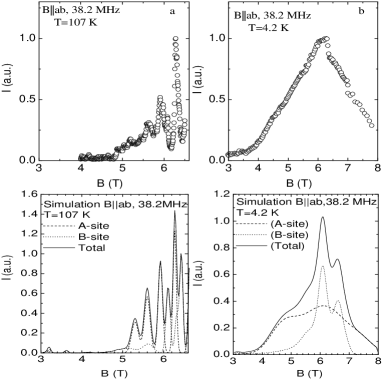
For () the high data (e.g. at 75 K) at 38.2 MHz are well reproduced by a quadrupolar splitting (with the electric quadrupole moment of the 139La-nucleus) of 4.5 MHz. The anisotropy parameter . The width of the satellites in the spectra can be simulated by introducing a spread in the EFG parameter MHz, while the width of the main line requires a (dipolar) field distribution of 0.05 T at the La(A)-site. For the La(B)-site these values are =8.5 MHz, , MHz and T. The other parameters are for the A-site: ; for the B-site: . According to the simulation of the low temperature data the main effect of the magnetic freezing is the increase of the magnetic broadening ( to 0.5, resp. 0.15 T. The spectra shown use internal fields of 1.5 T at the A-site and 0.5 T at the B-site. These internal field values follow from the simulations for , where the values are much more restricted. For the orientation simulation of the 107 K data with the same parameter set as for reproduce the data well (). For the 4.2 K data the antiparallel alignment of the internal field leads to a splitting of the lines and is described by polar angles () with respect to crystallographic axes.
To explain these remarkable differences, let us assume that we deal with site centered stripes. These stripes naturally lead to two kinds of Ni-ions: Ni2+ (A-sites) and Ni3+ (B-sites) with two kinds of spins and respectively. As a consequence the La sites will experience different hyperfine fields. The internal dipolar magnetic field arising from the Ni-spins at the La-sites will be of the order of 0.2 T. However, the La nuclei just above and below Ni2+ in addition will have an exchange coupling via the oxygens. This hyperfine field due to the overlap of the Ni 3d and La 6s orbitals through the 2pz orbital of apical oxygen, is about 1.8 T in the undoped samples and is almost doping independent[27]. Due to the different occupation of the 3d orbital of Ni3+ the exchange coupling between the Ni3+ spins and the La sites will be weaker[28, 29]. The ratio between 139La sites that feel the exchange field of Ni3+ and Ni2+ will be close to 1:2. This difference in intensity ratio and hyperfine field are indeed the main characteristics of the line shape and hence are well accounted for by this scenario. Can bond centered stripes explain the observations as well? The hyperfine fields will have the same maximum, but the distribution will be different. The line shapes for puts a limit to the field on the B sites of at most 0.3 T, which rules out this possibility.
The experiments show that apart from the internal field we need to introduce an appreciable magnetic broadening. Part of the broadening might be due to canting of the spins in the ordered phase in the NiO2-plane away from the charge and spin stripe direction[21], which effect we have not included into this calculation. Another reason for the extra broadening might be found in the finite size of the correlated magnetic regions.
Summarizing, in La2NiO4.17 interstitial oxygens determine the line profile above the wipe-out temperature. The NMR intensity loss above the spin freezing or ordering temperature around 20 K is linked to a spread in spin-dephasing as in the cuprates. From the angular and temperature dependence of the La line profiles, we show that the distribution of the internal fields is in agreement with two kinds of Ni-sites with different ionicity and hence different hyperfine interaction with the visible La sites. Site centered stripes of the kind predicted by mean-field theory[12] fit the low temperature data of the visible La-nuclei remarkably well.
We like to acknowledge A.A. Menovsky, A.A. Nugroho and Y. Mukosvkii for providing the nickelate samples, O.O. Bernal and P.M. Paulus for useful discussions, and O. Berfelo for performing the TGA. This work was supported by FOM-NWO.
REFERENCES
- [1] V.J. Emery, S. A. Kivelson and J. Tranquada, Proc. Ac. Sci. USA 96, 15380 (1999), and ref.’s therein.
- [2] J. Zaanen, J. Phys. Chem. Sol. 59, 1769 (1998), and ref.’s therein.
- [3] S.R. White and D.J. Scalapino, Phys. Rev. Lett. 81, 3227 (1998).
- [4] M. Vojta, Y. Zhang and S. Sachdev, Phys. Rev. B 62, 6721 (2000).
- [5] Proceedings of the third international conference on stripes and high Tc superconductivity, Rome 2001, eds. N.L. Saini and A. Bianconi, Int. J. Mod. Phys. B 14, nr. 29-31 (2001).
- [6] G.B. Teitel’baum et al., Phys. Rev. B 63, 020507(R) (2001).
- [7] A.W. Hunt, P.M. Singer, A.F. Cederström, and T. Imai, Phys. Rev. B 64, 134525 (2001).
- [8] A.W. Hunt, P.M. Singer, K.R. Thurber, and T. Imai, Phys. Rev. Lett. 82, 4300 (1999); P.M. Singer, A.W. Hunt, A.F. Cederström, and T. Imai, Phys. Rev. B 60, 15345 (1999).
- [9] I.M. Abu Shiekah et al., Phys. Rev. Lett. 83, 3309 (1999).
- [10] N.J. Curro et al., Phys. Rev. Lett. 85, 642 (2000).
- [11] B.J. Suh et al., Phys. Rev. B 61, R9265 (2000).
- [12] J. Zaanen and P. B. Littlewood, Phys.Rev. B 50, 7222 (1994).
- [13] O.O. Bernal et al., Physica C 282-287, 1393 (1997).
- [14] A. Mehta and P.J. Heaney, Phys. Rev. B 49, 563 (1994).
- [15] I.M. Abu-Shiekah, Ph-D. thesis, Leiden 2001.
- [16] D.E. MacLaughlin et al., Phys. Rev. Lett. 72, 760 (1994).
- [17] M. Takahashi, T. Nishino and J. Kanamori, J. Phys. Soc. Japan 60, 1365 (1991).
- [18] Y. Yoshinari, P.C. Hammel, and S.-W. Cheong, Phys. Rev. Lett. 82, 3536 (1999).
- [19] S. Wadat et al., J. Phys: Condens Matter. 5, 765 (1993).
- [20] C-H. Du et al., Phys. Rev. Lett. 84, 3911 (2000).
- [21] S.-H. Lee, S.-W. Cheong, K. Yamada, and C.F. Majkrzak, Phys. Rev. B 63, 060405(R) (2001).
- [22] J. Zaanen, Phys. Rev. Lett. 84, 753 (2000).
- [23] O. Zachar, Phys. Rev. B. 62, 13836 (2000).
- [24] C.P. Slichter, Principles of Magnetic Resonance, Springer 3thed. (1991).
- [25] P. Odier, N.J. Poirot, P. Simon, and D. Desousa Meneses, Eur. Phys. J. AP 5, 123 (1999).
- [26] H. Goldstein, Classical Mechanics, Addison-Wesley, London 1950.
- [27] Y. Furukawa and S. Wada, J. Phys: Condens Matter. 6, 8023 (1994).
- [28] E. Pellegrin et al., Phys. Rev. B 53, 10667 (1996).
- [29] V.I. Anisimov et al., Phys. Rev. B 59, 7901 (1999).