Entropic effects on the structure of Lennard-Jones clusters
Abstract
We examine in detail the causes of the structural transitions that occur for those small Lennard-Jones clusters that have a non-icosahedral global minima. Based on the principles learned from these examples we develop a method to construct structural phase diagrams that show in a coarse-grained manner how the equilibrium structure of large clusters depends on both size and temperature. The method can be augmented to account for anharmonicity and quantum effects. Our results illustrate that the vibrational entropy can play a crucial role in determining the equilibrium structure of a cluster.
I Introduction
The determination of a cluster’s equilibrium structure is a challenging task for the theoretician. For small clusters the first aim is usually to determine the lowest-energy minimum on the potential energy surface using global optimization tools. The global minimum must be the equilibrium structure at zero temperature, and it is usually hoped that it will provide a good guide to the structure at higher temperatures. By locating the global minimum as a function of size a detailed picture of the cluster structure and the non-monotonic variation of cluster properties can be obtained. This can then allow a detailed comparison with experiments on size-selected clustersParks97 and mass spectroscopic studies where the abundances provide an indicator of particularly stable clusters.Harris84 ; Northby87 ; Martin96
However, global optimization becomes increasingly difficult as the size increases, because of the exponential increase in the number of minima.Tsai93a ; Still99 Furthermore, optimization of some sizes may be particularly difficult because the potential energy surface has an unfavourable topography.Doye99f ; Leary00 ; Doye01c These effects limit the size for which global optimization is feasible. For example, for the simple Lennard-Jones (LJ) potential, after extensive study and computational effort, it is likely that the true global minimum for all LJ clusters up to 150 atoms have now been found.Northby87 ; Deaven96 ; WalesD97 ; CCDLJ However, the last new putative global minimum in this size range was found as recently as 1999.Leary99 Plausible putative global minimum have also been found up to =309.Romero99 ; Hartke00 For more complex potentials the present maximum feasible size is of course likely to be considerably smaller.
Some clusters already exhibit bulk-like structures in the sizes accessible by global optimization (e.g. the alkali halides with rocksalt structureTwu90 ), however many do not. Extreme examples are provided by sodium clusters, which exhibit icosahedral structures up to at least atoms,Martin90 and by boron suboxide particles, which can have Mackay-like icosahedral structures with atoms.Hubert98
Therefore, to go beyond the maximum size feasible for global optimization a different approach is necessary. This is possible if one settles for a more coarse-grained picture of the size evolution of cluster structure. So, rather than focussing on the the detailed size dependence, the general competition between structural types is instead followed. The question is then what type of structure is most likely to be lowest in energy in a particular size regime, rather than what is the particular arrangement of the atoms in the lowest-energy minimum.
Typically the energies of particularly stable sequences are compared to locate the crossover size at which the structure of the lowest-energy sequence changes. This method is commonly used and so crossover sizes have been estimated for LJ clusters,Xie ; van89 ; Raoult89a metal clusters for elements such as tungsten,Marville87 nickel,Cleveland91 sodium,Wang lead,Lim , iron,Besley95 gold,Cleveland97b calcium and strontium,Hearn97 rhodium and palladium,Barreteau00 and aluminium;Turner00 and molecular clusters for molecules such as N2,Calvo99a CO2Maillet99 and SF6.Boutin94
To get accurate crossover sizes it is important that the lowest-energy sequences for each structural type are used. The shapes of the optimal sequences are those that most closely resemble the polyhedron derived from the Wulff construction (or a modified form of it for non-crystallographic structuresMarks84 ), which minimizes the surface free energy. However too many of the studies using this approach compare sub-optimal clusters.Xie ; Lim ; Besley95 ; Hearn97 ; Barreteau00 For example, it is particularly common to compare Ino decahedra and fcc cuboctahedra to Mackay icosahedra, because they can have exactly the same sizes, even though the most stable sequences are likely to more closely resemble truncated octahedra and MarksMarks84 decahedra.
As only the energies of the sequences are computed, the crossover sizes derived are only strictly valid for zero temperature. Usually the possible effects of temperature on these crossovers are neglected, and it is hoped that they will provide a reasonable guide for higher temperatures. This neglect is probably because a simple way to compute the entropic contribution to the free energy of a structural type has not been available. Similarly in experiments on the evolution of cluster structure, size is usually the only variable that is considered, and so a single (presumably temperature independent) crossover size is presented.Farges88 ; Kakar97 ; Torchet96 ; Reinhard97
However, there is an increasing body of theoretical evidence that thermal effects can play a key role in determining a cluster’s structure. There are a growing number of examples of solid-solid transitions in clusters where the structure changes from fcc or decahedral to icosahedral as the temperature increases. Such transitions have been found to occur for those small LJ clusters that have a non-icosahedral global minimum,WalesD97 ; Doye98a ; Doye98e ; Doye99c ; Leary99 for gold clustersCleveland98 ; Cleveland99 , for clusters interacting with a variable range Morse potential.Doye95c ; BerryS00 and even for models of clusters of C60 molecules.Calvo01d ; Doye01e For molecular clusters, where low-pressure solid-solid or orientational phase transitions occur for bulk, there has also been much interest in the size-dependence of the transition temperature. e.g. SF6.Boutin94 ; Torchet95
Here we examine in detail the effects of entropy on the equilibrium structure of LJ clusters. In Section II we focus on the solid-solid transitions in those LJ clusters that have a non-icosahedral global minimum. In particular we examine the different contributions to the entropy in detail. Using the principles learned from these examples, in Section III we introduce methods to estimate the free energy of stable sequences of structures. Thus we are able to construct structural phase diagrams showing how the structure depends upon both size and temperature. There has been a previous attempt to calculate such structural phase diagrams based upon macroscopic estimates of the different contributions to the free energy of a structure.Ajayan88 However, it is unclear how valid the approximations made in that study are, in particular the applicability of the macroscopic concepts to a small cluster. Clearly, a much more satisfactory approach is, as here, to compute the free energies directly from microscopic properties. Finally in Section IV we consider some of the other factors that determine cluster structure and how these effect the comparison with experiment. A brief report of some of this work has already appeared.Doye01b
II Solid-Solid transitions
The atoms in the clusters interact via a Lennard-Jones potentialLJ and so the total potential energy is:
| (1) |
where is the pair well depth and is the equilibrium pair separation.
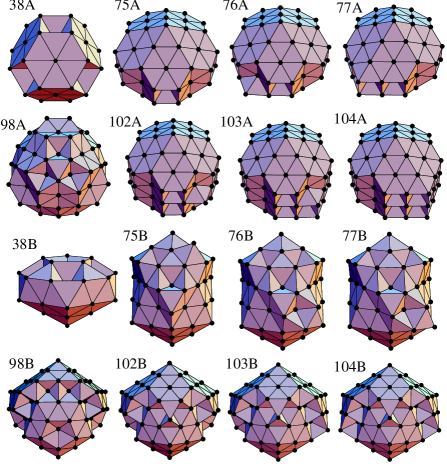
Most LJ global minima for have structures based upon the series of MackayMackay icosahedra.Northby87 ; Romero99 However, there are a number of non-icosahedral global minima. These occur at sizes where the non-icosahedral morphology has a near optimum shape, whereas the icosahedral structures have an incomplete outer layer. For there are 8 such cases, which correspond to the fcc truncated octahedron at =38,Gomez94 ; Pillardy ; Doye95c the Marks decahedra at =75–77 and 102–104,Doye95c ; Doye95d and the Leary tetrahedron at =98.Leary99 These global minima and the lowest-energy icosahedral minima for these sizes are depicted in Figure 1. In the range there are a further eight non-icosahedral global minima which are clustered in two sets around the complete Marks decahedra at =192 and 238.Romero99 ; Hartke00
For these examples it has been found that the global minima are not the most stable structure up until the cluster melts, but that a low-temperature solid-solid transition occurs at which icosahedral structures become thermodynamically more stable.WalesD97 ; Doye98a ; Doye98e ; Doye99c ; Leary99 However, these transitions are difficult to probe because there are large (free) energy barriers between the structural types,Doye99c ; Doye99f making the dynamics of the transition extremely slow. They occur on time scales way beyond those accessible with conventional molecular dynamics. For example, at the centre of the transition for LJ38 the rate constant has been estimated to be 43s-1 (using parameters appropriate for Ar).Miller99b The equivalent rates for the larger clusters are likely to be orders of magnitude smaller.
The only simulation method that has been able to directly compute the equilibrium thermodynamics of the solid-solid transitions of any of these clusters is parallel tempering Marinari92 (and its variantsCalvo01a ). Exchange of configurations between Monte Carlo runs at different temperatures allows ergodicity to be achieved at the low temperatures relevant to the solid-solid transitions. However, even for the smallest example, LJ38, this method is computationally demanding.Neirotti00 ; Calvo00
The superposition method Wales93a ; Franke ; Doye95a ; WalesDMMW00 provides an alternative approach and one which is particularly useful for our present purposes because it allows us to analyse the different contributions to the entropy. In this approach the partition function is written as a sum over all the minima on the potential energy surface, i.e. , where is the partition function for the basin of attraction surrounding minimum . As long as all relevant minima are represented, ergodicity is ensured. The method is particularly simple to apply to solid-solid transitions as the number of minima that contribute to the transition is comparatively few. The method can also be applied to the melting of clusters, but in this case a statistical representation of the distribution of minima has to be used, because the number of minima associated with the liquid is, for all but the smallest clusters, too large to be enumerated.Doye95a Another particularly useful feature of the method is that, by restricting the sum to a certain subset of the minima, the thermodynamic properties of a particular region of configuration space can be obtained, i.e. , where is the partition function for region .
To apply this method to the solid-solid transitions in LJ clusters, we first generated large samples of low-energy minima for each cluster using established techniques for searching potential energy surfaces.Tsai93a ; Miller99a ; WalesDMMW00 Some of these samples had been generated previously in work on the characterization of the potential energy surface topography of LJ clusters using disconnectivity graphs.WalesMW98 ; Doye99f ; Doye01c The samples included thousands of minima, which is far more than would actually significantly contribute to the low-temperature thermodynamics. We then have to assume a form for the partition function of each minimum. Here, we use the harmonic approximation, which in the classical limit gives
| (2) |
where =, = is the number of vibrational degrees of freedom, is the potential energy of minimum , is the geometric mean vibrational frequency, and = is the number of permutational isomers of , where is the order of the point group.
This harmonic superposition method (HSM) has been shown to give a correct qualitative picture of cluster thermodynamics (even of the melting transition Wales93a ; Doye95a ), which becomes increasingly accurate at lower temperatures. Accurate anharmonic forms for are available,Doye95a ; Calvo01b ; Calvo01e but the derivation of the associated parameters characterizing the degree of anharmonicity adds an extra degree of complexity, which is unnecessary here given the low temperatures at which the solid-solid transitions occur.

For LJ38 the fcc to icosahedral transition has been previously shown to occur at roughly two-thirds of the melting temperature and to give rise to a feature in the heat capacity.Doye98a ; Doye98e ; Doye99c ; Neirotti00 ; Calvo00 For the other clusters the transitions give rise to peaks in the heat capacity at low temperature, as shown in Figure 2. For reference, melting transitions occur at roughly 0.2–0.3 for LJ clusters in this size range.Frantz95 ; Frantz01 Using the definition at the transition temperature, , where and represent the two competing structural types, we have calculated values for all the clusters (Table 1).
| HSM | Einstein | Eq. (6) | |||||
|---|---|---|---|---|---|---|---|
| 38 | 0.121 | 0.199 | 0.316 | 0.676 | 1.0200 | 31.7 | 4.8 |
| 75 | 0.082 | 0.234 | 0.119 | 1.210 | 1.0475 | 91.8 | 20 |
| 76 | 0.046 | 0.223 | 0.053 | 0.510 | 1.0446 | 4.32 | 2 |
| 77 | 0.048 | 0.199 | 0.057 | 0.565 | 1.0451 | 6.56 | 4 |
| 98 | 0.004 | 0.009 | 0.006 | 0.022 | 1.0135 | 12.0 | 12 |
| 102 | 0.013 | 0.096 | 0.014 | 0.086 | 1.0201 | 2.00 | 2 |
| 103 | 0.016 | 0.116 | 0.018 | 0.107 | 1.0204 | 2.00 | 2 |
| 104 | 0.007 | 0.069 | 0.008 | 0.048 | 1.0212 | 2.00 | 2 |
The transitions must clearly be driven by the greater entropy of the icosahedral structures, but there are a number of contributions to this entropy. Firstly, there is the configurational entropy due to the number of minima associated with a structural type. This has a component due to symmetry. The number of permutational isomers decreases as the order of the point group of a minimum increases. This term particularly favours the icosahedral structures at =38, 75 and 98, because of the high symmetry (, and ) of the non-icosahedral global minima. The other contribution to the configurational entropy comes from the number of distinct low-energy minima of a particular type. This term, of course, depends on temperature. At zero temperature only the lowest-energy minimum contributes to the partition function, , but as the temperature increases other low-energy minima begin to become populated. Furthermore, the contributions of other minima are greater the closer they are in energy to that of the lowest-energy minimum of that type. This term again favours the icosahedra because there are many low-energy icosahedral minima with different arrangements of the atoms in the incomplete outer layer.Doye99f

Secondly, there is the vibrational entropy. For the current examples the icosahedral structures have a smaller mean vibrational frequency (Table 1), which again favours the icosahedra. However, unlike the previous two contributions to the entropy, this term favours the icosahedra for a LJ cluster of any size, as illustrated by Figure 3, where (normalized to remove the non-specific size-dependence) is plotted for the LJN global minima. Although there is a considerable variation in for the icosahedral structuresMaM (the complete Mackay icosahedra are the most rigid and those with an incomplete outer layer can have values considerably smaller than ), only the vibrational frequencies for the non-icosahedral global minimum are greater than .
We can quantitatively analyse these contributions to the entropy and their effect on . We can neglect the differences in vibrational entropy by applying an Einstein-like approximation, where we assume that all the minima have the same mean vibrational frequency. The resulting values for are also given in Table 1. Although the transitions still occur, they do so at significantly higher temperature with the error increasing with size. For the largest cluster the estimate of is roughly ten times too large. This increasing importance of the vibrational entropy is because is raised to the power in the expression for the partition function of a minimum in Equation 2.
We can quantify the effects of the configurational entropy, if we rewrite as
| (3) |
where , the effective number of minima (both permutational and geometric isomers) associated with , is given by
| (4) |
Using the properties of the lowest-energy minimum in region to define and , we give the relative values of the effective number of minima in each region at the solid-solid transition in Table 1. We also give the values of , which correspond to the values of at zero temperature, where only differences in symmetry contribute.
As expected the effective number of icosahedral minima is greater. However, for the four largest clusters at because, although there are many low-energy icosahedral minima, the transition occurs at too low a temperature for them to be thermally populated, and thus to contribute to .
From Equation 3 we can obtain an expression for :
| (5) |
where =. Of course, this equation cannot be straightforwardly applied to find because is a function of temperature. However, if we ignore the differences in configurational entropy, this expression reduces to
| (6) |
The values of that results from applying this expression are given in Table 1. The values become noticeably more accurate as the size increases. This is because the vibrational term increasingly dominates over the configurational term in the denominator of Equation (5).
From this analysis we have shown that differences in vibrational entropy are crucial to the occurrence of these solid-solid transitions. This conclusion is further strengthened by the absence of any solid-solid transitions when the LJ global minimum is icosahedral. These results, therefore, suggest that solid-solid transitions, rather than being unusual, should be expected for systems where different structural types have systematic differences in at sizes where the morphology with smaller vibrational entropy is the lowest in energy.
III Structural phase diagrams
Our aim is to produce a structural phase diagram showing how the LJ cluster structure depends on both size and temperature which is applicable to large clusters. At the relevant sizes (the energetic crossovers occur for clusters with thousands of atomsRaoult89a ) it is clearly not feasible to obtain large samples of minima as we have done for the examples considered in the previous section. Methods are available to estimate the energy distributions of minima for large clusters,BerryS00 however these are involved and although possible for individual clusters are not feasible for a wide range of sizes.
Equation (6) potentially provides a more readily applicable approach, and as we have seen from the last section, this expression becomes more accurate as the size increases. Furthermore, its neglect of the differences in configurational entropy becomes more realistic in the coarse-grained approach we are seeking. Although there are likely to be significant differences in the numbers of low-energy minima for morphologies and for many sizes (as for some of the examples in the previous section), for some sizes but for other sizes and so on average they will be of the same order.
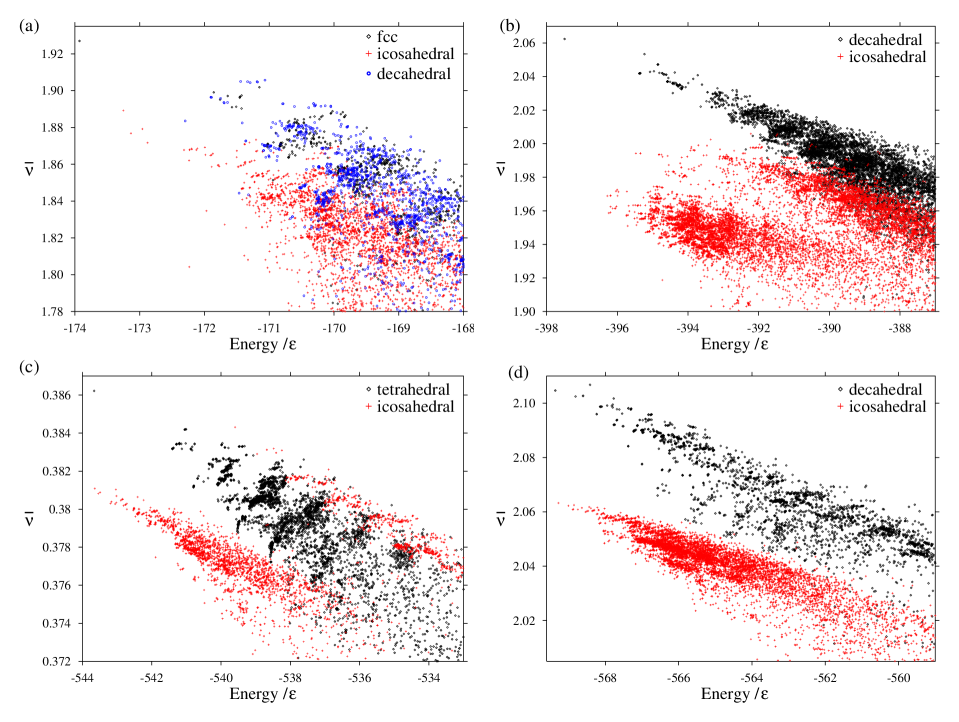
Equation (6) also ignores the potential variation of for minima of the same structural type. Therefore, if we are to use Equation (6), this variation should be significantly smaller than the difference in between structural types. Figure 4 illustrates that this is true using a selection of the examples from the last section. The geometric mean frequency is a good order parameter to distinguish the structure of minima, and the two bands of minima become increasingly distinct as the size increases.
It is also noticeable that for both structural types in each diagram there is a trend for the vibrational frequencies of the minima to linearly decrease as the energy increases. This is not unexpected. The higher energy minima tend to involve a less compact arrangement of the surface with fewer nearest-neighbour contacts and so have a lower frequency. The greater vibrational entropy of these minima is part of the reason why they are likely to become populated as the temperature increases. The creation of surface defects and increased surface diffusion result.Kunz93 ; Kunz94 ; Doye97b However, as the trends in with energy are similar for minima of both structural types, the use of Equation (6) is not compromised.
To use Equation (6) to determine how crossover sizes depend on temperature we need expressions for the size-dependence of and . Of course, it would be unfeasible to follow the detailed non-monotonic size variation of these properties over the size range we are interested in, because this would require the global optimization of many very large clusters. Instead, we can use the properties of stable sequences of structures to construct a coarse-grained structural phase diagram.
The energies and vibrational frequencies of these stable sequences can be fitted to the forms
| (7) | |||||
| (8) |
where the first two terms represent volume and surface contributions, respectively. These expressions can then be input into Eq. (6) to map out the solid-solid transitions in the structural phase diagram. To complete the diagram, the melting line has to be determined. Again it will have the form
| (9) |

The structural types that we should consider for LJ clusters are icosahedral, decahedral and fcc. We have not considered unstrained close-packed clusters other than fcc. Generally, fcc clusters will have a lower surface energy than hexagonal close-packed (hcp) clusters because it is easier to form fcc structures with a higher proportion of faces. Therefore fcc clusters are usually favoured over hcp. However, is slightly lower for hcp rather than fcc clusters due to a more favourable next-nearest neighbour shell, and so for sufficiently large sizes hcp clusters should be lower in energy. Similarly, it can be energetically favourable to introduce twin planes into fcc clusters.Raoult89a The differences in energy, though, are very small and this behaviour is different from the rare gases which form fcc crystals. Therefore, we do not attempt to model this subtle structural competition.
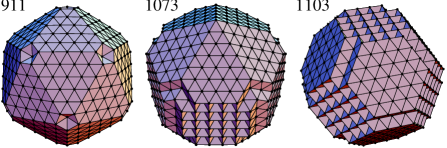
The energies of the most stable sequences for icosahedral, decahedral and fcc clusters are represented in Figure 5a, with the most stable sequences based on Mackay icosahedra, Marks decahedra and truncated octahedra, respectively. However, for each structural type there are small changes in the optimal shape as the size increases, as forms that more closely resemble the (modified) Wulff polyhedra become possible.Raoult89a This gives rise to the lobes in each of the lines. By =549 it becomes favourable for the vertices of the Mackay icosahedra to be unoccupied. As the size increases, facets of increasing size are introduced to make the Marks decahedral and truncated octahedral forms more rounded, and the grooves in the Marks decahedra become deeper.Raoult89a Three examples of structures that lie on the optimal lines are depicted in Figure 6
Up to the energies of these stable sequences of structures were obtained by minimization of all degrees of freedom. Above this size minimizations were possible up to for decahedral and for fcc structures if the cluster was constrained to maintain the correct point group symmetry ( for decahedral and for fcc). This constraint can reduce the computational cost by up to (i.e. 60 for , 24 for and 10 for ) while the errors in the energies of the minima arising from the use of symmetry are negligible. These sizes are significantly larger than have been used in previous studies.Xie ; van89 ; Raoult89a
As the energetic crossover between decahedral and fcc structures lies beyond the largest size for which we could minimize the energy, we also had to use Equation (7) to obtain fits to the low-energy envelope formed by the succession of optimal sequences, which would be valid to this crossover region. The resultant energetic crossover sizes (Table 2) are consistent with or an improvement upon the most comprehensive of the previous studies.Raoult89a
In order to calculate the Hessian matrix must be diagonalized. As the Hessian is not sparse—no cutoffs are applied to the potential so all atoms interact with each other—the cost of this operation scales as . This scaling limits the sizes for which can be calculated. It is unlikely that continuum elastic theory can provide a shortcut to obtaining the required vibrational information for large clusters, since, as a recent study of two-dimensional clusters showed, it only begins to give a good description of the lowest-frequency modes when the size is roughly 30 atomic diameters.Wittmer01
We have been able to characterize the vibrational properties of the three sequences shown in Figure 5b up to about atoms, and other sequences up to about 3500 atoms. As represents the volume contribution to the mean vibrational frequency, its value should be the same for all sequences of a particular structural type. Therefore, we used our most well-characterized sequences to determine for each structural type. This gave =0.50970, =0.51930, =0.52020. For other sequences we used the appropriate value, and then fitted the three remaining parameters.
| LJ | 0.000 | 1690 | 7440 | ||
|---|---|---|---|---|---|
| Xe | 0.010 | 1810 | 6510 | ||
| Ar | 0.030 | 2130 | 5500 | ||
| Ne | 0.095 | 4640 | 6230 | ||
To construct the melting line is assigned the value of the zero pressure bulk melting temperature vanderHoef00 and the other three parameters in Eq. (9) are fitted using the melting points of the first four Mackay icosahedra, which were obtained from Monte Carlo simulations. For the 309-atom cluster parallel tempering proved to be necessary to ensure ergodicity. For this cluster a low-temperature shoulder was seen in the heat capacity, which was indicative of a surface transition.Doye97b ; Hendy01

The structural phase diagram that results from these calculations is shown in Fig. 7. The phase boundaries divide the plane into regions where the majority of clusters have a particular equilibrium structure. As the size increases, there is the expected progression from icosahedral to decahedral to fcc clusters. The less-strained structures become favoured at larger as the effect of their lower values dominates over their less favourable surface energies. For the sequences of Figure 5b, =, =, =. Furthermore, the effect of the vibrational entropy can be clearly seen from the slopes of the phase boundaries in Fig. 7 and from the differences between the crossover sizes at zero temperature and the melting point (Table 2). At higher temperatures icosahedra and Marks decahedra remain most stable up to considerably larger sizes than would be expected from their energetic crossovers. This is because of the relative values of their vibrational frequencies: and are 2.06% and 0.19% less than , respectively. Lower values of are associated with structural types with a greater strain energy; the physical origin of this correlation will be explored elsewhere.
Interestingly, the effect of entropy is greater for the decahedral to fcc transition, even though the difference in is smaller. The larger value of in the denominator of Eq. (6) and the much smaller difference in more than compensate for the smaller difference in . For example, it can be easily shown that
| (10) | |||||
where =, ….
There has been much interest in the phase changes in clusters as the finite-size analogues of bulk phase transitions. The finite size, which can lead to unusual features, such as negative heat capacities,Labastie ; Schmidt01a causes any transition to occur not at a single temperature, but instead both phases can coexist over a range of temperature.Berry88 This is illustrated by the finite width of the peaks in Figure 2. We can easily estimate this coexistence range for our examples if we define the upper and lower limit of this coexistence range, , as the temperatures at which =(0.1,0.9) and (0.9,0.1). This gives
| (11) |
However, as the size at which these transitions occur is large, the term does not significantly effect the denominator and so the coexistence range is very small. When are plotted on Figure 7 the lines are indistinguishable from those for the mid-point of the transition.
The assumption of harmonicity was one of the approximations used to construct the structural phase diagram of Figure 7. It has been previously found that this approximation leads to an overestimate of roughly 10% in the value of the melting temperature for small LJ clusters, because the liquid-like state is significantly more anharmonic.Doye95a ; Calvo01e One would expect the errors to be less for because the differences in anharmonicity between two solid forms are likely to be much less and because the relevant temperatures are often much lower.
One can introduce the effects of anharmonicity via temperature dependent frequencies, i.e. , where is a measure of the anharmonicity.Calvo01b ; Calvo01e This then gives for the transition temperature:
| (12) |
As the temperature occurs on both sides of this equation, it would have to be solved self-consistently. Alternatively an approximate solution can be obtained by taking the first terms of the binomial expansion of the second log and then substituting in the harmonic expression for . This gives
| (13) |
The second term represents an anharmonic correction to . To apply this equation, estimates of the size dependence of would be required, which could then be fitted to a form equivalent to Equation (8). Methods are available to obtain ,Calvo01e but unfortunately we were not able to extend these to sufficiently large sizes to enable fits of sufficient accuracy to be generated that could be applied to the large sizes relevant to Figure 7.
We have also so far assumed that the clusters behave classically. However, it has recently been shown that quantum effects can have a significant effect on the thermodynamics of LJ clusters.Calvo01b We can apply these same methods to obtain quantum structural phase diagrams, which are applicable to the rare gases. The quantum equivalent of Equation (3) is
| (14) |
where includes the zero-point energy, and is the arithmetic mean frequency. To apply this equation to find it needs to be further simplified since it would require the characterization of the size evolution of the whole frequency distribution. To illustrate the potential effects of quantum delocalization, we choose the simplest approximation, namely to represent the distribution by modes at the mean frequency. Ignoring differences in the configurational entropy as before, this then gives
| (15) |
where .

The introduction of quantum effects can also lead to significant changes in the melting temperature of clusters.Neirotti00b ; Calvo01b Following Ref. Calvo01b, we simply model this change by
| (16) |
where the coefficients and have been obtained using results for small clusters,Calvo01b and is the de Boer parameter. is a measure of the quantum delocalization and corresponds to the value of in reduced units, i.e. .
We have calculated structural phase diagrams for values of the de Boer parameter that are appropriate to some of the rare gases. The results are illustrated in Figure 8 and Table 2. There are two competing effects on the structural phase diagrams resulting from the introduction of quantum delocalization. Firstly, the zero-point energy stabilizes those structures with lower frequencies, and therefore the zero temperature crossover sizes increase substantially as increases (Table 2). Indeed the differences between neon and the other rare gases at low temperature are large enough to be potentially observable, if equilibrium clusters can be grown in this temperature range. Secondly, for temperatures lower than the vibrational temperature , the vibrational contribution to the entropy is much less in the quantum case. This is a corollary of the fact that for a quantum harmonic well is close to zero at low temperature and only rises near to 3 above , whereas classically for all . Therefore, the temperature dependence of the crossover sizes are diminished, and the phase boundaries initially rises vertically from the x-axis and in some cases even cross the classical line.
IV Discussion

The development of the structural phase diagrams presented here provides the starting point for a more sophisticated discussion of the size evolution of cluster structure, which emphasizes the effect of both size and temperature. The one-dimensional picture which focusses on the effect of size and neglects thermal effects should be discarded. Therefore, we hope that this work will provide a stimulus for new experiments and calculations that seek to illuminate the role of temperature in determining structure. Indeed, recent experiments on clusters of C60 moleculesBranz00 and strontium clustersWang01 illustrate the interesting results that can be achieved. The methods developed here should be applicable to a wide range of materials, for which empirical potentials are available. An illustrative example for silver clusters modelled by the Sutton-Chen potentialSutton90 has already been provided.Doye01b This system has a structural phase diagram which was similar in form to that for LJ clusters. However, it would be particularly interesting to map out the different possible families of phase diagrams. For example, in sodium clusters there would also be additional competition between the icosahedral, decahedral and fcc structures considered here and clusters that are body-centred cubic. These methods could also be potentially applied to clusters in a matrix or on a surface.
This point of view should also help in comparisons of experiment and theory, and of different experiments. Firstly, it helps one not to jump to hasty conclusions. For example, if two experiments come to different structural conclusions for clusters of the same size, this does not necessarily imply that there has been a misinterpretation of the data; the differences might simply reflect different temperatures. Similarly, the failure of energetic calculations to reproduce the experimental observations does not necessarily imply the inadequacy of the theoretical description of the interatomic forces, because free energies need to be calculated for a rigorous comparison. Secondly, and more positively, theoretical and experimental agreement on the size and temperature dependence of structure would provide a strong vindication of the approaches used.
There are a number of aspects that should be born in mind when interpreting the structural phase diagrams. Firstly, they only provide a coarse-grained picture of the size evolution, dividing the phase diagram into regions where the majority of sizes have the same equilibrium structure. To construct the diagrams we have assumed a monotonic dependence of properties on (Equations 7, 8 and 9). However, as is well-known, most cluster properties show a complex non-monotonic size dependence, particularly for smaller clusters.Jortner Indeed, it is these size effects that are often of most interest.
This non-monotonicity is illustrated for in Figure 3 and for in Figure 9. Similarly, the variation in for small LJ clusters has been catalogued by Frantz.Frantz95 ; Frantz01 It is noticeable that the variations in and can be of a similar magnitude to the systematic differences between the structural types. For example, at three points the energies of the global minima in Figure 9 coincide with those for truncated octahedra (=38) and complete Marks decahedra (=75,192). Consequently, the real phase boundaries when resolved at the level of individual sizes will be much rougher than in Figure 7. Indeed, the examples in Section II correspond to small islands of stability for fcc and decahedral structures, within a sea of icosahedral dominance at small .
The relative importance of these variations does diminish with increasing size as the proportion of atoms in the surface decreases. Consequently, the coarse-grained approach used for the structural phase diagrams becomes more reliable at larger sizes, but should be applied with caution when crossovers occur for sizes with less than a few hundred atoms. There are other implications of this decrease in fluctuations. For example, it is clear from Figure 9 that the 38-atom truncated octahedron will be the only fcc global minimum up to at least =1000.
Secondly, the position of the phase boundaries in the diagrams sensitively depends on the, usually small, differences in the energetic and vibrational properties, in particular and , between structural types. It is asking a lot of an empirical potential to reproduce these properties accurately enough to give phase diagrams that could agree in detail with experiments. For the current example, where different structural types are all based in some sense upon close-packing but perhaps involving multiple twinning and hence strain, the crucial ingredients for the energetics would be a correct reproduction of the relative surface energies for , and faces, and the elastic moduli that determine the energetic penalty associated with the strain. Similarly, one would also want the potential to reproduce not only the bulk phonon dispersion curves, but also the effects of surfaces and strains on the vibrational properties. Furthermore, if one were to apply this approach to clusters, where, as for sodium, two different bulk structures could be adopted, the potential would also have to be able to reproduce the properties of both forms. However, most empirical potentials are only fitted to a small subset of these properties, usually those associated with the bulk. Therefore, given the current limitations associated with empirical potentials and the current impossibility of performing ab initio calculations for the relevant size ranges, it is perhaps better to use the tools developed here to understand the qualitative form of the structural phase diagram one would expect for a particular material.
Thirdly, the experiments one is seeking to compare with may not be at equilibrium. Evidence for the non-equilibrium nature of many clusters has come from a number of sources. It is suggested by the mixture of structures often observed for metal clusters, for example, when supported clusters are probed by electron microscopyMarks94 or x-ray diffraction;Zanchet00 greater structural uniformity would be expected for samples of equilibrium clusters. More rigorous evidence for the kinetic origin of this diversity comes from experiments that have shown that the structural composition can be changed simply through the cluster source conditions,Hall91 ; Reinhard97b and that well-defined structures are only obtained after careful annealing.Andres96 Similarly, it has recently been shown for clusters of C60 molecules that the equilibrium non-icosahedral structures are only located after annealing at high temperature.Branz00 ; Baletto01c
This difficulty of achieving equilibrium is also suggested by a range of recent theoretical results. For example, the potential energy surfaces of the examples in Section II have a multiple-funnel character, where the different funnels correspond to the different structural types.Doye99f This multiple-funnel character is not restricted to these examples but appears to be ubiquitous.WalesMW98 ; Doye99g ; Doye01a ; Doye01e As the (free) energy barriers between funnels are typically large, the dynamics of structural transformations can be very slow, giving rise to the possibility of kinetic trapping in out-of-equilibrium structures.
This effect is seen in recent growth simulations.Baletto00 ; Baletto01 Typically, above a certain size, which is dependent on the material, temperature and growth rate, structural transformations are unlikely, and so new growth then occurs around this preserved seed cluster. The results are particularly dramatic for (C60)N where perfect Mackay icosahedra are invariably formed, even though they are far from equilibrium.Baletto01c Similarly, it has been found that freezing of molten clusters give rise to a a mixture of products,Chusak01 where the relative amounts reflect the width of the respective funnels,Doye00c rather than the thermodynamics. These results emphasise that it will be difficult to obtain equilibrium when a structural type is only favoured at low temperature. This is particularly the case for the larger sizes often associated with the decahedral to fcc crossover.
Many of the above considerations are relevant when we seek to compare our results for Lennard-Jones clusters with experimental results for rare gas clusters. The first difficulty is that a clear-cut picture has not yet emerged from the experiments. The most easy to interpret data comes from mass spectroscopic studies of rare gas cluster ions. Clear magic numbers that are signatures of icosahedral packing have been observed for small clusters of argon,Harris84 ; Harris86 krypton and xenon.Echt81 ; Miehle89 The icosahedra have been observed up to =923, with no sign of any crossover to a different structural type.Miehle89 However, the situation is less clear for neon. In the only mass spectroscopy experiment on neon clusters, of which we are aware, no strong signal of shell effects was found.Mark87 It should also be remembered that there may be differences between the structure of ions and neutrals, as illustrated by recent calculations for Ne,Naumkin98a although these differences would be expected to be less important as the size is increased.
There have also been a series of experiments by Farges et al. using electron diffraction to probe argon clusters.Farges83 ; Farges86 ; Farges88 To reach a structural assignment the experimental diffraction patterns have to be compared to those calculated for structures of the appropriate size. Although this provides good evidence that small clusters are icosahedral with a suggested crossover from icosahedra at , it has proved to be much harder to obtain a good fit to experiment for larger clusters with neither decahedral or fcc structures providing adequate agreement. Van de Waal has investigated a series of models that provide better fits, which include features such as crossed stacking faults,van91 ; van93 crossed twinsvan96b ; van96a that could lead to faster growth. For very large clusters, however, adequate agreement could only be obtained from polycrystalline clusters, involving fcc, hcp and random close-packed domains.van00 These results again seem to confirm the difficulty of achieving equilibrium, and are further reinforced by simulations of the freezing of LJ clusters, in which a mixture of structural forms is observed for larger clusters.Ikeshoji01
Somewhat different conclusions have been reached from EXAFS experiments on argon clusters,Kakar97 in which fcc structures were suggested for clusters with more than 200 atoms. However, this conclusion was based on comparison with results obtained for a very limited set of candidate structures, and no estimate of the experimental temperature was given.
Given the above experimental situation it is not surprising that there is not yet full agreement between experiment and theory. Furthermore, although the LJ potential provides a reasonable description of the properties of the rare gases (including the phonon dispersion curvesDove ), it has well-known deficiencies.Maitland Therefore, one should not necessarily expect too close agreement for the crossover sizes. However, we believe the basic form of the structural phase diagram to be robust. Therefore, it would first be interesting to see if an icosahedral to decahedral crossover could be revealed for argon clusters as the experimental clusters are brought closer to equilibrium. Then, if this could be achieved, it would be interesting to see if the temperature dependence of the crossover size that we have predicted here was reproduced.
The results we have obtained for LJ clusters have highlighted the important role that differences in vibrational entropy can play in determining structure. Striking examples for the considerable effect of vibrational properties on phase diagrams have also been obtained for the thermodynamics of substitutional alloys.Ozolins01 ; Asta01 ; vandeWalle01 Similarly, in the field of supercooled liquids there have been recent suggestions, based upon simulation Sastry01 and calculations for model potential energy surfaces,WalesD01 that vibrational properties could play a key role in the complex interplay that gives rise to the distinction between fragile and strong liquids.
Acknowledgements.
JPKD is grateful to Emmanuel College, Cambridge and the Royal Society for financial support.References
- (1) E. K. Parks, G. C. Niemann, K. P. Kerns, and S. J. Riley, J. Chem. Phys. 107, 1861 (1997).
- (2) I. A. Harris, R. S. Kidwell, and J. A. Northby, Phys. Rev. Lett. 53, 2390 (1984).
- (3) J. A. Northby, J. Chem. Phys. 87, 6166 (1987).
- (4) T. P. Martin, Phys. Rep. 273, 199 (1996).
- (5) C. J. Tsai and K. D. Jordan, J. Phys. Chem. 97, 11227 (1993).
- (6) F. H. Stillinger, Phys. Rev. E 59, 48 (1999).
- (7) J. P. K. Doye, M. A. Miller, and D. J. Wales, J. Chem. Phys. 111, 8417 (1999).
- (8) J. P. K. Doye, in Global Optimization—Selected Case Studies, edited by J. D. Pinter (Kluwer Academic, Dordrecht, 2001).
- (9) R. H. Leary, J. Global Optim. 18, 367 (2000).
- (10) D. M. Deaven, N. Tit, J. R. Morris, and K. M. Ho, Chem. Phys. Lett. 256, 195 (1996).
- (11) D. J. Wales and J. P. K. Doye, J. Phys. Chem. A 101, 5111 (1997).
- (12) An up-to-date list of the Lennard-Jones global minima, along with points files of each global minimum, is maintained at the The Cambridge Cluster Database, URL http://www-wales.ch.cam.ac.uk/CCD.html.
- (13) R. H. Leary and J. P. K. Doye, Phys. Rev. E 60, R6320 (1999).
- (14) D. Romero, C. Barrón, and S. Gómez, Comp. Phys. Comm. 123, 87 (1999).
- (15) B. Hartke, in Global Optimization—Selected Case Studies, edited by J. D. Pinter (Kluwer Academic, Dordrecht, 2001).
- (16) Y. J. Twu, C. W. S. Conover, Y. A. Yang, and L. A. Bloomfield, Phys. Rev. B 42, 5306 (1990).
- (17) T. P. Martin, T. Bergmann, H. Göhlich, and T. Lange, Chem. Phys. Lett. 172, 209 (1990).
- (18) H. Hubert et al., Nature 391, 376 (1998).
- (19) J. Xie, J. A. Northby, D. L. Freeman, and J. D. Doll, J. Chem. Phys. 91, 612 (1989).
- (20) B. W. van de Waal, J. Chem. Phys. 90, 3407 (1989).
- (21) B. Raoult, J. Farges, M.-F. de Feraudy, and G. Torchet, Philos. Mag. B 60, 881 (1989).
- (22) L. Marville and L. Andreoni, J. Phys. Chem. 91, 2645 (1987).
- (23) C. L. Cleveland and U. Landman, J. Chem. Phys. 94, 7376 (1991).
- (24) Q. Wang, M. D. Glossman, M. P. Iniguez, and J. A. Alonso, Philos. Mag. B 69, 1045 (1994).
- (25) H. S. Lim, C. K. Ong, and F. Ercolessi, Surf. Sci. 269/270, 1109 (1992).
- (26) N. A. Besley, R. L. Johnston, A. J. Stace, and J. Uppenbrink, J. Mol. Struc.-Theochem 341, 75 (1995).
- (27) C. L. Cleveland et al., Phys. Rev. Lett. 79, 1873 (1997).
- (28) J. E. Hearn and R. L. Johnston, J. Chem. Phys. 107, 4674 (1997).
- (29) C. Barreteau, M. C. Desjonquères, and D. Spanjaard, Eur. Phys. J. D 11, 395 (2000).
- (30) G. W. Turner, R. L. Johnston, and N. T. Wilson, J. Chem. Phys. 112, 4773 (2000).
- (31) F. Calvo, G. Torchet, and M.-F. de Feraudy, J. Chem. Phys. 111, 4650 (1999).
- (32) J.-B. Maillet, A. Boutin, and A. H. Fuchs, J. Chem. Phys. 111, 2095 (1999).
- (33) A. Boutin, B. Rousseau, and A. H. Fuchs, Chem. Phys. Lett. 218, 122 (1994).
- (34) L. D. Marks, Philos. Mag. A 49, 81 (1984).
- (35) J. Farges, M.-F. de Feraudy, B. Raoult, and G. Torchet, Adv. Chem. Phys. 70, 45 (1988).
- (36) S. Kakar et al., Phys. Rev. Lett. 78, 1675 (1997).
- (37) G. Torchet, M.-F. de Feraudy, A. Boutin, and A. H. Fuchs, J. Chem. Phys. 105, 3671 (1996).
- (38) D. Reinhard, B. D. Hall, S. Valkealahti, and R. Monot, Phys. Rev. Lett. 79, 1459 (1997).
- (39) J. P. K. Doye, M. A. Miller, and D. J. Wales, J. Chem. Phys. 110, 6896 (1999).
- (40) J. P. K. Doye and D. J. Wales, Phys. Rev. Lett. 80, 1357 (1998).
- (41) J. P. K. Doye, D. J. Wales, and M. A. Miller, J. Chem. Phys. 109, 8143 (1998).
- (42) C. L. Cleveland, W. D. Luedtke, and U. Landman, Phys. Rev. Lett. 81, 2036 (1998).
- (43) C. L. Cleveland, W. D. Luedtke, and U. Landman, Phys. Rev. B 60, 5065 (1999).
- (44) J. P. K. Doye, D. J. Wales, and R. S. Berry, J. Chem. Phys. 103, 4234 (1995).
- (45) R. S. Berry and B. M. Smirnov, J. Chem. Phys. 113, 728 (2000).
- (46) F. Calvo, J. P. K. Doye, and D. J. Wales, Phys. Rev. Lett. 87, 119301 (2001).
- (47) J. P. K. Doye, D. J. Wales, W. Branz, and F. Calvo, Phys. Rev. B 64, 235409 (2001).
- (48) G. Torchet, M.-F. de Feraudy, and B. Raoult, J. Chem. Phys. 103, 3074 (1995).
- (49) P. M. Ajayan and L. D. Marks, Phys. Rev. Lett. 60, 585 (1988).
- (50) J. P. K. Doye and F. Calvo, Phys. Rev. Lett. 86, 3570 (2001).
- (51) J. E. Jones and A. E. Ingham, Proc. R. Soc. A 107, 636 (1925).
- (52) A. L. Mackay, Acta Cryst. 15, 916 (1962).
- (53) S. Gomez and D. Romero, Proceedings of the First European Congress of Mathematics (Birkhauser, Basel, 1994), Vol. III, pp. 503–509.
- (54) J. Pillardy and L. Piela, J. Phys. Chem. 99, 11805 (1995).
- (55) J. P. K. Doye and D. J. Wales, Chem. Phys. Lett. 247, 339 (1995).
- (56) M. A. Miller, J. P. K. Doye, and D. J. Wales, Phys. Rev. E 60, 3701 (1999).
- (57) E. Marinari and G. Parisi, Europhys. Lett. 19, 451 (1992).
- (58) F. Calvo and J. P. K. Doye, Phys. Rev. E 63, 010902(R) (2001).
- (59) J. P. Neirotti, F. Calvo, D. L. Freeman, and J. D. Doll, J. Chem. Phys. 112, 10340 (2000).
- (60) F. Calvo, J. P. Neirotti, D. L. Freeman, and J. D. Doll, J. Chem. Phys. 112, 10350 (2000).
- (61) D. J. Wales, Mol. Phys. 78, 151 (1993).
- (62) G. Franke, E. R. Hilf, and P. Borrmann, J. Chem. Phys. 98, 3496 (1993).
- (63) J. P. K. Doye and D. J. Wales, J. Chem. Phys. 102, 9659 (1995).
- (64) D. J. Wales et al., Adv. Chem. Phys. 115, 1 (2000).
- (65) M. A. Miller, J. P. K. Doye, and D. J. Wales, J. Chem. Phys. 110, 328 (1999).
- (66) D. J. Wales, M. A. Miller, and T. R. Walsh, Nature 394, 758 (1998).
- (67) F. Calvo, J. P. K. Doye, and D. J. Wales, J. Chem. Phys. 114, 7312 (2001).
- (68) F. Calvo, J. P. K. Doye, and D. J. Wales, J. Chem. Phys. 115, 9627 (2001).
- (69) D. D. Frantz, J. Chem. Phys. 115, 6136 (2001).
- (70) D. D. Frantz, J. Chem. Phys. 102, 3747 (1995).
- (71) It is also apparent from Figure 3 that jumps in occur at those sizes where the structure of the incomplete surface layer of the icosahedra changes from anti-Mackay to Mackay at =31 and =82-86. The consequent large differences in vibrational entropy driven surface transitionsCalvo01a ; Frantz01 as will be explored elsewhere (J. P. K. Doye and F. Calvo, in preparation).
- (72) J. S. van Duijneveldt and D. Frenkel, J. Chem. Phys. 96, 4655 (1992).
- (73) R. M. Lynden-Bell, Mol. Phys. 86, 1353 (1995).
- (74) R. E. Kunz and R. S. Berry, Phys. Rev. Lett. 71, 3987 (1993).
- (75) R. E. Kunz and R. S. Berry, Phys. Rev. E 49, 1895 (1994).
- (76) J. P. K. Doye and D. J. Wales, Z. Phys. D 40, 466 (1997).
- (77) J. P. Wittmer, A. Tanguy, J. Barrat, and L. Lewis, Europhys. Lett. in press (cond-mat/0104509).
- (78) M. A. van der Hoef, J. Chem. Phys. 113, 8142 (2000).
- (79) S. Hendy and B. D. Hall, Phys. Rev. B 64, 085425 (2001).
- (80) P. Labastie and R. L. Whetten, Phys. Rev. Lett. 65, 1567 (1990).
- (81) M. Schmidt et al., Phys. Rev. Lett. 86, 1191 (2001).
- (82) R. S. Berry, T. L. Beck, H. L. Davis, and J. Jellinek, Adv. Chem. Phys. 70, 75 (1988).
- (83) J. P. Neirotti, D. L. Freeman, and J. D. Doll, J. Chem. Phys. 112, 3990 (2000).
- (84) W. Branz, N. Malinowski, H. Schaber, and T. P. Martin, Chem. Phys. Lett. 328, 245 (2000).
- (85) G. M. Wang, E. Blaisten-Barojas, A. E. Roitberg, and T. P. Martin, J. Chem. Phys. 115, 3640 (2001).
- (86) A. P. Sutton and J. Chen, Phil. Mag. Lett. 61, 139 (1990).
- (87) J. Jortner, Z. Phys. D 24, 247 (1992).
- (88) L. D. Marks, Rep. Prog. Phys. 57, 603 (1994).
- (89) D. Zanchet, B. D. Hall, and D. Ugarte, J. Phys. Chem. B 104, 11013 (2000).
- (90) B. D. Hall, M. Flüeli, R. Monot, and J.-P. Borel, Phys. Rev. B 43, 3906 (1991).
- (91) D. Reinhard, B. D. Hall, D. Ugarte, and R. Monot, Phys. Rev. B 55, 7868 (1997).
- (92) R. P. Andres et al., Science 273, 1690 (1996).
- (93) F. Baletto, J. P. K. Doye, and R. Ferrando, Phys. Rev. Lett. submitted .
- (94) J. P. K. Doye and D. J. Wales, J. Chem. Phys. 111, 11070 (1999).
- (95) J. P. K. Doye, D. J. Wales, and S. I. Simdyankin, Faraday Discuss. 118, 159 (2001).
- (96) F. Baletto, C. Mottet, and R. Ferrando, Phys. Rev. Lett. 84, 5544 (2000).
- (97) F. Baletto, C. Mottet, and R. Ferrando, Phys. Rev. B 63, 155408 (2001).
- (98) Y. Chusak and L. S. Bartell, Eur. Phys. J. D 16, 43 (2001).
- (99) J. P. K. Doye, Phys. Rev. E 62, 8753 (2000).
- (100) I. A. Harris, K. A. Norman, R. V. Mulkern, and J. A. Northby, Chem. Phys. Lett. 130, 316 (1986).
- (101) O. Echt, K. Sattler, and E. Recknagel, Phys. Rev. Lett. 47, 1121 (1981).
- (102) W. Miehle, O. Kandler, T. Leisner, and O. Echt, J. Chem. Phys. 91, 5940 (1989).
- (103) T. D. Märk and P. Scheier, Chem. Phys. Lett. 137, 245 (1987).
- (104) F. Y. Naumkin and D. J. Wales, Mol. Phys. 93, 633 (1998).
- (105) J. Farges, M.-F. de Feraudy, B. Raoult, and G. Torchet, J. Chem. Phys. 78, 506 (1983).
- (106) J. Farges, M.-F. de Feraudy, B. Raoult, and G. Torchet, J. Chem. Phys. 84, 3491 (1986).
- (107) B. W. van de Waal, Phys. Rev. Lett. 67, 3263 (1991).
- (108) B. W. van de Waal, J. Chem. Phys. 98, 4909 (1993).
- (109) B. W. van de Waal, Phys. Rev. Lett. 76, 1083 (1996).
- (110) B. W. van de Waal, J. Cryst. Growth 158, 153 (1996).
- (111) B. W. van de Waal, G. Torchet, and M.-F. de Feraudy, Chem. Phys. Lett. 331, 57 (2000).
- (112) T. Ikeshoji, G. Torchet, M.-F. de Feraudy, and K. Koga, Phys. Rev. E 63, 031101 (2001).
- (113) M. Dove, Introduction to Lattice Dynamics (Cambridge University Press, Cambridge, 1993).
- (114) G. C. Maitland, M. Rigby, E. B. Smith, and W. A. Wakeham, Intermolecular Forces (Clarendon Press, Oxford, 1981).
- (115) V. Ozoliņs̆ and M. Asta, Phys. Rev. Lett. 86, 448 (2001).
- (116) M. Asta and V. Ozoliņs̆, Phys. Rev. B 64, 094104 (2001).
- (117) A. van de Walle and G. Ceder, Rev Mod. Phys. (cond-mat/0106490).
- (118) S. Sastry, Nature 409, 164 (2001).
- (119) D. J. Wales and J. P. K. Doye, Phys. Rev. B 63, 214204 (2001).