Evidence for short range orbital order in paramagnetic insulating (Al,V)2O3
Abstract
The local structure of (Al0.06V0.94)2O3 in the paramagnetic insulating (PI) and antiferromagnetically ordered insulating (AFI) phase has been investigated using hard and soft x-ray absorption techniques. It is shown that: 1) on a local scale, the symmetry of the vanadium sites in both the PI and the AFI phase is the same; and 2) the vanadium - oxygen hybridization, as gauged by the oxygen absorption edge, is the same for both phases, but distinctly different from the paramagnetic metallic phase of pure V2O3. These findings can be understood in the context of a recently proposed model which relates the long range monoclinic distortion of the antiferromagnetically ordered state to orbital ordering, if orbital short range order in the PI phase is assumed. The measured anisotropy of the x-ray absorption spectra is discussed in relation to spin-polarized density functional calculations.
pacs:
61.10Ht, 71.30.+h, 71.27.+a, 78.70.DmIntroduction
The metal-insulator transition (MIT) in V2O3 has been intensively investigated and discussed for many years as an example of a classical Mott transition. However, such a picture is blurred by the complexity of the V2O3 phase diagram McWhan et al. (1973) which involves magnetic and structural transitions coinciding with the MIT, as a function of temperature, doping (Cr, Al, Ti), pressure, and oxygen stoichiometry. At room temperature pure V2O3 is in a paramagnetic metallic (PM) phase which x-ray diffraction (XRD) shows to be trigonal. At about 180 K there occurs a transition to an antiferromagnetically insulating (AFI) monoclinic phase. Doping with Cr or Al results in the formation of a paramagnetic insulating (PI) phase. The lattice parameters change but long-range trigonal symmetry is preserved, as indicated by XRD.McWhan et al. (1969); Spalek (1990) The role of electronic correlations in the interplay between changes in the physical structure, the magnetic properties, and the electronic structure at the various transitions needs further investigation. It is still not certain whether the electronic transition is driven by structural changes or vice-versa. Although recent LDA + DMFT calculationsHeld et al. (2001) show the importance of electronic correlations in a description of the electronic structure, a description of the MIT in V2O3 must take into account the relationship between physical structure and the electronic and magnetic properties of the system.
The Mott-Hubbard picture of V2O3, in particular a description in terms of a one band Hubbard model,Rozenberg et al. (1995) is based on a level scheme of Castellani et al. for the electronic structure of V2O3.Castellani et al. The crystal field generated by the O octahedron splits the V states into upper eg and lower states, and the latter are further split into and states due to the trigonal symmetry of the lattice. Interactions between nearest vanadium neighbors along the -direction (vertical pairs) splits the states into bonding and antibonding molecular orbitals. According to Castellani et al. the bonding orbital is fully occupied while the antibonding orbital shifts energetically above the states. This leaves only one electron per vanadium atom to occupy the states, leading to orbital degeneracy, which is susceptible to a degeneracy-lifting process such as the Jahn-Teller effect or orbital ordering. Indeed, Bao et al.Bao et al. (1998, 1997) suggested that such orbital ordering occurs in V2O3. This conclusion was based on neutron scattering experiments which show disagreement between the propagation vector characterizing the AFI phase and the propagation vector expected from magnetic short range order in the PM and PI phases of pure V2O3 and its alloys. The latter propagation vector is identical to that of a spin density wave in vanadium-deficient V2O3. The suggested orbital ordering would distinguish the AFI phase of V2O3 from all the other phases and prevent a unified description of the MIT in this compound. The validity of Castellani’s model has been called into question by soft x-ray absorptionMüller et al. (1997); Park et al. (2000)and band structure calculations.Ezhov et al. (1999)Near-edge x-ray absorption fine structure (NEXAFS) measurements of the V and O edges provides information on the unoccupied states near the Fermi level. Müller et al. concluded from such a NEXAFS study of the different phases of V2O3 and (V,Cr)2O3 that all the insulating phases have, within experimental error, identical local electronic structures.Müller et al. (1997) In addition, angular resolved NEXAFS measurements in the metallic and insulating phase of V2O3 are inconsistent with the assumption that the first excited states are purely . Rather, the isotropy of the absorption spectra observed in the metallic phase suggests the first excited states are a mixture of and , while the anisotropy observed in the insulating phases suggests these states have increased character. These conclusions were confirmed by LDA+U band structure calculations by Ezhov et al.Ezhov et al. (1999) and NEXAFS studies by Park et al.Park et al. (2000) Using a model fit to the V , Ezhov et al. showed that orbital occupancy of the states is larger than one and changes at both MIT’s. This renders the one band Hubbard modelRozenberg et al. (1995) often applied to the MIT in V2O3 inadequate.
Important for a unified view of the MIT in V2O3 is the understanding of the relationship between electronic, magnetic, and structural changes at the MIT. Recently, a model was proposedShiina et al. (2001); Mila et al. (2000) that takes into account degrees of freedom of molecular orbitals formed by vertical V-V pairs and their interaction within the -plane, offering a consistent picture of the magnetic and structural properties of the AFI phase.
In this paper we show using EXAFS and NEXAFS techniques that, on a local scale, the structural and electronic properties of the AFI and PI phase are the same. This fact is attributed to short range orbital order in the PI phase, consistent with recent model calculationsShiina et al. (2001); Mila et al. (2000) and the characteristics of magnetic short range order observed by neutron scattering.Bao et al. (1998) Spin polarized density functional theory calculations presented here reflect the anisotropy of the O density of states observed in the insulating phases of the V2O3 phase diagram.
Experimental and Theoretical Methodology
Measurements were performed on an Al-doped V2O3 single crystal about 2.5 mm by 1.5 mm by 1 mm grown by chemical transport using TeCl4 as transport agent and a mixture of V2O3 and Al2O3 powder corresponding to a nominal concentration x = 0.1 in (V1-xAlx)2O3. Energy dispersive x-ray scattering showed the actual Al concentration in the single crystal was 6 atomic percent, presumably due to lower transport rate of Al compared to vanadium during crystal growth. XRD showed the expected trigonal structure with lattice parameters Å and Å, both smaller than those found by Joshi et al. ( Å and Å at 6.2 at%).Joshi et al. (1977) The resulting ratio of 2.7703 is much smaller than in the metallic phase (2.828). Resistivity measurements, the small value of the ratio, and the Al concentration show the sample was in the PI phase at room temperature. The transition from PI to AFI occurred at 165 K as determined by magnetic susceptibiblity measurements using a Quantum Devices SQUID magnetometer. Laue diffraction measurements were performed on the single crystal at room temperature and at 77 K. The room temperature trigonal symmetry was, as expected, broken at low temperature.
The EXAFS measurements were performed at beam line X23B at the National Synchrotron Light Source at Brookhaven National Laboratory. Spectra at different temperature points above and below the transition temperatures of the pure and doped sample were taken using a closed cycle helium cryostat. The sample was held under vacuum to reduce thermal leakage and air-absorption and prevent water condensation. The x-ray absorption spectra were measured in fluorescence yield mode using a Lytle detector;Lytle et al. (1984) background radiation was filtered by a Ti foil. In fluorescence mode self-absorption effects may strongly damp the EXAFS amplitude even at normal incidence. As the primary effect of self-absorption is to reduce the EXAFS amplitude,Tröger et al. (1992); Pfalzer et al. (1999) but leave the phase unchanged, the distances of neighboring atoms obtained by EXAFS, which are determined largely by the phase, are unaffected. We corrected for self-absorption using a generalization of the method of Tröger et al.Tröger et al. (1992); Goulon et al. (1982) to large detector surfaces, as described elsewhere.Pfalzer et al. (1999) This correction is quite reliable, as was shown in Ref. Pfalzer et al., 1999 by demonstrating that for Al-doped V2O3 the absorption was isotropic in the plane after the correction, as expected for trigonal symmetry.
For the EXAFS measurements the sample was oriented so that the plane (in hexagonal notation) was the surface perpendicular to the incident beam. In this geometry the orientation of the polarization vector of the incoming x-rays with respect to the hexagonal axis can be changed by rotating the sample around the surface normal. Measurements were made with parallel and perpendicular to . As described by Frenkel et al.,Frenkel et al. (1997) this facilitates measuring the two different components of the anisotropic absorption coefficient:
where () is the absorption coefficient for perpendicular (parallel) to and is the angle between and . Since different scattering paths contribute to and , measurement of these two independent quantities achieves better separation of paths. After correcting for self-absorption as described above standard EXAFS analysis was performed. For the Fourier transform a window in space from 3 Å-1 to 12 Å-1 was used ( being the wavevector of the photoelectron).
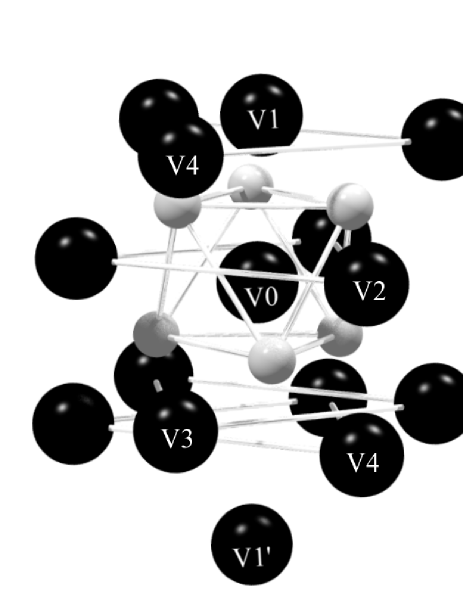
Measured spectra were compared to model spectra calculated with FEFF8.Ankudinov et al. (1998) The calculation requires estimated atomic positions, provided by models of the structure. To construct these structural models we used the lattice parameters provided by our XRD measurements. Then, for the trigonal model, we used the atomic positions tabulated by WyckoffWyckoff (1963) for the pure compound. For the monoclinic model, we started with the measured hexagonal lattice parameters and tilted the -axis by 1.995∘, the same amount as in the AFI phase of undoped V2O3,Urbach (1995) to reproduce the monoclinic distortion. The resulting pseudo-hexagonal lattice vectors were converted to monoclinic ones using the conversion matrix of Ref. Dernier and Marezio, 1970. Relative atomic positions for the monoclinic phase were also taken from Ref. Dernier and Marezio, 1970. The structure refinement was performed by varying the interatomic distances to all vanadium atoms up to the fourth nearest neighbor, as shown in Fig. 1, as well as to the nearest two shells of oxygen atoms. A few double scattering paths with high scattering amplitudes were included in the fits. The nearest oxygen shell forms a (distorted) octahedron around the absorbing vanadium atom V0 and is responsible for the well-separated peak of the Fourier transformed spectra between 1 and 2 Å. Fitting was carried out in space using weighting.

NEXAFS measurements on the O edge were performed under ultra high vacuum at the U41-1/PGM beamline at the BESSY 2 storage ring using the same crystal in the same geometry as for the EXAFS measurements. The signal was monitored by measuring the total electron yield; this is somewhat surface-sensitive, so care was taken to prepare and maintain clean surfaces characteristic of the bulk.
The experiments were complemented by electronic structure calculations based on density functional theory (DFT) in the local density approximation (LDA). The calculations used the augmented spherical wave (ASW) method in its scalar-relativistic implementation,Williams et al. (1979); Eyert (2000) which was already applied in Ref. Held et al., 2001. The present study included the paramagnetic metallic V2O3, paramagnetic insulating (V0.962Cr0.038)2O3, and antiferromagnetic insulating V2O3 phase using the crystal structure data of Dernier Dernier (1970); rem as well as Dernier and Marezio.Dernier and Marezio (1970) Note that, since DFT is a ground state theory, differences between the phases were taken into account only via the different crystal structure. In order to study the effect of spin-polarization separately from the monoclinic distortion in the AFI state, a complementary set of calculations with enforced spin-degeneracy was performed for this structure.
In order to account for the openness of the crystal structures, empty spheres, i.e. pseudo atoms without a nucleus, were included to model the correct shape of the crystal potential in large voids. Optimal empty sphere positions and radii of all spheres were automatically determined by the recently developed sphere geometry (SGO) algorithm.Eyert and Höck (1998) As a result, 8 and 16 empty spheres with radii ranging from 1.78 to 2.42 were included in the trigonal and monoclinic cell, respectively, keeping the linear overlap of vanadium and oxygen spheres below 16.5%. The basis set comprised V , , and O , as well as empty sphere states. Fast self-consistency was achieved by an efficient algorithm for convergence acceleration.Eyert (1996) Brillouin zone sampling was done using an increasing number of points ranging from 28 to 2480 and 108 to 2048 points within the respective irreducible wedges, ensuring convergence of the results with respect to the fineness of the -space grid.
Results
In Fig. 2 we compare the EXAFS (in space) of a pure V2O3 sample and the Al-doped sample above (dashed lines) and below (solid lines) their respective transition temperatures. For the Al-doped sample EXAFS spectra were measured with the polarization vector oriented along and perpendicular to the hexagonal -axis. The EXAFS is very similar for both orientations for both the PI and the AFI phase of this sample [see Fig. 2(a) and 2(b)], indicating that this transition, involving a long range monoclinic distortion and magnetic order, is accompanied by only minor changes in local structure. In contrast, for pure V2O3, the large differences in the EXAFS oscillations apparent in Fig. 2(c) show that the local environment of the absorbing atoms is very different above and below the MIT. For the PI and AFI phases of the Al-doped sample, small differences are apparent at high ; these presumably are due to the distinctly different Debye-Waller factors at the measuring temperatures of 30 K and 180 K, respectively.

Fitting procedures, further discussed below, provide local interatomic distances which confirm that the local structure is virtually the same in the PI and AFI phase of the Al-doped sample, but also in the AFI phase of pure V2O3. The fit also shows that both the PI and AFI phases of the Al-doped V2O3 have a local symmetry which corresponds to a monoclinic lattice. Fig. 3 compares the measured EXAFS (in space, where is the interatomic distance) for both orientations of to to spectra derived from model calculations for monoclinic and trigonal structures. It is evident that the monoclinic model fits the data better. The trigonal model (long dashes) fits the data very poorly in the PI phase at 180 K as well as in the AFI phase at 30 K, while the monoclinic model (dotted lines) fits the data very well in both cases, especially doing a much better job in describing the distorted oxygen octahedron (peak at 1.7 Å) and the next vanadium neighbors (V1 and V contributions are around 2.2 Å and below 4 Å in Fig. 3). This visual observation is confirmed by the fact that the reduced chi-squared of the trigonal model is 38.1, while that of the monoclinic model is 10.7. The better fit of the monoclinic model than the trigonal model is particularly apparent in the parallel to orientation. This is expected because the EXAFS measured in this orientation is more sensitive to the structural differences between the phases; the major effect of the reduction in symmetry during the transition from PI or PM to AFI is a tilt of the axis and a “rotation” of V0-V1 next neighbor pairs all located along this axis. This orientation also achieves good separation of scattering paths, since there is only a single V next neighbor atom (V1 in Fig. 1) along the axis. In fact, the main contribution to the scattered intensity at 2.2 Å in Fig. 3(a) is due to the V0-V1 single scattering path. The broad peaks in the spectra taken with the polarization vector of the x-rays perpendicular to the axis [Fig. 3(b)] contain a large number of paths and therefore fit equally well to both models.
| (Al0.06V0.94)2O3 | V2O3+Cr | V2O3 | |||||
| Ion | measured | ||||||
| (see Fig. 1) | calculated | by EXAFS | |||||
| trig. | mon. | PI | AFI | PI | AFI | ||
| V1 | 2.72 | 2.72 | 2.76 | 2.79 | 2.75 | 2.74 | |
| i | 2.86 | 2.96 | 2.91 | 2.86 | |||
| V2 | ii | 2.91 | 2.87 | 2.97 | 2.93 | 2.92 | 2.88 |
| iii | 3.00 | 3.10 | 3.05 | 2.99 | |||
| i | 3.43 | 3.44 | 3.42 | 3.44 | |||
| V3 | ii | 3.44 | 3.45 | 3.46 | 3.44 | 3.45 | 3.46 |
| i | 3.62 | 3.69 | 3.72 | 3.63 | |||
| V4 | ii | 3.69 | 3.71 | 3.78 | 3.81 | 3.70 | 3.73 |
| iii | 3.72 | 3.79 | 3.82 | 3.74 | |||
Table 1 lists the distances from a central reference ion, labeled V0 in Fig. 1, to nearby V ions for the various phases of the V2O3 compounds. The values measured by EXAFS for the PI and AFI phases are those obtained using the fits shown in Fig. 3. For comparison, we include interatomic distances calculated for (Al0.06,V0.94)2O3 obtained using hexagonal lattice vectors measured by XRD and relative atomic positions, assuming a trigonalDernier (1970) and monoclinic lattice.Dernier and Marezio (1970) Distances for (Cr0.038V0.962)2O3 in the PI phase were measured by DernierDernier (1970) using XRD and those for the AFI phase of pure V2O3 are calculated from the monoclinic lattice vectors and atomic positions published by Dernier and Marezio.Dernier and Marezio (1970) Uncertainties are typically 0.02 Å. It is evident that the interatomic distances measured by EXAFS for the PI and AFI phases (Al0.06V0.94)2O3 are essentially the same. In addition, these distances are in correspondence with, though consistently slightly larger than, those obtained for the AFI phase of pure V2O3, confirming that all insulating phases have essentially the same local structure.
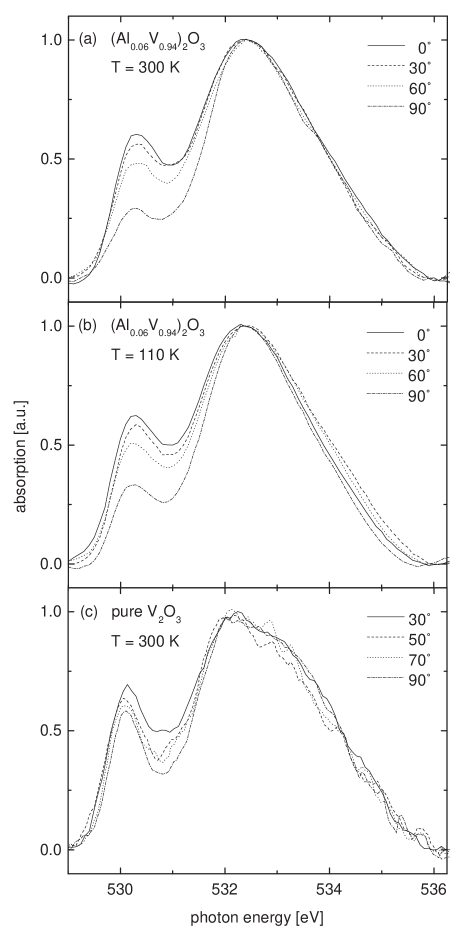
NEXAFS spectra of the O edge in the same Al-doped Al2O3 crystal are presented in Fig. 4 (a) and (b). Large changes in the spectra are apparent as the sample is rotated from a geometry with parallel to () to one with perpendicular to (). It is evident that cooling from the PI to the AFI phase has no significant effect on the spectra or their dependence on angle. These spectra and their angular dependence are similar to those of pure V2O3 in its low temperature AFI phase,Müller et al. (1997) but different from those of pure V2O3 in its high temperature PM phase, which has a much weaker angular dependence [Fig. 4(c)].
Discussion
The EXAFS and O edge soft x-ray absorption measurements presented here consistently show that the structure, at least on a local scale, and the V-O hybridization in the PI and AFI phase of (Al,V)2O3 are similar, but distinctly different from the metallic phase. The most obvious difference between the metallic and insulating phases is the anisotropy of the O x-ray absorption spectra, reflecting the V - O hybridization. These findings suggest that the structural change at the MI transition (long or short range order) is directly connected with the emergence of the insulating state, e.g. via changes of hybridization.
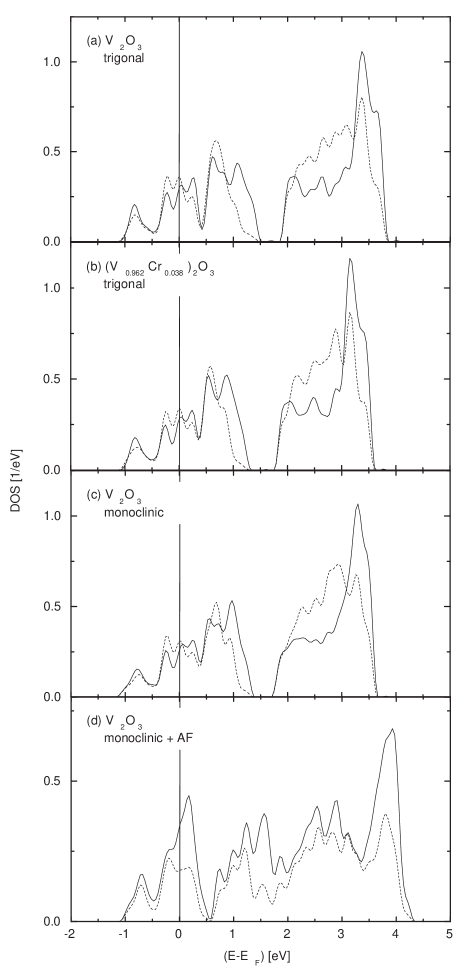
To estimate the effect of purely structural changes on the hybridization, we show in Fig. 5 partial (projected) O and densities of states (DOS) predicted by the electronic structure calculations. The V partial DOS predictions for the spin-degenerate cases (see Ref. Held et al., 2001) are in good agreement with those of MattheissMattheiss (1994) and Ezhov et al.Ezhov et al. (1999) The V and O partial DOS presented in Fig. 5 are very similar for all phases, except for a slight decrease of the O band width in the PI phase as compared to the PM phase. In particular, the experimentally observed optical band gap is not reproduced by the calculations and all phases are predicted to be metallic. These discrepancies between experiment and calculations are usually attributed to the fact that on-site electron-electron correlations are not fully taken into account by LDA. The calculations also predict that the O DOS of all phases is isotropic, i.e. the projected and DOS are similar, implying that NEXAFS spectra of the O edge with the polarization vector parallel or perpendicular to should also be alike. Experimentally, this is only observed for the metallic phase of V2O3, as shown in Fig. 4(c), but not for the insulating phases. However, the calculations for (V0.962Cr0.038)2O3 [Fig. 5(b)] described above did not include the local distortions observed by EXAFS in the PI phase and the calculations for monoclinic V2O3 [Fig. 5(c)] artificially enforced a spin-degenerate state. If the antiferromagnetic ground state of the monoclinic phase is taken into account by using a spin-polarized calculation [Fig. 5(d)], the partial DOS displays various band shifts, although the experimentally observed optical band gap is still not reproduced. In particular, the O partial DOS now differs substantially from the near 0.3 eV, 1.7 eV, and 4 eV and is, therefore, more compatible with the observed anisotropy of the O spectra. In this context it should be noted that according to neutron scattering measurements antiferromagnetic short range order persists in both the PI and the PM phase, although the anisotropy of the O spectra is only observed in the PI and AFI phases.
To address the effect of electronic correlations on the electronic structure of V2O3, recently LDA was combined with dynamical mean field theory (DMFT) and calculated and measured photoemission and x-ray absorption spectra were compared on the basis of the calculated V spectral weight.Held et al. (2001) The electron-electron interaction shifts the and states with respect to each other. This would cause an anisotropy in the oxygen spectra, since the and states hybridize differently with the O and states. According to LDA the V hybridize primarily with the O orbital along the axis, while the hybridize primarily with the O in plane orbitals. Therefore polarization-dependent excitations of O core electrons into unoccupied O and O states provide information on their hybridization with V and states respectively. Based on this we concluded earlierMüller et al. (1997)that the observed anisotropy in the AFI phase of pure V2O3 results from an increase in character in the unoccupied DOS, causing a corresponding increase of weight of O hybridized states above . This interpretation is consistent with the conclusion of Park,Park et al. (2000) based on measurements of the V edges, that there is an increase in occupancy during the transition from the metallic to the insulating state in V2O3. On the other hand, the relative shifts of the and states predicted from LDA + DMFT calculations are not sufficient to account for the observed anisotropy of the O spectra in the insulating state.
Recently ShiinaShiina et al. (2001) attributed the monoclinic lattice distortion in
the AFI phase to orbital ordering which would make the three originally
equivalent magnetic bonds in the -plane inequivalent and cause a
monoclinic lattice distortion. Evidence for orbital fluctuations in the PI
phase was provided by neutron scattering measurements,Bao et al. (1998) which
showed that magnetic short range order was limited to nearest neighbor
distances, resulting in a first order transition from the PI to the AFI phase.
Given the results of Ref. Shiina et al., 2001, orbital fluctuations in the
PI phase could cause a dynamic monoclinic distortion. Assuming the time scale
for such fluctuations is long compared to the time scale of the x-ray
absorption process, EXAFS and soft x-ray absorption would measure an
instantaneous structure and the PI phase would appear monoclinic, while XRD,
which measures on a much longer time scale, would see a trigonal lattice. In
the AFI phase the monoclinic distortion might become static although, on a
local scale, still the same as in the PI phase. This model would account for
the fact that neither EXAFS nor soft x-ray absorption observe differences
between the PI and the AFI phase, in contrast to XRD. The spectroscopic
results are, however, also consistent with static short range orbital order in
the PI phase, which would, accordingly, be an orbital glass, with an
disorder-order transition to the ordered AFI phase.
The local monoclinic distortion we have found in
(V0.94Al)2O3 is reminiscent of the much smaller, but
significant monoclinic distortion found in the metallic phase of pure
V2O3.Frenkel et al. (1997) From the fact that this monoclinic distortion is
not detected in XRD measurements, Frenkel et al.Frenkel et al. (1997) set
an upper limit of 40 Å on the size of possible monoclinic domains and
concluded that the MIT contains both an order-disorder and a displacive
component. The monoclinic distortion in the metallic phase was determined to
be about 30% of that in the antiferromagnetically ordered insulating phase.
From the above discussion it can be concluded that their data suggest orbital
fluctuations are also present in the metallic phase of V2O3, although
local distortions are less prominent than in the PI phase, possibly due to
better screening in the metallic phase.
Conclusion
The x-ray absorption measurements presented here show that both the PI and AFI insulating phases of V2O3 are distinguished from the PM phase by: (i) the presence of local or long range distortion of the lattice (probably connected to short or long range orbital order, respectively) and (ii) differences in the V - O hybridization, accompanied by corresponding band shifts. Both the distortion and the hybridization appear to be independent of the presence of antiferromagnetic correlations, which are present in all phases.Bao et al. (1998) The similarity of the PI and the AFI phases, at least on a local scale, suggests a common route from their insulating behavior to the metallic behavior of the PM phase. Interactions between orbital degrees of freedom, which lead to an orbitally ordered state in the AFI phase and orbital short range order in the PI phase, appear to be an an important fingerprint of the MIT. The characteristic differences between V - O hybridization in the metallic and the insulating phases suggest that those changes in hybridization play a role in the MIT. Such changes might be due to strong anharmonic contributions to the temperature-dependent phonon spectrum.
Acknowledgements.
We appreciate valuable assistance in the measurements and analysis from J. Kirkland at NSLS and Ch. Jung and M. Mast at BESSY and enlightening discussions with P. Riseborough and K.-H. Höck. This work was supported in part by the BMBF under contract number 0560GWAA and the DFG under contract number HO-955/2 and SFB484 and by the US DOE Contract DEFG02-91-ER45439. The NSLS is supported by the DOE.References
- McWhan et al. (1973) D. B. McWhan, A. Menth, J. P. Rameika, W. F. Brinkmann, and T. Rice, Phys. Rev. B 7, 1920 (1973).
- McWhan et al. (1969) D. B. McWhan, J. P. Rameika, and T. M. Rice, Phys. Rev. Lett. 23, 1384 (1969).
- Spalek (1990) J. Spalek, J. Solid State Chem. 88, 70 (1990).
- Held et al. (2001) K. Held, G. Keller, V. Eyert, D. Vollhardt, and V. I. Anisimov, Phys. Rev. Lett. 86, 5345 (2001).
- Rozenberg et al. (1995) M. J. Rozenberg, G. Kotliar, H. Kajueter, G. A. Thomas, D. H. Rapkine, J. M. Honig, and P. Metcalf, Phys. Rev. Lett. 75, 105 (1995).
- (6) C. Castellani, C. R. Natoli, and J. Ranninger, Phys. Rev. B 18, 4945 (1978); 18, 4967 (1978); 18, 5001 (1978).
- Bao et al. (1998) W. Bao, C. Broholm, G. Aeppli, S. A. Carter, P. Dai, T. F. Rosenbaum, J. M. Honig, P. Metcalf, and S. F. Trevino, Phys. Rev. B 58, 12727 (1998).
- Bao et al. (1997) W. Bao, C. Broholm, G. Aeppli, P. Dai, J. M. Honig, and P. Metcalf, Phys. Rev. Lett. 78, 507 (1997).
- Müller et al. (1997) O. Müller, J. P. Urbach, E. Goering, T. Weber, R. Barth, H. Schuler, M. Klemm, S. Horn, and M. L. denBoer, Phys. Rev. B 56, 15056 (1997).
- Park et al. (2000) J.-H. Park, L. H. Tjeng, A. Tanaka, C. T. Chen, P. Metcalf, J. M. Honig, F. M. F. de Groot, and G. A. Sawatzky, Phys. Rev. B 61, 11506 (2000).
- Ezhov et al. (1999) S. Y. Ezhov, V. I. Anisimov, D. I. Khomskii, and G. A. Sawatzky, Phys. Rev. Lett. 83, 4136 (1999).
- Shiina et al. (2001) R. Shiina, F. Mila, F.-C. Zhang, and T. M. Rice, Phys. Rev. B 63, 144422 (2001).
- Mila et al. (2000) F. Mila, R. Shiina, F.-C. Zhang, A. Joshi, M. Ma, V. I. Anisimov, and T. M. Rice, Phys. Rev. Lett. 85, 1714 (2000).
- Joshi et al. (1977) G. M. Joshi, H. V. Keer, H. Kuwamoto, and J. M. Honig, Indian Journal of Pure and Applied Physics 15, 471 (1977).
- Lytle et al. (1984) F. W. Lytle, R. B. Greegor, D. R. Sandstrom, E. C. Marques, J. Wong, C. L. Spiro, G. P. Huffman, and F. E. Huggins, Nucl. Instr. Methods 226, 542 (1984).
- Tröger et al. (1992) L. Tröger, D. Arvanatis, K. Baberschke, H. Michaelis, U. Grimm, and E. Zschech, Phys. Rev. B 46, 3283 (1992).
- Pfalzer et al. (1999) P. Pfalzer, J.-P. Urbach, M. Klemm, S. Horn, M. L. denBoer, A. I. Frenkel, and J. P. Kirkland, Phys. Rev. B 60, 9335 (1999).
- Goulon et al. (1982) J. Goulon, C. Goulon-Ginet, R. Cortes, and J. M. Dubois, J. Phys. (Paris) 43, 539 (1982).
- Frenkel et al. (1997) A. I. Frenkel, E. A. Stern, and F. A. Chudnovsky, Solid State Commun. 102, 637 (1997).
- Ankudinov et al. (1998) A. L. Ankudinov, B. Ravel, J. J. Rehr, and S. D. Conradson, Phys. Rev. B 58, 7565 (1998).
- Wyckoff (1963) R. W. G. Wyckoff, Crystal structure (Interscience Publishers, 1963).
- Urbach (1995) J.-P. Urbach, Diplomarbeit, Universität Augsburg (1995).
- Dernier and Marezio (1970) P. D. Dernier and M. Marezio, Phys. Rev. B 2, 3771 (1970).
- Williams et al. (1979) A. R. Williams, J. Kübler, and C. D. Gelatt, Jr., Phys. Rev. B 19, 6094 (1979).
- Eyert (2000) V. Eyert, Int. J. Quantum Chem. 77, 1007 (2000).
- Dernier (1970) P. D. Dernier, J. Phys. Chem. Solids 31, 2569 (1970).
- (27) Use of the crystal structure of Cr-doped V2O3 for the paramagnetic insulating phase is justified by the observation that Cr doping has very similar effects as Al doping and is equivalent to the application of (negative) pressure.
- Eyert and Höck (1998) V. Eyert and K.-H. Höck, Phys. Rev. B 57, 12727 (1998).
- Eyert (1996) V. Eyert, J. Comp. Phys. 124, 271 (1996).
- Mattheiss (1994) L. F. Mattheiss, J. Phys.: Cond. Matt. 6, 6477 (1994).