Binding Energy of Charged Excitons in ZnSe-based Quantum Wells
Abstract
Excitons and charged excitons (trions) are investigated in ZnSe-based quantum well structures with (Zn,Be,Mg)Se and (Zn,Mg)(S,Se) barriers by means of magneto-optical spectroscopy. Binding energies of negatively- () and positively () charged excitons are measured as functions of quantum well width, free carrier density and in external magnetic fields up to 47 T. The binding energy of shows a strong increase from 1.4 to 8.9 meV with decreasing quantum well width from 190 to 29 Å. The binding energies of are about 25% smaller than the binding energy in the same structures. The magnetic field behavior of and binding energies differ qualitatively. With growing magnetic field strength, increases its binding energy by 35-150%, while for it decreases by 25%. Zeeman spin splittings and oscillator strengths of excitons and trions are measured and discussed.
pacs:
71.10.Ca, 71.35.-y, 73.20.Dx, 78.66.HfI INTRODUCTION
Charged excitons (or trions) are exciton complexes consisting of three particles. Two electrons and one hole form a negatively charged exciton . Two holes and one electron can be organized in a positively charged exciton . Trion complexes in bulk semiconductors, i.e. in three dimensions, are fragile, but become stable in low-dimensional systems. That is why the theoretical prediction of Lampert from 1958 Lampert (1958) was followed by a confident experimental observation of trions only in 1993 for the quasi-two dimensional electronic system in CdTe/(Cd,Zn)Te quantum wells (QW’s) Kheng et al. (1993). Since, positively- and negatively charged excitons have been studied experimentally in III-V heterostructures based on GaAs and in II-VI quantum well structures based on CdTe, (Cd,Mn)Te, ZnSe and (Zn,Mn)Se (see e.g. Cox et al. (1998); Glasberg et al. (1999); Astakhov et al. (1999); Crooker et al. (2000) and references therein).
II-VI semiconductors are very suitable for the trion studies due to their strong Coulombic interaction compared with III-V materials. E.g. exciton binding energies (exciton Rydberg) in GaAs, CdTe and ZnSe are 4.2, 10 and 20 meV, respectively. Among these materials ZnSe has the strongest Coulombic interaction. However, after the first report of observation in Zn0.9Cd0.1Se/ZnSe QW’s in 1994 Kheng et al. (1994), detailed investigations were started from 1998 only, when the high-quality ZnSe-based structures with binary quantum well layers were fabricated Ossau et al. (1998); Lovisa et al. (1998); Ivanov et al. (1999). At present rather detailed experimental information on trions in ZnSe QW’s is available: (i) negatively- and positively charged excitons were documented Astakhov et al. (1999); (ii) trions were reported for the light-hole excitons Ossau et al. (1998); Astakhov et al. (1999); (iii) singlet- and triplet trion states were studied in high magnetic fields Homburg et al. (2000); Yakovlev et al. (2001); (iv) spin structure of trions and spin-dependent formation process of trions were investigated Yakovlev et al. (2000a); Homburg et al. (2000); (v) recombination dynamics in magnetic fields Yakovlev et al. (2000b) and coherent dynamics of trions Wagner et al. (1999) were studied; (vi) oscillator strength of trion resonances was examined for different electron densities and in magnetic fields Astakhov et al. (2000). Theoretical results for this material system are limited to a calculation of the trion binding energy vs well width Riva et al. (2000) and its variation in high magnetic fields Yakovlev et al. (2001). Agreement with experiment was rather qualitative - one of the reasons for this is the uncertainty in the parameters used for the calculations.
In this paper we present a detailed study of trion binding energies in ZnSe-based structures as a function of quantum well width and applied magnetic field. Parameters of exciton and trion states were determined by means of magneto-optical experiments, calculated on the base of variational approach, and evaluated from the best fit of the experimental dependencies. The paper is organized as follows: Sec. II details the structures, while exciton parameters (measured and calculated) are discussed in Sec. III. In Sec. IV results on the binding energies of trions are collected and discussed. Finally, in Sec. V results of a modification of the singlet trion state in high magnetic fields and with increasing carrier density are presented.
In this paper we deal with positively- () and negatively ( ) charged excitons. We will label them in this way when the difference in the charge structure of trions is important. The term “trion” () will be used as a general definition for both positively- and negatively charged excitons.
II EXPERIMENTALS
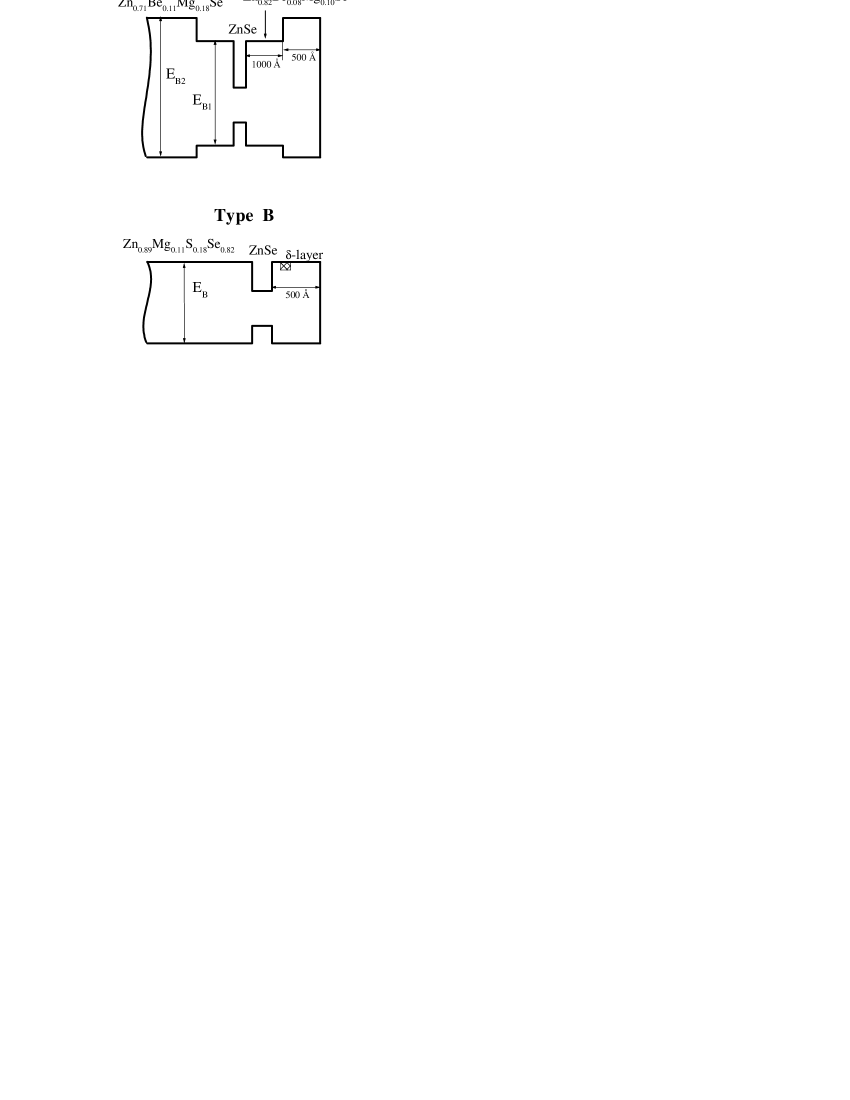
Quantum well structures. ZnSe-based quantum well heterostructures with a binary material of QW were grown by molecular-beam epitaxy on (100)-oriented GaAs substrates. Studied structures contain single quantum wells, with thickness varying from 29 to 190 Å. Schemes for the structure designs are presented in Fig. 1. Different barrier materials were used, namely (Zn,Be,Mg)Se, (Zn,Mg)(S,Se) and (Zn,Be)Se, as shown in Table 1. To each barrier material the type of a structure (A, B, C or D) has been assigned. Parameters of the barrier materials were chosen with an aim to make them lattice-matched to GaAs substrates, which allows growing QW’s of a very high structural quality.
| Barrier | ||||
| MATERIAL | Type | band gap, | to ZnSe | to ZnSe |
| (eV) | (meV) | |||
| Zn0.82Be0.08Mg0.10Se | A | 3.06 | 240 | 78/22 |
| first barrier | ||||
| Zn0.71Be0.11Mg0.18Se | A | 3.21 | 390 | 78/22 |
| second barrier | ||||
| Zn0.96Be0.04Se | D | 2.89 | 70 | 78/22 |
| Zn0.89Mg0.11S0.18Se0.82 | B | 3.02 | 200 | 50/50 |
| Zn0.95Mg0.05S0.09Se0.91 | C | 2.92 | 100 | 50/50 |
Most of the structures used in this study were nominally undoped (types A,C, and D). A background carrier density in them was tuned by an additional above-barrier illumination. The range of tuning depends on the QW width, allowing in the widest QW to vary electron density from 5109 to 1011 cm-2. Details of the illumination technique will be presented in Sec. IV.2. Two structures of type B were modulation-doped in the barrier layers. In the sample zq1038 free electrons in the QW were provided by -type doping with a 30-Å-thick, Cl doped layer (donor concentration of 51017 cm separated from the QW by a 100-Å-thick spacer. The sample zq1113 was -type doped with nitrogen (RF plasma cell at a power of 350 W and a background pressure of 510-6 Torr). In this sample, symmetric doping was achieved by uniform doping of barriers excluding 30-Å-thick spacer layers. The concentration of the two-dimensional hole gas (2DHG) in the QW of this sample is about 31010 cm-2 and was insensitive to additional illumination.
Strain effect on the band gap. ZnSe quantum well layers in the studied structures experience compressive strain due to a small difference in lattice constants of ZnSe and GaAs. This results in an increase of the band gap, which is different for the heavy-hole and light-hole states (for details see e.g. Refs. Lozykowski and Shastri, 1991; Asai and Oe, 1983). The calculated values of the band gap increase give 2 meV for the heavy-hole states and 16 meV for the light-hole states (required parameters of the elastic stiffness constants , and deformation potentials , are given in Table 2).
Band offsets. (Zn,Be,Mg)Se or (Zn,Mg)(S,Se) barrier materials differ by their band gap discontinuity to ZnSe quantum well and its distribution between the conduction and valence bands (where . The band gap discontinuity between the gap of ZnSe =2.82 eV (at =1.6 K) and the barrier gap is distributed between conduction and valence bands in proportion =78/22 for ZnSe/(Zn,Be,Mg)Se heterointerface König et al. (1999). For the ZnSe/(Zn,Mg)(S,Se) heterosystem, different values can be found in literature varying from 50/50 Miyajima et al. (1995); Ishibashi (1996) to 10/90 Shahzad et al. (1995). We chose a 50/50 ratio for our calculation of the structure parameters. We believe that very similar values for trion binding energies measured in the both types of studied structures (to be shown in Fig. 16) justify a considerable confinement for electrons and, respectively, approve our choice of . In Sec. III we will use, for consideration of exciton parameters, published experimental data for ZnSe-based QW’s with other barrier materials, namely, (Zn,Be)Se and (Zn,Mg)(S,Se) of lower content. Parameters for the barrier materials are collected in Table 1.
| “Unstrained” band gap 111Ref. Landolt-Börnstein, 1999. | 2.820 eV |
| Dielectric constant 111Ref. Landolt-Börnstein, 1999. | 9.0 |
| Elastic stiffness constants222Ref. Lozykowski and Shastri, 1991. | |
| 8.261010 N/cm-2 | |
| 4.981010 N/cm-2 | |
| Deformation potential 222Ref. Lozykowski and Shastri, 1991. | |
| -4.25 eV | |
| -1.2 eV | |
| Elastic strain 333. | 0.26 % |
| Band gap corrections due to strain 444Calculation according Ref. Asai and Oe, 1983. | |
| Heavy-hole band | 2 meV |
| Light-hole band | 16 meV |
| Electron effective mass 555Ref. Ohyama et al., 1988. | 0.15 |
| Heavy-hole effective mass | |
| along growth direction 666Because of uncertainty in heavy-hole effective mass given in the literature (values are in the range 0.61.0), for determination heavy-hole effective mass we take Luttinger parameters 2.45 0.61, which were determined in Ref. Hölscher et al., 1985 from two-photon magnetoabsorption measurements. | 0.8 |
Parameters of barrier alloys. Exciton energy of the barrier materials ( has been evaluated directly from the exciton resonance in reflectivity spectrum measured at =1.6 K. Taking for the exciton binding energy 20 meV (which is the value known for ZnSe) we estimate the band gap of the barrier , this value is given in Table 1. The band gap discontinuity to ZnSe ( is also included in the table. In the model calculations performed in Sec. III we will use values from Table 1, that are received from experiment.
To assign a certain composition of components in ternary and quaternary barrier materials the following considerations have been used. All structures were grown very closely lattice-matched to GaAs substrates, as confirmed by X-ray measurements. This condition gives us a ratio for the composition of different components in the quaternary alloys. For Zn1-xMgxSySe1-y lattice-matched alloys the results of Refs. Okuyama et al., 1994, 1998 have been used, which allow us to assign the barrier with =200 meV to Zn0.89Mg0.11S0.18Se0.82 and the one with =100 meV to Zn0.95Mg0.05S0.09Se0.91.
We give here more details for parameters we use for Zn1-x-yBexMgySe alloy parameterization, as literature data are rather limited and give large scattering. The band gap variation in ternary alloy Zn1-yMgySe taken from Ref. Litz et al., 1996,
| (1) |
agrees well with results given by different groups. For the band gap variation of Zn1-xBexSe alloys we utilize the results of Ref. Wilmers et al., 1999, where the full range of contents from ZnSe to BeSe has been studied. The band gap of BeSe at room temperature was determined as 5.55 eV and the respective band gap variation for the alloy has been fitted by the following equation
| (2) |
For the relatively small values of cation substitution (, 0.2) it is reasonable to construct the band gap variation of the quaternary alloy Zn1-x-yBexMgySe as a linear combination of Eqs. (1) and (2)
| (3) |
Lattice matching of the quaternary alloy to the lattice constant of GaAs (GaAs)=5.653 Å at =300 K gives us a relationship for and ingredients of the alloy. Based on the lattice constants for the binary alloys (5.6676 Å for ZnSe, 5.1520 Å for BeSe and 5.904 Å for MgSe Landolt-Börnstein (1999)) and the Vegard law Vegard (1921) the following dependencies for the lattice constants of ternary alloys (giving in Å) can be derived (for =300 K)
| (4) |
| (5) |
Lattice matching to GaAs corresponds to the ternary alloy Zn0.971Be0.029Se and quaternary alloys satisfying a condition
| (6) |
Combining Eqs. (3) and (6) one can arrive at the following condition for the energy gap of the lattice-matched quaternary alloy
| (7) |
We derive the Be and Mg content in Zn1-x-yBexMgySe from experimental values of the enegy gap and with use of Eqs. (7) and (6). Respective data are given in Table 1.
Experimental methods. Photoluminescence (PL), PL excitation, reflectivity (R) and spin-flip Raman scattering (SFRS) spectroscopies were exploited for experimental study of trion parameters. Optical spectra were detected at a low temperature =1.6 K. Different cw lasers were used for photoexcitation, e.g. UV lines of an Ar-ion laser, a He-Cd laser and a dye laser (Stylben 3). A halogen lamp was used in reflectivity experiments. External magnetic fields were applied along the structure growth axis (Faraday geometry). dc magnetic fields up to 7.5 T were generated by a superconducting solenoid and pulsed magnetic fields up to 47 T were used. In case of dc field experiments direct optical access to the sample was available through windows. For pulsed field experiments fiber optics were used. In both cases circular polarization degree of emitted/reflected light was analyzed. A complete set of field-dependent PL spectra was collected during each magnetic field pulse (for details see Ref. Crooker et al., 1999). Experiments in a capacitor-driven 50 T mid-pulse magnet (400 ms decay) were performed at the National High Magnetic Field Laboratory (Los Alamos, USA).
III PROPERTIES OF CONFINED EXCITONS
In the studies of trions, similar to excitons, the Rydberg energy of the exciton in bulk semiconductor is often chosen as a characteristic energy to parameterize the problem. In case of quantum confined heterostructures it is also instructive to compare the binding energies of trion states with the binding energies of confined excitons. We will follow this tradition in our investigations of charged excitons in ZnSe-based QW’s. Published information on the properties of excitons (e.g. effective mass, binding energy, g-factor, radiative and nonradiative dampings, etc.) in ZnSe-based QW’s with binary well material is rather limited. Therefore, we forestall the results on trions in this section where the exciton parameters for the ZnSe-based QW’s will be evaluated from optical and magneto-optical experiments and from variational calculations.
III.1 Theoretical model for magneto-excitons
In this section we will briefly describe the calculations of exciton levels in the quantum wells in presence of magnetic field directed along the growth axis.
All the calculations of exciton states presented in this paper where made within a parabolic approximation, i.e. the admixture of the light-hole states and all effects of nonparabolicity are neglected. The quantization of the electron and hole states along the structure growth axis (-axis) provides us with the natural basis in growth direction. We expand the wave function of the exciton in a series
| (8) |
, are the sets of solutions of one-dimensional (1D) Schrödinger equation for electron and hole in z-direction. The choice of the radial basis will be discussed bellow.
The Eq. (8) represents the basis set for calculation the exciton binding energy by diagonalization of the respective matrix. In case of strong confinement (i.e. when the Coulomb interaction is significantly less than the separation between quantum confined states) one can neglect the excited single particle states and the exciton problem reduces to 1D radial equation with the Coulomb potential weighted over the ground states of the electron and hole [for 1 in Eq. (8)].
However, in the case of shallow (or wide) QW’s, where energy separation between levels of quantum confinement is small, such a reduction of the basis in growth direction is not possible and to calculate the spectrum of magneto-excitons a numerical diagonalization scheme was used Gippius et al. (1998). Though the solutions of the 1D radial equation are far from the real exciton wave functions they form an orthonormalized basis that can also be used in Eq. (8). Such choice of the radial expansion basis allows evaluation of exciton parameters for wide range of magnetic fields including zero field limit, and provides better results for shallow QW’s than the simple one-dimensional calculations. We present here the main line of this approach.
In the parabolic approximation, the QW electron-hole () Hamiltonian in the magnetic field =(0,0,) takes the form
| (9) |
Here
| (10) |
is the band-offset potentials in conduction (valence) band, and are effective masses along growth direction of the electron and the heavy-hole, respectively. We will not account for weak anisotropy of electron effective mass in QW structures, i.e. take .
Hamiltonian describes the two-dimensional (2D) motion of a free electron-hole pair in the magnetic field,
| (11) |
where is the vector potential in the symmetric gauge, are the in-plane coordinates of electron (hole), . We neglect here the mass difference in the well and barrier layers. The potential
| (12) |
is the Coulomb interaction between the electron and hole. is the dielectric constant.
| (13) |
Here are quantum confined energies of electrons and holes, are the eigenvalues of the radial exciton equation with Coulomb potential averaged over the ground electron and hole states . Here we have made use of the fact that basis functions are the eigenfunctions of radial exciton Hamiltonian for the K=0 -exciton (with the angular momentum projection of the relative motion that reads as
| (14) |
where is the reduced exciton mass, and
| (15) |
| (16) |
The diagonalization of Hamiltonian (13) provides us with both the eigenvalues and eigenfunctions of the exciton states. The dimension of the basis used depends on the relative values of the quantization energy and the Coulomb interaction. The wider is the QW and, consequently, the smaller is the vertical quantization the larger should be the number of -functions taken into account. In our calculation we use all quantum confinement states in real QW and ten radial basis functions. The parameters required for the calculations are the QW width ( and band offsets (, , effective masses of electron and hole in vertical direction (, , in-plane reduced exciton mass ( and dielectric constants (. We took , , , (namely for the heavy-hole exciton) and from the literature, and were obtained experimentally. The primary parameters are given in Tables 1, 2 and determined ones are summarized in Tables 3 and 4.
In the frame of this approach we have calculated exciton energies for the studied QW structures vs QW width, exciton binding energies and modification of these parameters in external magnetic fields up to 50 T. Results of these calculations are included in Figs. 4 and 5.
III.2 Optical spectra of excitons
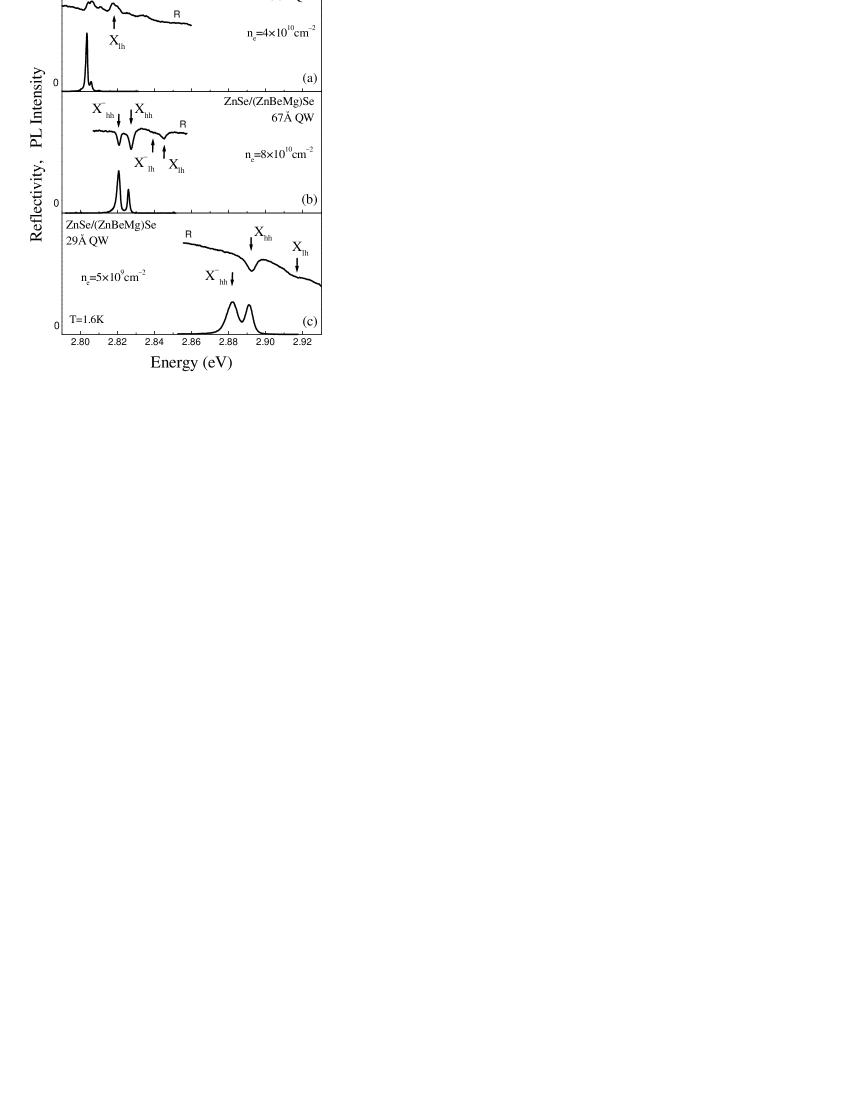
Figure 2 displays typical optical spectra for three ZnSe/Zn0.82Be0.08Mg0.10Se single QW’s, which covers the whole range of the studied QW widths from 29 to 190 Å. Photoluminescence and reflectivity spectra were measured in the absence of external magnetic fields at a temperature of 1.6 K. Exciton resonances corresponding to the states formed with heavy- and light holes ( and , respectively) are clearly visible in reflectivity spectra. Trion resonances shifted to low energies from the energy are seen in 67 and 190 Å QW’s. Their intensities in reflectivity spectra are proportional to the electron densities Astakhov et al. (2000). Low electron concentration and relatively large broadening make the trion resonance unresolvable for a 29 Å QW. For all structures shown, PL spectra consist of two lines, where the low-energy line is due to the radiative recombination of negatively charged excitons ( and the high-energy lines is due to recombination of neutral excitons (. Details of their identification in ZnSe-based QW’s can be found in Ref. Astakhov et al., 1999. With decreasing QW width, an increase of confined energies of carriers in the conduction and valence bands causes the high-energy shift of exciton transitions. It is accompanied by the broadening of exciton transitions due to QW width and barrier alloy fluctuations.
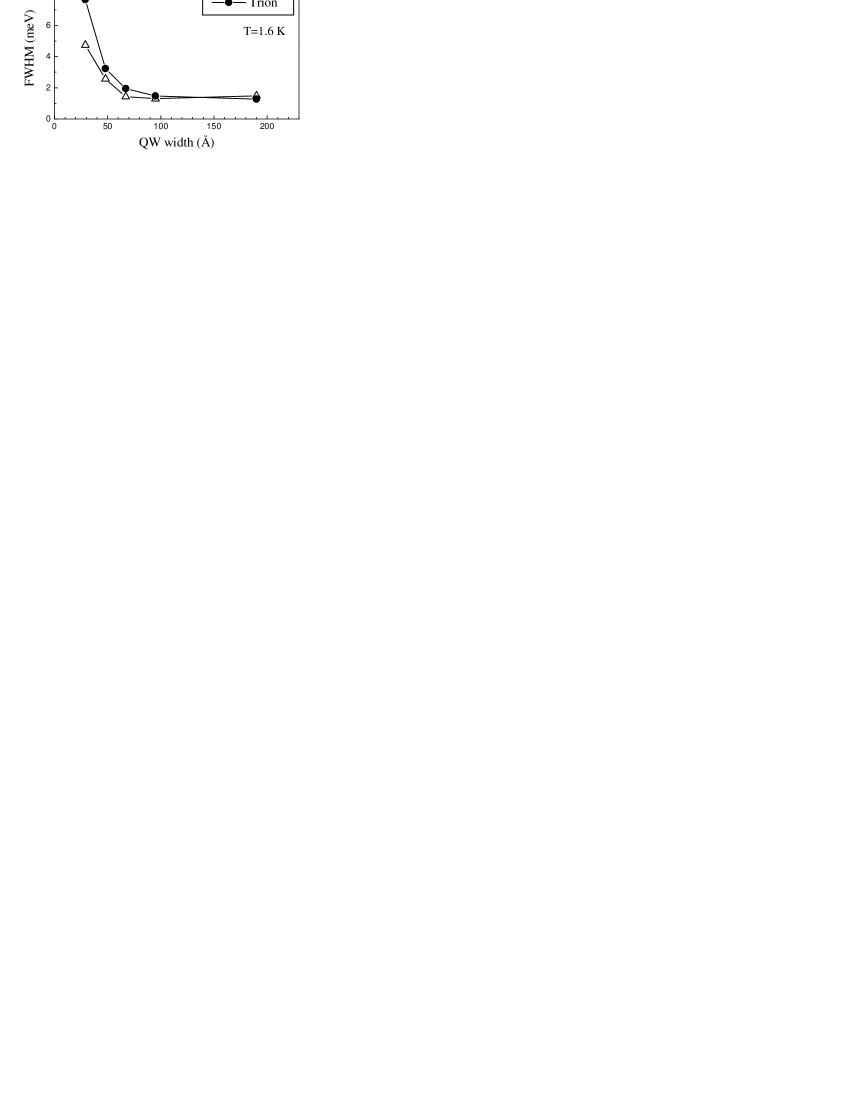
The full width at a half maximum (FWHM) of exciton and trion PL lines is plotted in Fig. 3. Exciton linewidth for 67 Å is smaller than 1.2 meV, which evidence the high structural and optical quality of the studied samples. For this range of QW width the trion linewidth roughly coincides with the exciton one. It is interesting that for 100 Å, exciton PL lines are narrower than the trion lines. The difference achieved 60% in a 29 Å QW. Possible reasons for that we will discuss below in Sec. V.4.
III.3 Excitons in high magnetic fields
Application of external magnetic fields allows evaluating important exciton parameters such as the in-plane reduced effective mass , and the g factor that characterizes the spin splitting of excitons due to the Zeeman effect. These parameters are important for understanding and calculating the spin- and energy structure of trions and excitons. Experiments were performed in pulsed magnetic fields to 47 Tesla. Application of high magnetic fields was required to induce sufficient energy shift of strongly bound excitons in ZnSe-based QW’s. Photoluminescence spectra were measured in two circular polarizations corresponding to two spin states of optically active excitons. Evolution of PL spectra with increasing magnetic fields is discussed in detail in Refs. Yakovlev et al., 2001; Ossau et al., 1998. Results on the spin splitting of excitons will be presented and discussed in Sec. III.5. Here we concentrate on the energy shift of exciton with increasing magnetic fields.
To avoid spin splittings a center-of-gravity of the exciton spin doublet was evaluated and plotted as a function of magnetic field strength in Fig. 4a for QW’s of different widths. Characteristic diamagnetic shift of excitons is seen for all samples. Exciton shift increases in wider QWs, which coincides with decreasing binding energy of excitons.
| Structure parameters | Effective mass | g factor | |||||||||||
| SAMPLE | Type | 222Evaluated as , where is corresponding measured by SFRS or calculated in case if no experimental value is available. | |||||||||||
| (Å) | (meV) | (meV) | 10 T | 40 T | SFRS | SFRS | Calc.111From our calculation. | 10 T | 40 T | ||||
| cb1175 | A | 29 | 240 | 24 | 1.21 | 1.17 | 1.13 | ||||||
| cb1173 | A | 48 | 240 | 20 | 0.119 | 0.58 | 1.0 | 1.3 | 1.17 | 1.17 | 1.13 | 2.2 | 2.5 |
| cb1041 | A | 67 | 240 | 18 | 0.112 | 0.44 | 0.4 | 0.9 | 1.13 | 1.5 | 2.0 | ||
| cb1174 | A | 67 | 240 | 17 | 1.13 | 1.13 | 1.13 | ||||||
| cb1198 | A | 95 | 240 | 13 | 1.11 | 1.11 | 1.12 | ||||||
| cb1172 | A | 190 | 240 | 11 | 0.107 | 0.37 | 0.4 | 0.4 | 1.11 | 1.11 | 1.12 | 1.5 | 1.5 |
| zq1038 | B | 80 | 200 | 17 | 1.17 | 1.14 | 1.15 | ||||||
| zq1113 | B | 105 | 200 | 16 | 0.109 | 0.40 | 0.5 | 0.7 | 1.14 | 1.6 | 1.8 | ||
| zq703 | C | 45 | 100 | 19 | 0.115 | 0.50 | 0.4 | 0.8 | 1.22 | 1.6 | 2.0 | ||
Solid lines in Fig. 4a show the best fit of experimental data in the frame of the model described in Sec. III.1. Parameters used for the calculations were taken from Tables 1 and 2. The exciton reduced mass is the only free parameter in the fit. Determined values of are included in Table 3 and also plotted in Fig. 4b vs . The reduced mass increases for thinner QW’s with functional dependence that can be interpolated as [Å] (see solid line in Fig. 4b). Taking the value of the electron effective mass to be independent of the well width (this is valid as confinement energies in the studied structures are small, do not exceed 60 meV, and one should not expect strong contribution of nonparabolicity in the conduction band to the electron effective mass), the in-plane values for the heavy-hole effective mass are determined by means of relationship . These values are displayed in Fig. 4b by open squares (right axis). One can see that increases significantly from 0.37 in a 190 Å QW to 0.58 in a 48 Å QW. This fact should be accounted in model calculations of trions binding energies vs QW width (e.g. Riva et al. (2000)).
III.4 Confined excitons
QW width dependencies for exciton energy and exciton binding energy were calculated by means of the model described in Sec.III.1. Structure parameters used for the calculations are in Tables 1, 2 and 3. Results of these calculations are displayed in Fig. 5.
In Fig. 5a calculated exciton energies for different types of structures (which differ by barrier heights and band offsets) are plotted by lines. We use these dependencies and experimental values of the exciton energies to determine QW width in the studied structures. Experimental data are shown by symbols and included in Table 4 . Nominal values of the QW width evaluated from the technological parameters coincide with high accuracy with the calculated values.
In Fig. 5b binding energies of 1s and 2s exciton states are plotted as a function of for ZnSe/Zn0.82Be0.08Mg0.10Se structures. One can see that in ZnSe QW’s, the exciton binding energy (i.e. the binding energy of 1s state) has its maximum for QW’s with 20 Å. This value is 40 meV, i.e. about twice as large as the bulk exciton Rydberg =20 meV. This value indicates that in the ZnSe QW’s, the exciton is quasi-two-dimensional, as its binding energy is considerably smaller than the binding energy in 2D limit, 4=80 meV.
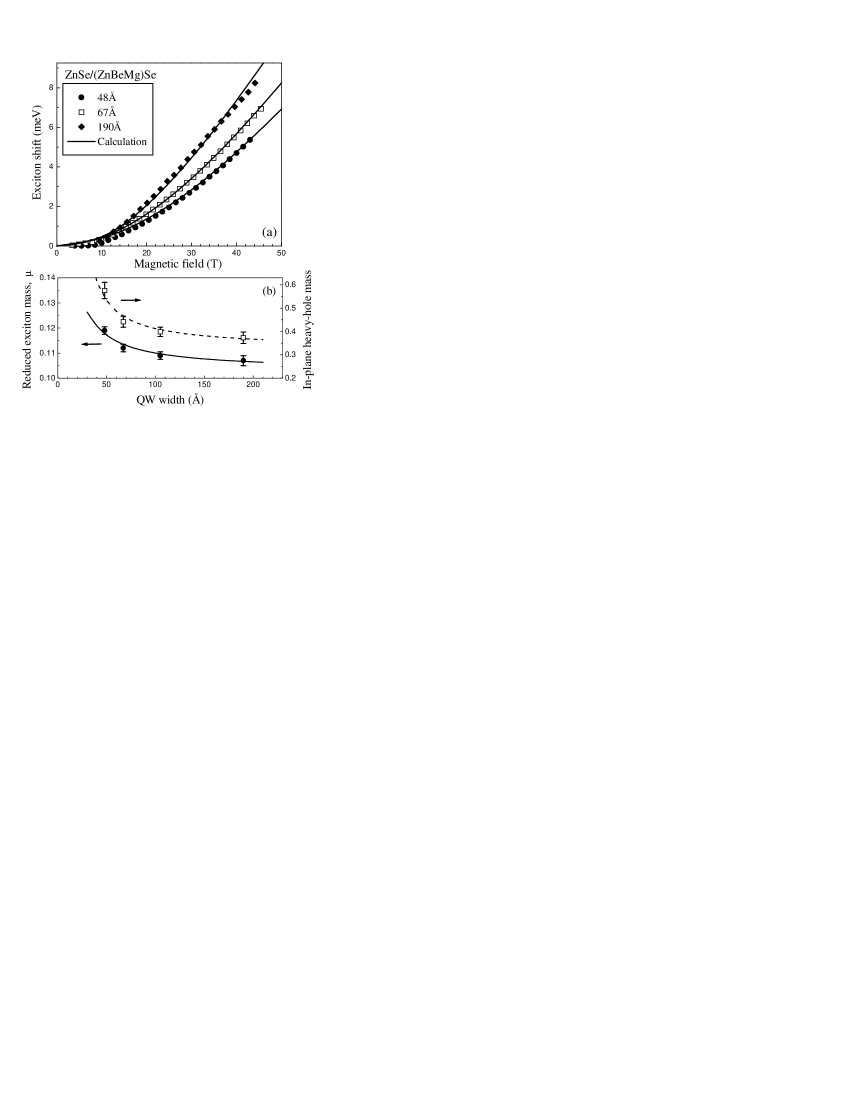
(b) Reduced mass of exciton (left axis) and in-plane heavy-hole mass (right axis) vs QW width. Symbols are experimental data. A solid line is an interpolation of data points by the hyperbolic function [Å]. A dashed line is a result of calculation along .
III.5 Zeeman splitting of excitons and free carriers
The spin splitting of the exciton states is composed of the splitting of conduction- and valence bands which are characterized by the electron- ( and hole ( or for the heavy-hole or light-hole subbands) gyromagnetic ratios (g values). Following Ref. Sirenko et al., 1997 we define the exciton g factor as . Values of g factors depend on the band structure parameters. They can be calculated with high accuracy for the conduction band. Modeling of the g factors for the valence band is more complicated due to the mixing of heavy-hole and light-hole bands, whose splittings depend on the structure parameters (strain, quantum confinement, differences in band parameters of the barrier and QW materials) (see e.g. Ref. Kiselev et al., 1998). Detailed investigations of electron g factors in (Zn,Mg)Se and Zn(S,Se) alloys Wolverson et al. (1999) and ZnSe/(Zn,Mg)(S,Se) QW structures [51] have been performed by means of spin-flip Raman scattering spectroscopy. It was shown that with a properly chosen set of band parameters, the five-band model calculations, which accounts for the off-diagonal spin-orbit coupling terms (TO model in Ref. Wolverson et al., 1999), give a very good agreement for the band gap dependence of in ZnSe-based ternary alloys. The values for the quaternary alloy (Zn,Mg)(S,Se) are also in a reasonable agreement with model estimations Wolverson et al. (1999); Davies et al. (2000). Estimation for the barrier materials in our structures gives us =+1.32 and +1.38 for Zn0.95Mg0.05S0.09Se0.91 and Zn0.89Mg0.11S0.18Se0.82, respectively. These values exceed the electron g factor in ZnSe =+1.12 (see Ref. Wolverson et al., 1999 and references therein).
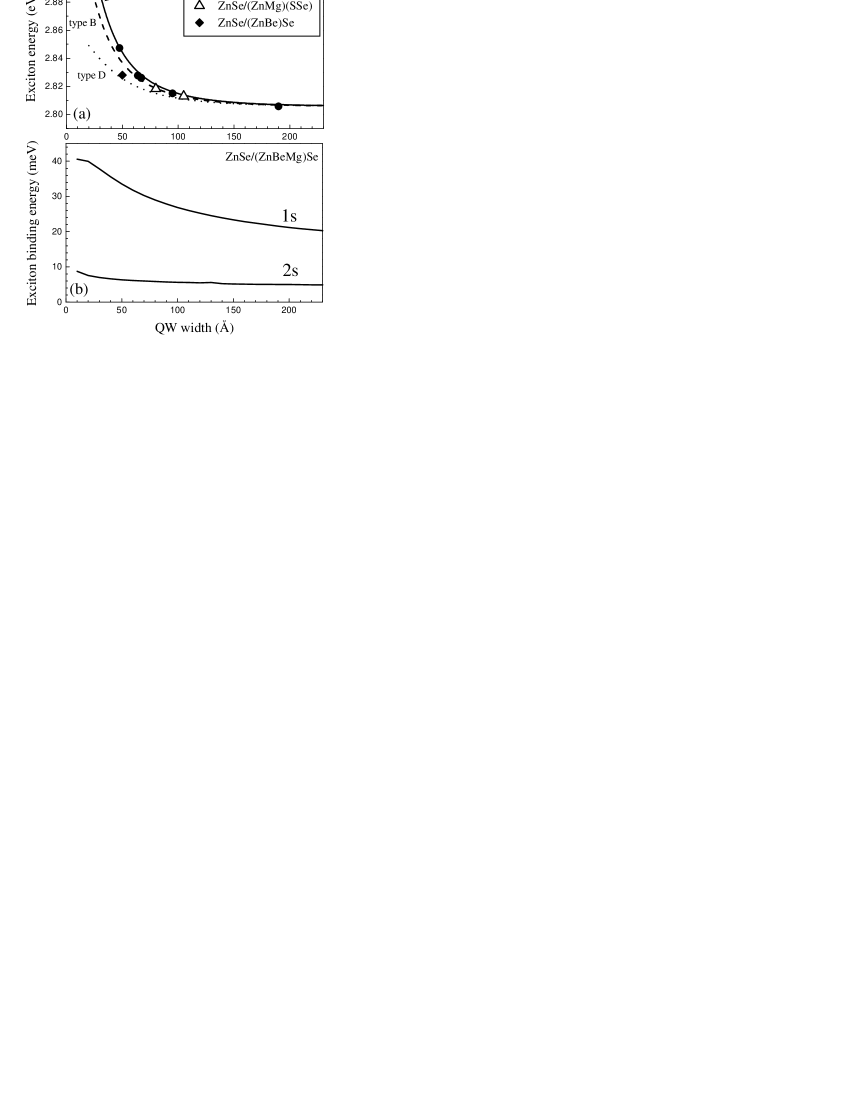
(b) The calculated exciton binding energy (1s- and 2s states) as a function of QW width for type A ZnSe/Zn0.82Be0.08Mg0.10Se structures.
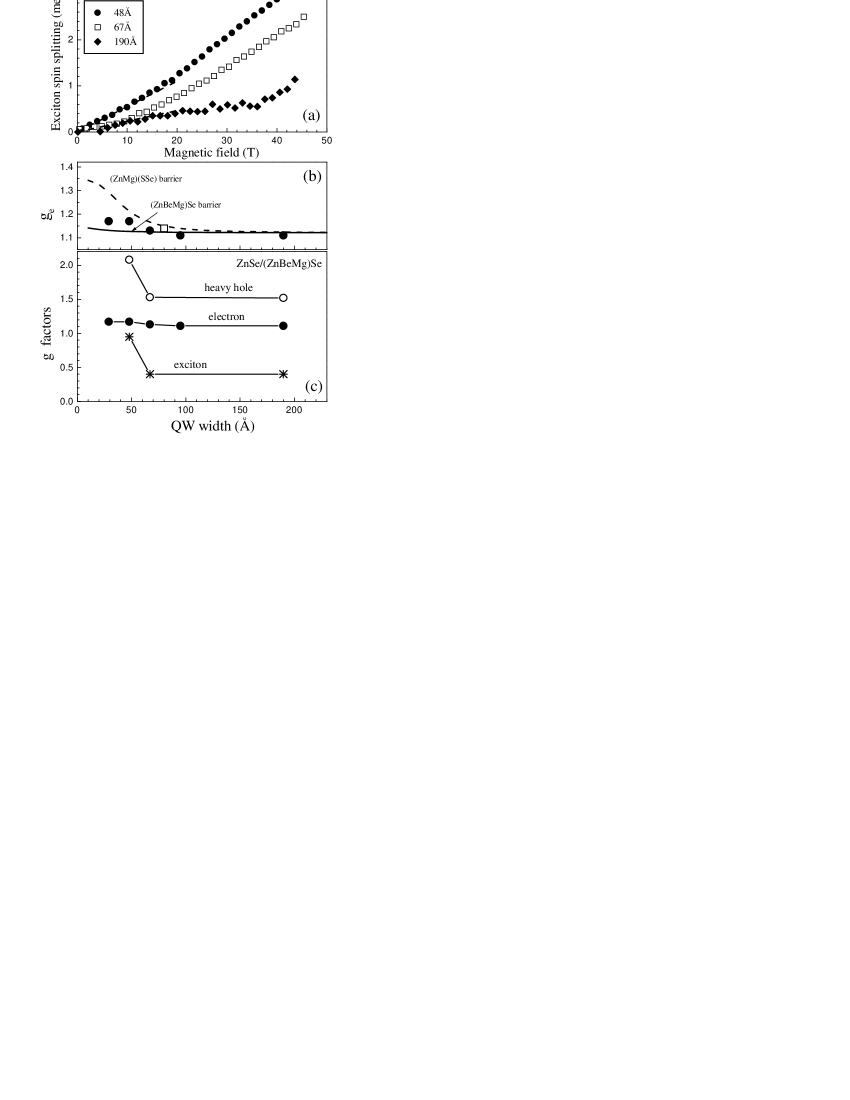
(b) Electron g factors for QW’s with type A (circles and solid line) and type B (squares and dashed line) barriers: lines are calculation and symbols are experimental data measured by spin-flip Raman scattering in the Faraday geometry.
(c) g factors in ZnSe/Zn0.82Be0.08Mg0.10Se QW’s. Exciton values for the low field limit (10T) are shown by stars. Solid circles present the electron g factor . Heavy-hole g factor evaluated as is given by open circles. Lines are guides to the eye.
A well width dependence of the electron g factor in ZnSe/Zn0.89Mg0.11S0.20Se0.80 QW’s (which are practically identical to our samples with Zn0.89Mg0.11S0.18Se0.82 barriers and 200 meV) has been investigated in Ref. Davies et al., 2000. Comparison with the model calculations allows authors to conclude that in contrast to the alloys the three-band model is sufficient to calculate g factors in QW structures. Two additional factors should be accounted for in QW’s. First, there is difference in the band parameters in the well and barrier materials. In ZnSe-base QW’s with relatively low barriers with band gaps in the region of 2.8-3.1 eV, the main contribution comes from the difference in the spin-orbit splitting . However, the change of is rather small in the case of the group II element to be substituted, but is large if the group VI element is altered. In other words, one can omit the variation of for the structures with (Zn,Be,Mg)Te barriers, but it should be accounted for in the case of (Zn,Mg)(S,Se) barriers. The second consideration specific to the QW structures is due to the anisotropy of the electron g factors. Its value is relatively small (usually less than 10% of and is controlled by the splitting of light-hole and heavy-hole states due to strain and confinement effects. Experimental values of and obtained by spin-flip Raman scattering for the type A and B ZnSe QW’s confirm the small value for anisotropy (see Table 3).
Electron g factor for the type A QW’s was measured by SFRS at the University of Bath. Details of experimental technique are published in Refs. Davies et al., 2000; Wolverson et al., 1999. Experiments were performed in the Faraday and Voigt geometries to measure and components of the electron g factor, respectively. Their values are included in Table 3 and are shown by solid circles in Figs. 6b and 6c. Experimental data for an 80 Å ZnSe/Zn0.89Mg0.11S0.18Se0.82 QW were taken from Ref. Yakovlev et al., 2000a (shown by squire in Fig. 6b).
Using the results of Ref. Davies et al., 2000 we calculated average values for in the structures of type A and type B. For the type A structures with (Zn,Be,Mg)Se barriers we use equation (7) from Ref. Davies et al., 2000
| (17) |
Here =+1.12 is the electron g factor in ZnSe, , is the squared momentum matrix element in ZnSe, eV in ZnSe, is exciton energy measured experimentally (see Table 4). The results are shown in Fig. 6b by a solid line. One can see that the value is rather weakly dependent on the QW width for the whole studied range from 29 to 190 Å.
A more elaborate approach, accounting for the difference in for QW and barriers layers, was applied for the calculation of electron g factors in the type B QW’s with (Zn,Mg)(S,Se) barriers. It is described by Eq. (8) from Ref. Davies et al., 2000 and we do not detailed it here. In this case is more sensitive to the QW width for 100 Å (see dashed line in Fig. 6b).
Hole g factors are strongly anisotropic (e.g. in-plane component of and their values are determined in a complicated manner on the splitting of heavy-hole and light-hole states (see e.g. Ref. Kiselev et al., 1998). We are not aware of any simple calculation approach to this problem and will limit ourselves by experimental dependencies. Note that the bulk relation is not valid anymore in QW’s.
Exciton Zeeman splittings in QW’s of different thickness in Fig. 6a show reasonably good linear dependence on magnetic fields at 10 T and some deviation from a linear behavior at high fields. It is well known that the nonlinearity of the exciton g factor is caused by the nonlinearity of its hole component , that in turn is due to the admixing of light-hole states in high magnetic fields. Electron Zeeman splittings, as a rule, shows a linear dependence over a wide range of magnetic fields, and this is true for ZnSe-based QW’s Davies et al. (2000). To quantify the nonlinear spin splitting values we include in Table 3 two values for the exciton ( and heavy-hole g factors estimated from linear interpolation of data points at low magnetic fields (10 T) and evaluated from the exciton spin splitting at =40 T.
Exciton and carrier g factors for different QW’s are collected in Table 3 and displayed in Fig. 6c. In the figure the data are given for ZnSe/Zn0.82Be0.08Mg0.10Se QW’s. Exciton values for the low field limit (10 T) are shown by stars. In 190 and 67 Å QW’s they are equal to +0.4 and increases to +1.0 in a 48 Å QW. Solid circles trace the electron g factor , which is weakly dependent on the well width. Heavy-hole g factor evaluated as is given by open circles. Its dependence on the QW width reflects the behavior.
Now we have all parameters necessary for analysis of the spin- and energy structure of the trion states reported in this paper. Some further information on the exciton properties including radiative- and nonradiative damping, coherent- and recombination dynamic of excitons and trions in ZnSe-based QW’s can be found in Refs. Astakhov et al., 2000; Wagner et al., 1999; Yakovlev et al., 2000b. We turn now to the main part of the paper, where the properties of charged excitons are investigated.
IV CHARGED EXCITONS
IV.1 Identification of negatively- and positively charged excitons
Charged exciton states in optical spectra can be identified by their specific polarization properties in external magnetic fields. Analysis of the circular polarization degree of photoluminescence is rather complicated. In addition to the spin polarization of the free carriers, the spin-dependent trion formation and spin relaxation of trions are involved Yakovlev et al. (2000a). However, polarization properties of the trion states in reflectivity, absorption or transmission spectra allow to distinguish trions from excitons and positively- and negatively charged excitons from each other. Here we present in short principles of the identification, and further details can be found in Refs. Astakhov et al., 1999, 2000.
The polarization degree of the trion resonance in reflectivity spectra mirrors the polarization of free carriers in QW’s which is caused by thermal distribution of the carriers among the Zeeman sublevels. This is due to the singlet spin structure of the trion ground state, i.e. spins of two carriers with the same charges (electrons in and holes in in the trion complex are oriented antiparallel. A triplet trion state with parallel orientation of these spins is unbound at zero magnetic field and becomes bound in high fields only Yakovlev et al. (2001). When free carriers are fully polarized by magnetic field the trions can be excited optically only for one circular polarization. In case of negatively charged excitons in ZnSe QW’s with a positive electron g factor it is polarization.
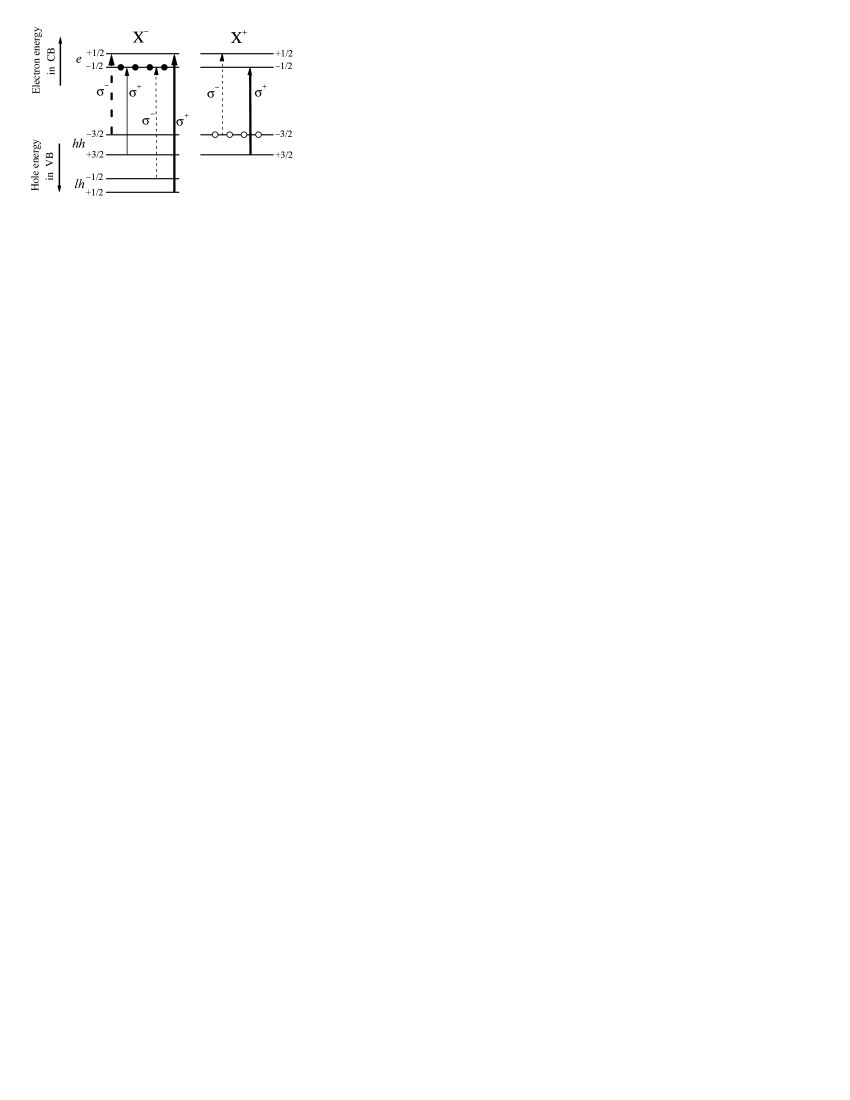
A scheme of the optical transitions responsible for trion excitation in strong magnetic fields is presented in Fig. 7. Spin-split states at the bottom of the conduction band and the top of the valence band are shown. Arrows indicate optical transitions, where the absorbed light promotes an electron from the valence band to the conduction band and forms an exciton. Exciton generation in the presence of free carriers results in trion formation. Thick and thin arrows mark the allowed and forbidden transitions for the trion excitation in its ground state, when the carriers are fully polarized. It is clear from the scheme that related to the heavy-hole and light-hole excitons will appear in opposite polarizations. Also and in ZnSe QW’s, where electron and hole g factors are positive, can be clearly distinguished by their opposite polarizations.
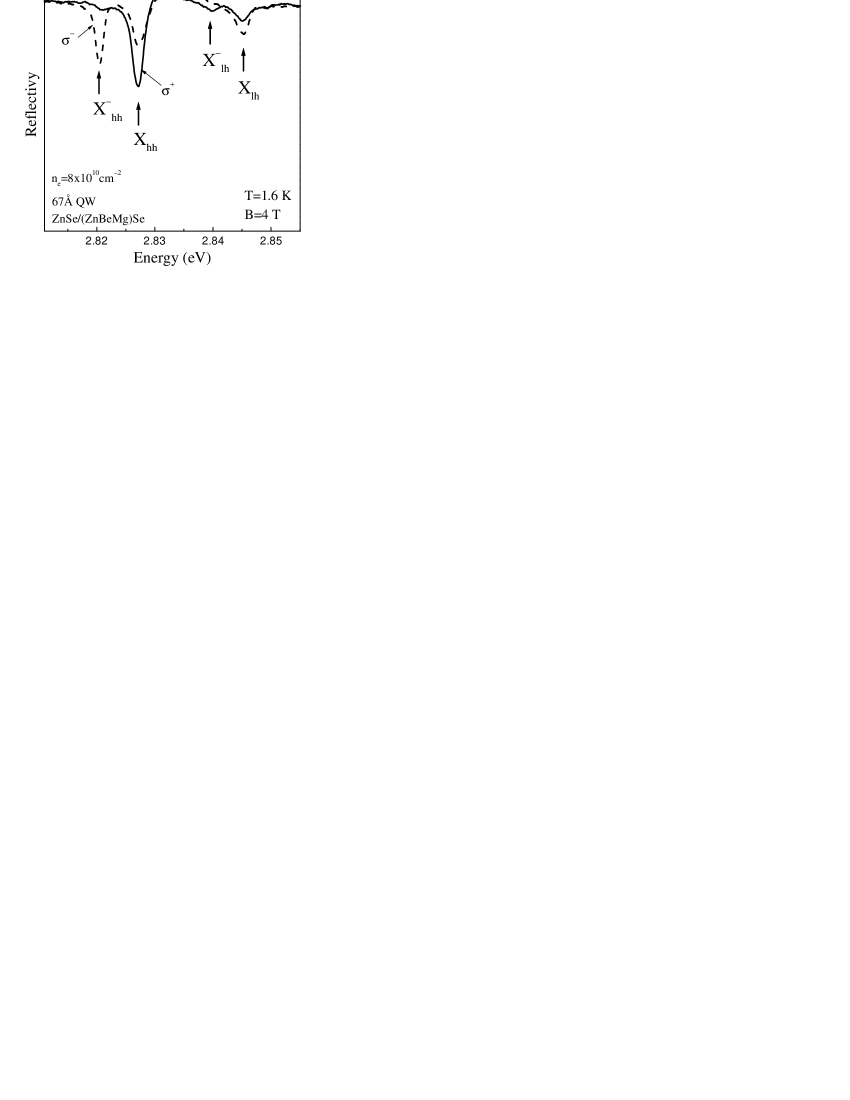
In Fig. 8 typical reflectivity spectra containing strongly polarized resonances of negatively charged excitons associated with heavy-hole excitons ( and light-hole excitons ( are given. Results are shown for a 67 Å ZnSe/Zn0.82Be0.08Mg0.10Se QW and a magnetic field of 4 T. In accordance with the selection rule discussed above, and resonances show up in different polarizations, i.e. and respectively.
Examples of the opposite polarization of and in ZnSe QW’s can be found in Ref. Astakhov et al., 1999 and in Fig. 10 in the next section, where a recharging effect of the QW by above-barrier illumination is discussed.
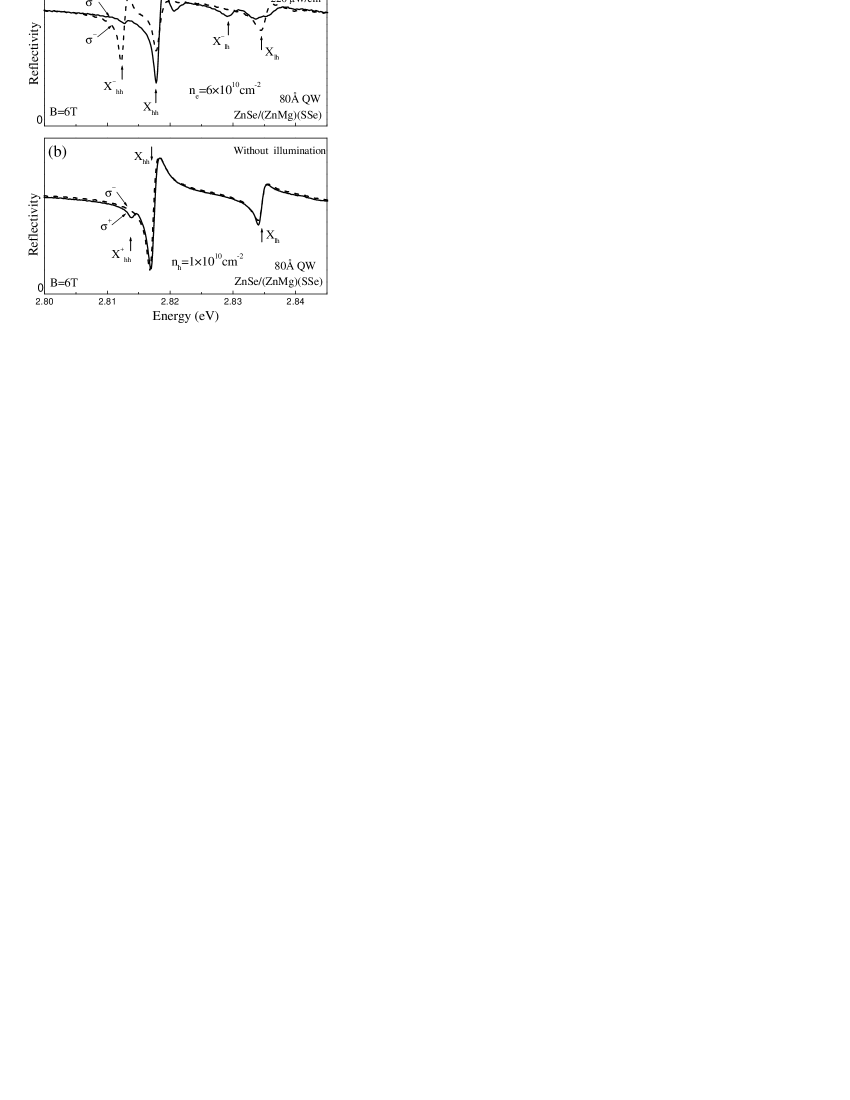
(b) Without above-barrier illumination at a magnetic field of 6 T. Arrows indicate positively charged exciton ( and excitons formed with heavy-hole and light-hole. =1.6 K.
IV.2 Optical tuning of carrier density in QW’s
Optical tuning of a carrier density in QW’s is a very reliable method that is widely exploited for the trion studies Naumov et al. (1995); Shields et al. (1995); Glasberg et al. (1999); Kossacki et al. (1999). Different structure designs have been suggested for this purpose. The principle of the method is in spatial separation of electron-hole pairs photogenerated by photons with energies exceeding the barrier band gap. Depending on the structure design, one type of carrier is captured by the surface states, trapped centers in barriers or additional quantum well. The other type of carrier is collected into the quantum well where it is involved in the trion formation. Free carrier concentration in the QW is tuned by the intensity of the above-barrier illumination. However, the dependence of the concentration on the illumination intensity can be very nonlinear with a pronounced saturation at higher intensities. The optical method can be also used for a fine tuning of carrier densities in structures with modulation doping and/or under applied gated voltage.
We will show here that optical tuning is very effective for the types A and B of ZnSe-based heterostructures investigated in this paper. Let us start with the type B structure zq1038, where the 80 Å QW is separated from the surface by a 600 Å Zn0.89Mg0.11S0.18Se0.82 barrier. Reflectivity spectra measured under different illumination intensities are presented in Fig. 9. Laser light with 3.5 eV was used for illumination and the high-energy part of the halogen lamp spectrum was cut by a 420 nm edge filter. Without laser illumination strong exciton resonances and dominate the reflectivity spectrum shown by dashed line. Only a weak resonance is detectable 3.3 meV to low energies from the one. With increasing illumination power the resonance vanishes and a new resonance appears. Its energy distance from the exciton energy is 4.4 meV. We note here that the same trick has been done in Ref. Glasberg et al., 1999 for GaAs-based QW’s. It is elegant and very convincing as it allows measuring parameters of and resonances in the same structure, thus avoiding technological and growth uncertainties.
Identification of charged exciton resonances were based on their polarization properties in external magnetic fields (see Fig. 10). We conclude from the data of Fig. 9 that without illumination all donor-electrons from the modulation-doped layer are either captured by charged surface states or remain on donors. In this condition the QW contains a very diluted hole gas with =1 cm-2. This value was determined from the oscillator strength of the transition, which for low carrier densities is linearly proportional to the carrier concentration (see details in Refs. Astakhov et al., 2000, ). Laser illumination redistributes the carrier location in the structure by supplying the QW with electrons. An increase of the electron density saturates at =6 cm-2 (for detailed behavior see Fig. 11), which is still much lower than the concentration of donors in the modulation doped layer =3 cm-2 evaluated from a technological calibration. We suggest that the reason is a relatively small conduction band offset in this structure (=100 meV). Internal electric fields caused by carrier separation, when only part of the electrons are removed from the donors, can compensate for the energy difference between the electron level in the QW and the barrier donor energy.
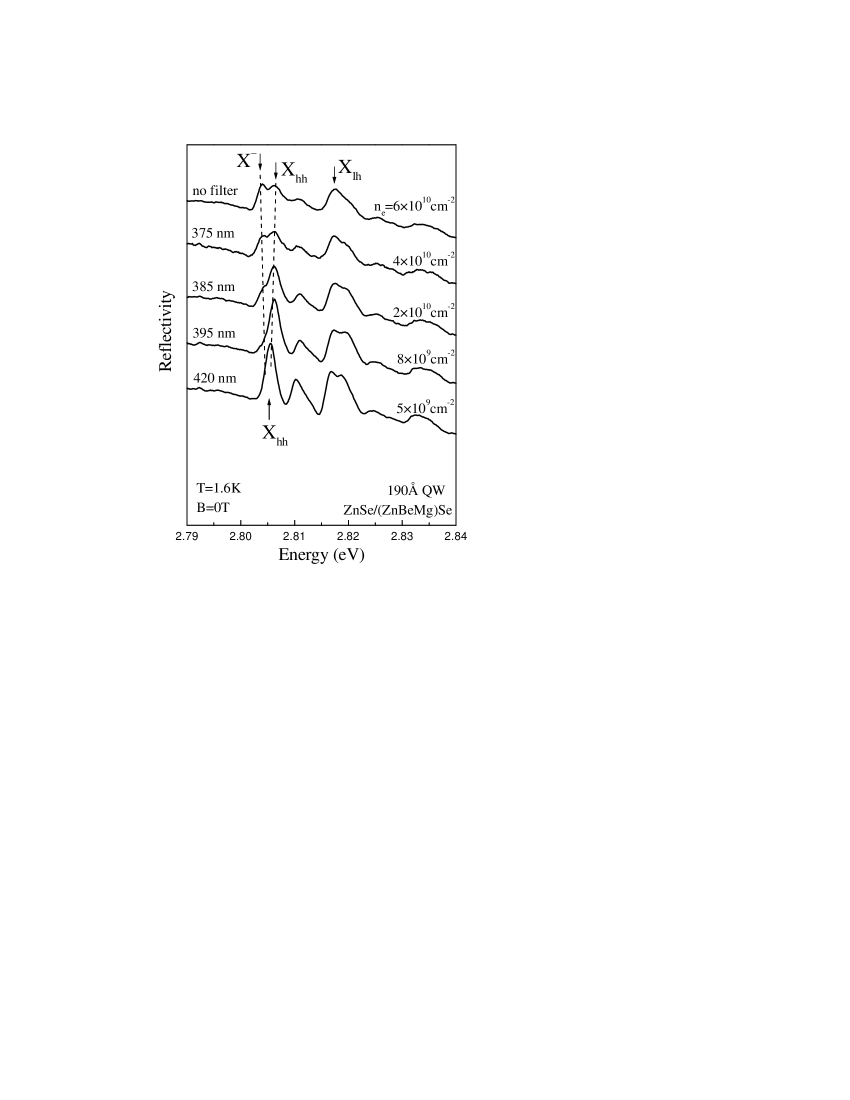
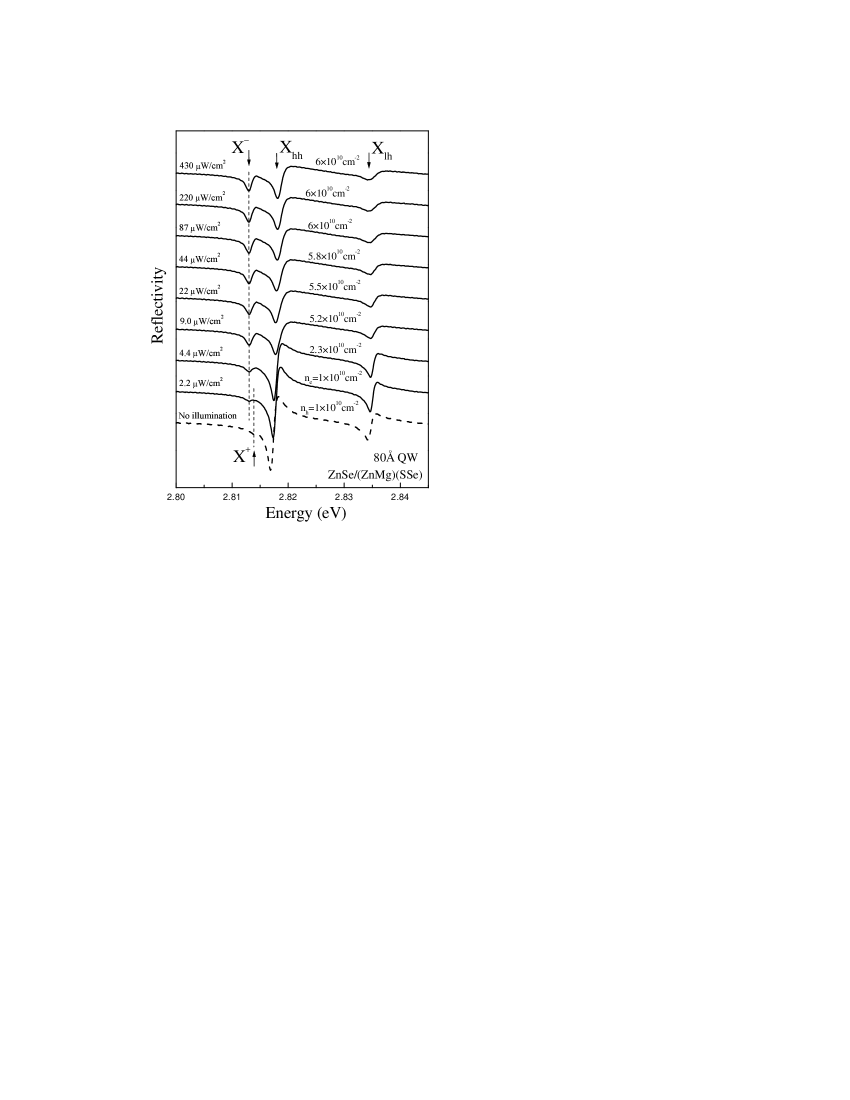
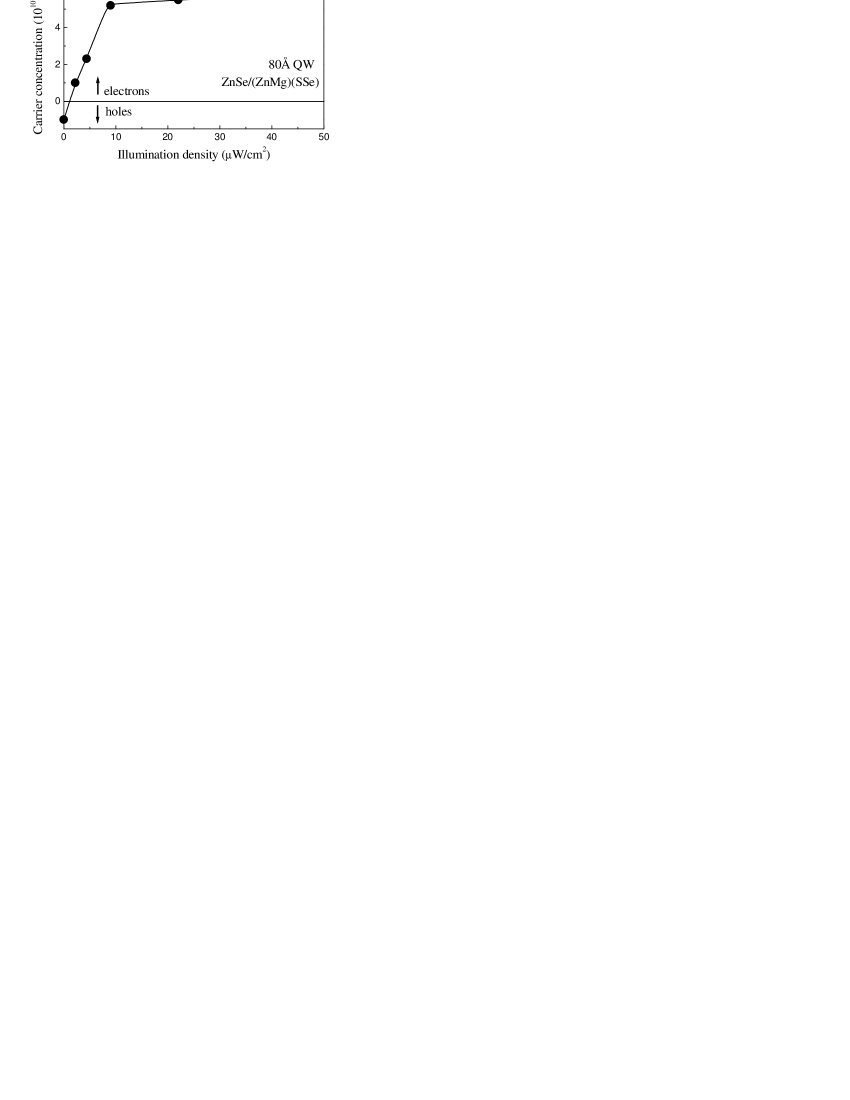
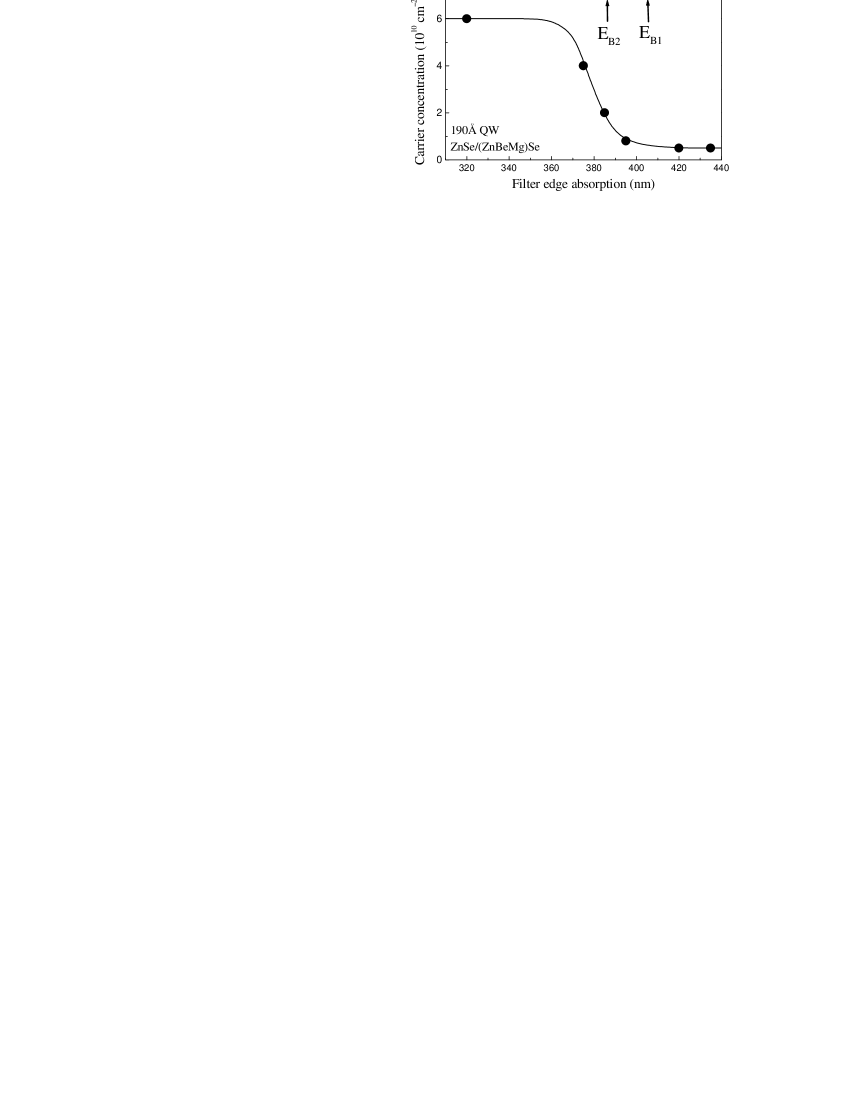
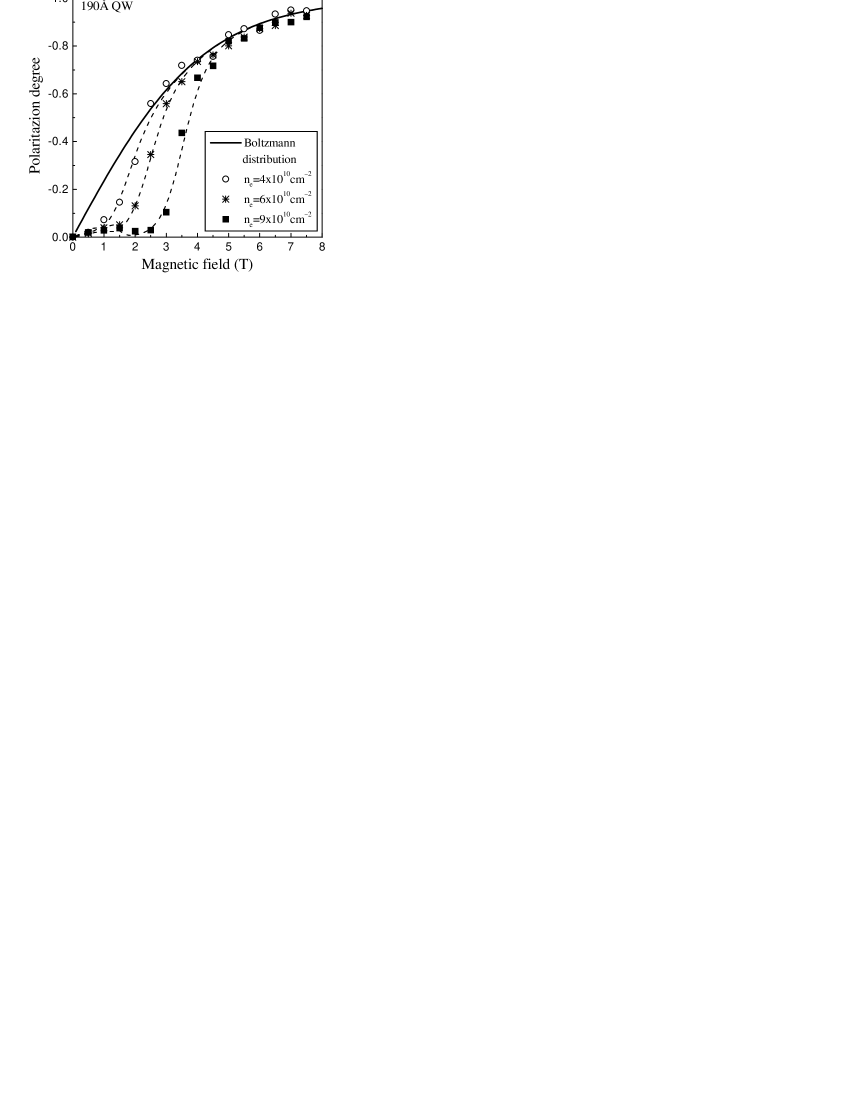
In the type A structure cb1172, a 190 Å QW is separated from the surface by two barriers of different heights. Note that this structure is nominally undoped. Instead of the laser we use for illumination the light of the halogen lamp selected by edge filters. Reflectivity spectra are shown in Fig. 12. Only exciton transitions are visible in the spectrum measured with a 420 nm filter, i.e. when photocarriers are excited only in the ZnSe layer of the 190-Å-thick QW. A threshold-like increase of the electron density in the QW starts when the energy of illumination light exceeds the band gap of the highest barrier (3.21 eV), as clearly seen in Fig. 13. The electron density in this structure is varied from 5 to 9 cm-2. was evaluated from the analysis of the polarization degree of the trion line. The procedure has been suggested in Ref. Astakhov et al., 2000 and detailed later in Ref. Astakhov et al., . It is based on the fitting of the magnetic-field-induced polarization of trion resonance in the frame of the approach accounting for the Fermi-Dirac statistics of the electron gas. Dashed lines in Fig. 14 show examples of the fitting. The Fermi energy that is determined from the best fit of experimental data points is directly linked to the electron density. From the threshold-like effect of the illumination on the electron density in the QW shown in Fig. 14 we conclude that a recharging of surface states (namely a capture of photo-holes by the surface states) is the main mechanism for the carrier separation that supplies the QW with free electrons.
IV.3 Exciton-trion energy separation. Effect of the Fermi energy
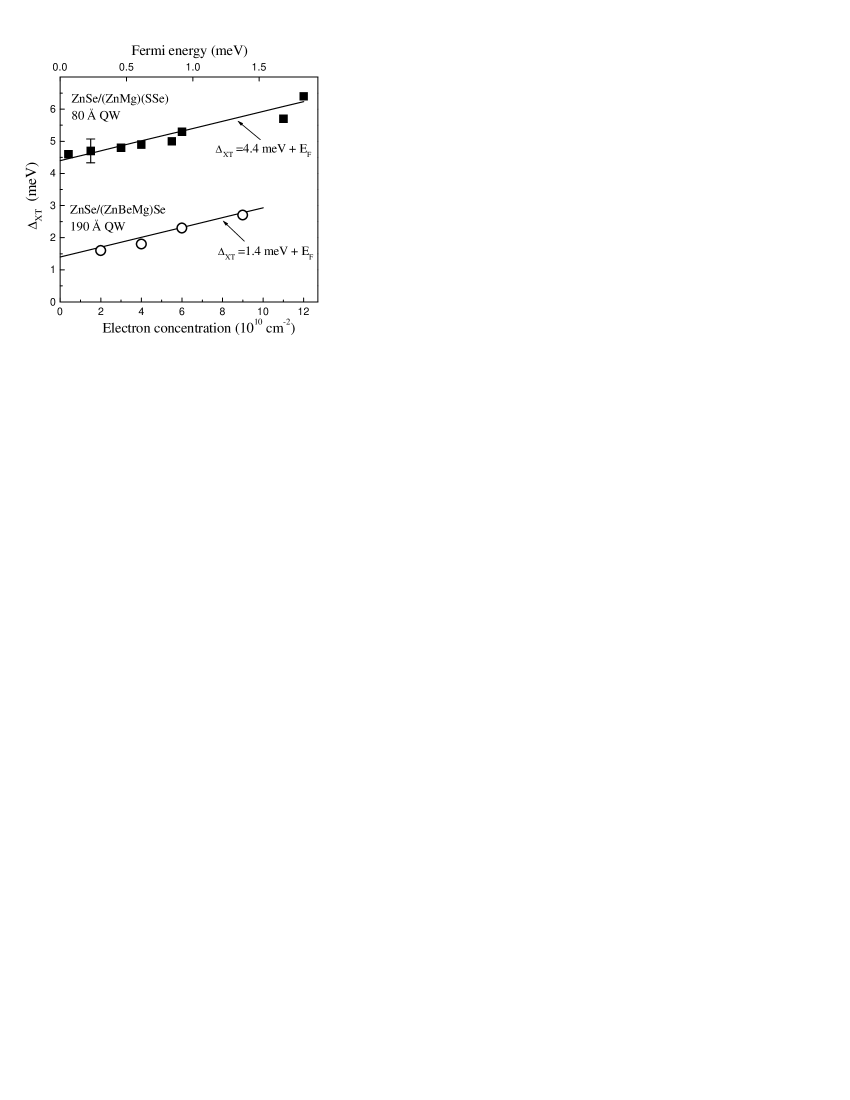
Now we turn our attention to the binding energy of the trions , defined as the energy required to dissociate an isolated trion into a neutral exciton and an electron (for ) or a hole (for ). In the limit of a very diluted carrier gas, is given by the energy difference between the exciton and trion lines (i.e. energy separation between bound and unbound states) . A deviation from this “bare” value of takes place with increasing carrier density. In Fig. 15 we show the exciton-trion separation as a function of electron density for two QW’s. In the case of an 80 Å ZnSe/Zn0.89Mg0.11S0.18Se0.82 QW (squares) the electron concentration was varied by modulation doping. For a 190 Å ZnSe/Zn0.82Be0.08Mg0.10Se QW (circles) the electron density was tuned via additional illumination (see Sec. IV.2). For both cases the exciton-trion energy separation increases remarkably with the electron density. Solid lines in Fig. 15 have a slope of the Fermi energy increasing with growing electron density . In ZnSe QW’s with =0.15 [meV]=1.53 [cm-2]. Comparing solid lines and data points in the figure one can establish that the concentration dependence of the exciton-trion energy separation is approximately given by the Fermi energy: . This result has been also reported recently for CdTe-based QW’s Huard et al. (2000).
Such a behavior of does not correspond to a real increase of the trion binding energy and can be quantitatively explained in terms of exciton-trion repulsion due to their mixing Suris et al. (2001). This mixing is provided by mutual transformation of exciton and trion states via exchange of additional electron. The detailed investigation of mixed exciton-trion states will be published elsewhere.
To obtain the value we extrapolate experimental dependencies to the limit (see Fig. 15) getting the “bare” binding energy of trion . We performed this procedure for all studied structures in order to receive information on binding energies of “isolated” trions that can be directly compared with theoretical calculations.
IV.4 Binding energy of trions
Binding energies of trions determined for the low carrier density regime are collected in Table 4 and are displayed in Fig. 16a as a function of QW width. Solid symbols correspond to , open symbols show and crosses are used for .
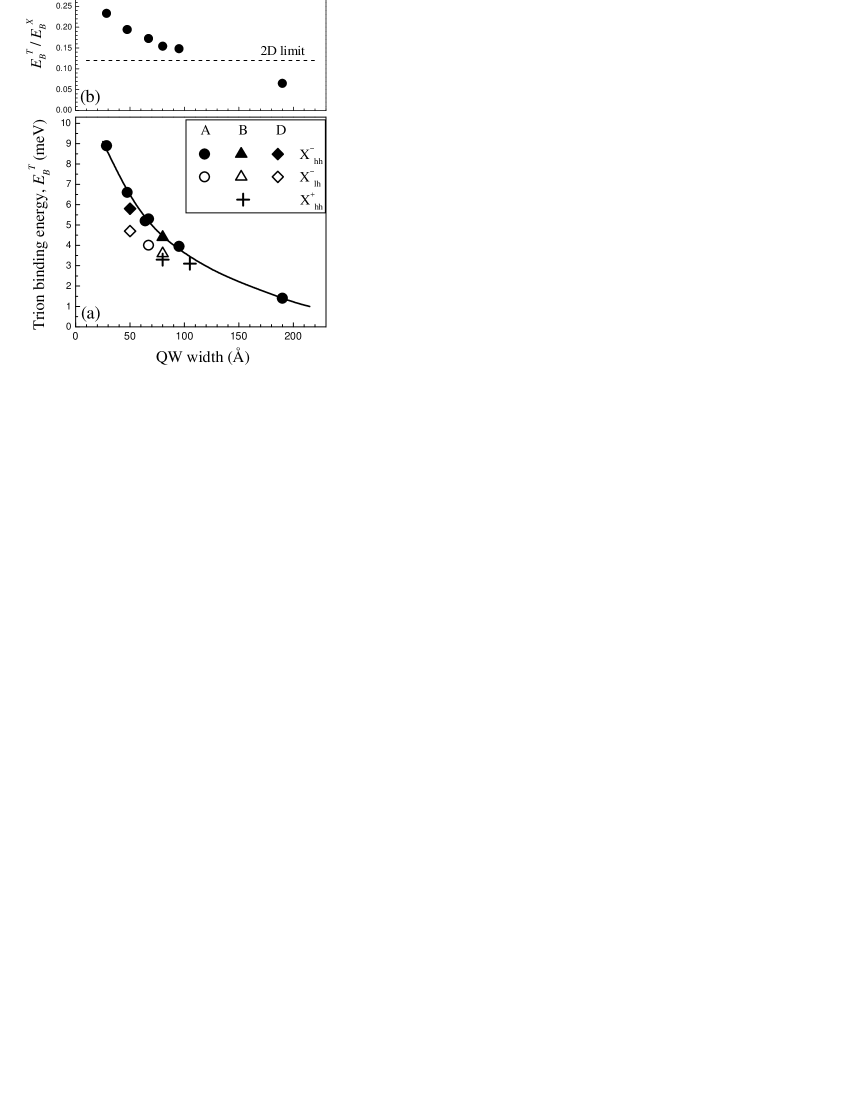
(b) Ratio of the binding energy to the binding energy of quasi-two-dimensional exciton taken from Fig. 5b. Theoretical value of =0.12 for a two-dimensional case is shown by a dashed line Stebe and Ainane (1989); Sergeev and Suris (2001).
| Exciton parameters | Trion binding energy | ||||||||
| QW | Exciton | Binding | (meV) | ||||||
| SAMPLE | Type | width | energy, | energy | |||||
| (Å) | (eV) | (meV) | (meV) | ||||||
| Calc.111From our calculation. | Calc.111From our calculation. | ||||||||
| cb1175 | A | 29 | 2.8910 | 31.0 | 38.2 | 8.9 | |||
| cb1173 | A | 48 | 2.8472 | 27.5 | 34.0 | 6.6 | |||
| cb1048 | A | 64 | 2.8277 | 24.0 | 25.0 | 31.2 | 5.2 | ||
| cb1041 | A | 67 | 2.8260 | 24.7 | 30.7 | 5.3 | 4.0 | ||
| cb1174 | A | 67 | 2.8258 | 24.7 | 30.7 | 5.3 | |||
| cb1198 | A | 95 | 2.8149 | 21.7 | 27.3 | 4.0 | |||
| cb1172 | A | 190 | 2.8057 | 16.5 | 21.5 | 1.4 | |||
| zq1038 | B | 80 | 2.8182 | 25.0 | 22.7 | 28.5 | 4.4 | 3.6 | 3.3 |
| zq1113 | B | 105 | 2.8129 | 20.6 | 26.1 | 3.1 | |||
| zq703 | C | 50 | 2.8260 | 22.5 | 22.7 | 28.6 | |||
| cb571 | D | 50 | 2.8280 | 22.8 | 29.2 | 5.8 | 4.7 | ||
We discuss first the data for the negatively charged excitons related to heavy-hole excitons. The line in Fig. 16a is an interpolation made for data points (solid symbols). The trion binding energy increases strongly from 1.4 meV in a 190 Å QW up to 8.9 meV in a 29 Å QW. The increase for is 6.4 times while the exciton binding energy increases only twice (see Fig. 5b). Stronger sensitivity of the trion binding energy to confinement conditions is due to the lager extension of the trion wave function and to the strong effect of reduction of dimensionality on the trion stability Stebe et al. (1997); Yassievich et al. (1999). Theoretical calculations show that trion states are very weakly bound in three-dimensional systems, which hinders their experimental observation in bulk semiconductors. Reduction of dimensionality from 3D to 2D is a crucial factor for increasing trion stability, and the trion binding energy grows by a factor of ten Stebe and Ainane (1989). We believe that increase of shown in Fig. 16a is dominated by localization of carrier wave functions along the structure growth axis, i.e. by the increasingly two-dimensional character of the carrier wave functions. Contribution of the in-plane localization of trions is minor except perhaps for the very narrow 29 Å QW. This conclusion is based on comparing the exciton linewidths (see Fig. 3), which gives us characteristic energies for the in-plane exciton localization, with the trion binding energies. Exciton linewidth is weakly sensitive to the QW width and is below 2 meV for the range 50-190 Å. It increases to 5.3 meV in the very narrow QW, but even in this case it stays smaller than the trion binding energy of 8.9 meV.
A detailed comparison of the trion and exciton modifications with decreasing QW width is given in Fig. 16b, where the ratio of the trion and the exciton binding energies is presented. For the 190 Å QW this ratio 0.065. It increases linearly with decreasing QW width achieving a value of 0.235 in the 29 Å QW. Theoretical calculations of this ratio performed for the two-dimensional limit give a value 0.12, which is rather insensitive to the ratio of electron and hole effective masses Stebe and Ainane (1989); Sergeev and Suris (2001). The experimental value for the 29 Å QW exceeds the theoretical limit by a factor of two. We explain this by the fact that our experimental situation corresponds to the quasi-2D case rather than to strictly 2D one. This is confirmed by the moderate increase of the exciton binding energy, which is twice as large as the bulk Rydberg in narrow QW’s and, respectively, twice as small as the 2D limit of four Rydbergs. A dimensional transition for a Coulombic state in QW structures is determined by a ratio of the Bohr radius of the states to the QW width. Obviously, for trions with larger Bohr radius this transition will happen in wider QW’s than for excitons, whose wave function is more compact. Thus at a given QW width, excitons and trions have different degrees of two-dimensionality, which causes a larger measured value of compared with the calculated value for the 2D limit.
It is interesting to note that the strength of confinement potentials in our structures plays a minor effect on the trion binding energies. Data points in Fig. 16a for structures with different materials with value varied from 200 to 250 meV follow the same dependence. Only a small deviation from this dependence was found for the type D structure with =70 meV. For very shallow 70 Å ZnSe/Zn(S,Se) QW’s with =25-35 meV a trion binding energy of 2.7-2.9 meV has been reported Homburg et al. (2000). This is consistent with our data from Fig. 16a and evidences that decreasing the electron confinement leads to smaller binding energies for .
We are aware of only one paper where the binding energies of were calculated for ZnSe-based QW’s Riva et al. (2000). The quantitative agreement was not satisfactory and authors suggested that the polaron effect, which in ZnSe QW’s could give an additional 1.3-2.6 meV contribution to the trion binding energy, should be considered. For our structures we found a relatively strong dependence of the exciton reduced mass on the QW width (see Fig. 4b). We believe that incorporating this factor into calculations will increase their reliability and coincidence with experiment. A.Esser has run calculation for 80 Å QW (zq1038) with our new parameters and got a value of 4.2 meV for which is in good coincidence with our experimental value of 4.4 meV even whithout introduction of the polaronic correction Esser .
Binding energies of trions based on the light-hole excitons (open symbols in Fig. 16a) are 20-30% smaller than the binding energies. To the best of our knowledge no detailed investigation of states has been reported so far. Trions associated with light-hole excitons were observed in PL excitation spectra of GaAs-based QW’s Finkelstein and Bar-Joseph (1995) and in the reflectivity spectra of monomolecular CdTe islands Taliercio et al. (1998). In both cases the binding energy was very close to that of . Numerical calculations performed for GaAs QW’s give, for example, a 40% difference in favor of in a 100 Å GaAs/Ga0.85Al0.15As QW Stebe et al. (1997). However, the model used in Ref. Stebe et al., 1997 has not accounted for the modification of the in-plane effective mass in the valence band which is essential for the quantitative comparison with experimental results.
It is interesting that positively charged excitons show binding energies reduced by about 25% compared with their negatively charged partners. E.g. in an 80 Å QW of type B (zq1038), binding energies for negatively- and positively charged excitons are 4.4 and 3.3 meV, respectively. We are very confident of this result, as it has been measured in the same structure (see Figs. 9 and 10) where the type of the free carriers occupying the QW was reversed by the illumination. Calculations performed for the 3D and 2D limits give the binding energy larger than the one Stebe and Ainane (1989); Sergeev and Suris (2001); this result is explained qualitatively by the heavier effective mass of holes compared to electrons. However, in the quasi-two-dimensional case the situation can differ qualitatively. Recent calculations performed by A. Esser with parameters of the structure zq1038 give 4.2 and 4.0 meV binding energies for and , respectively Esser . The smaller binding energy of the positively charged exciton is explained by the “effective” hole-hole Coulomb repulsion to be stronger in this QW than the electron-electron one. The calculations qualitatively reproduce experimental trends. Better quantitative agreement for state is still desired. Note that for GaAs QW’s identical binding energies for and have been reported Glasberg et al. (1999).
Comprehensive theoretical consideration for the trion binding energy data collected in Fig. 16a is still missing. We hope that these data and the set of exciton parameters given in the paper will encourage such activity.
V PROPERTIES OF SINGLET TRION STATES
The singlet state is the ground state of a trion except at very high magnetic fields where the triplet state gains larger binding energy. Recently the triplet states have attracted considerable attention in GaAs-based QW’s Vanhoucke et al. (2001); Yusa et al. and in ZnSe-based structures Yakovlev et al. (2001). However, we leave this topic outside the scope of the present paper and concentrate here on the properties of the singlet state.
V.1 Magnetic field dependence of binding energy
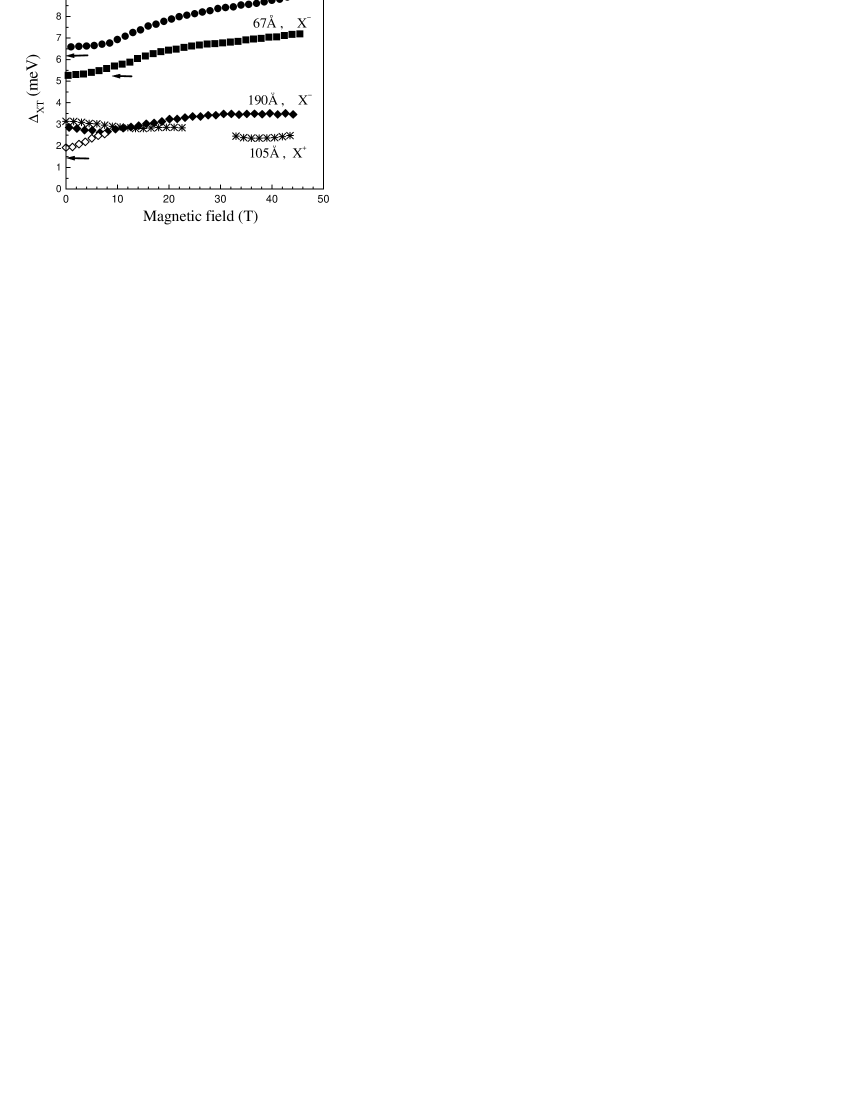
Energy distance between exciton and trion PL lines is plotted in Fig. 17 vs magnetic field strength. In order to avoid uncertainties caused by spin splittings, data for the center-of-gravity of exciton- and trion spin doublets are given. Our task is to study the binding energy of the “bare” trions which exhibit no contribution from the Fermi energy. The regime of the very diluted carrier gas is fulfilled for a 105 Å QW with , where at =0 T equals to (see Table 4). Similar statements can be made for 48 Å and 67 Å QW’s with . values for QW’s with are shown by arrows. Only in the case of the 190 Å QW was the contribution of the Fermi energy to considerable for the set of data measured in pulsed magnetic fields (shown by solid diamonds in Fig. 17). We have repeated measurements for this structure in dc magnetic fields 8 T keeping the low density of a 2DEG. Results are given by open diamonds. One can see that the difference between the two data sets vanishes with increasing magnetic fields and disappears for 7 T. That means that the contribution of decreases with growing magnetic fields, which can be explained by an increase of the density of states of the Landau levels. For the following discussion we consider the dependence for a 190 Å QW consisting of open diamonds at low fields and of solid diamonds at high fields (8 T).
Binding energies of in all studied QW’s show a monotonic increase with growing magnetic fields and a tendency to saturation in high fields 25 T. The increase is stronger in wider QW’s with smaller , e.g. it amounts to 150% in a 190 Å QW and has only 35% in a 48 Å QW. Being more compact in narrow QW’s the singlet state becomes less sensitive to compression by external magnetic fields. Qualitatively dependencies for from Fig. 17 are consistent with theoretical predictions for the singlet state Whittaker and Shields (1997); Vanhoucke et al. (2001); Yakovlev et al. (2001).
Magnetic field dependence of the positively charged exciton differs drastically from behavior. Binding energy of shows no dependence on magnetic fields for 6 T and decreases by 25% at higher fields (see stars in Fig. 17). In the field range 26-32 T the singlet state line shows irregular behavior caused by its crossing with the triplet state. These results will be published elsewhere and here, for clarity, we do not show data points for this field range. Principally different behavior of and states in external magnetic fields has been established first for GaAs QW’s Glasberg et al. (1999). Our results confirm this for ZnSe-based QW’s. We are not aware of theoretical attempts to model behavior in magnetic fields. However, it is clear that the difference in magnetic field behavior of and binding energies is due to the very different structure of wave functions of these complexes (see discussion in Ref. Sergeev and Suris, 2001). is constructed of two light particles (electrons) rotated around one heavy particle (hole). This complex has one center and magnetic field will localize the electron wave functions around the hole, thus inducing an increase of the binding energy. In contrast has two heavy particles, i.e. two centers, and one light particle moving between two centers. In this case shrinking of electron wave function by magnetic fields hinders it from optimal adjustment for two centers, which results in decreasing binding energy of complex.
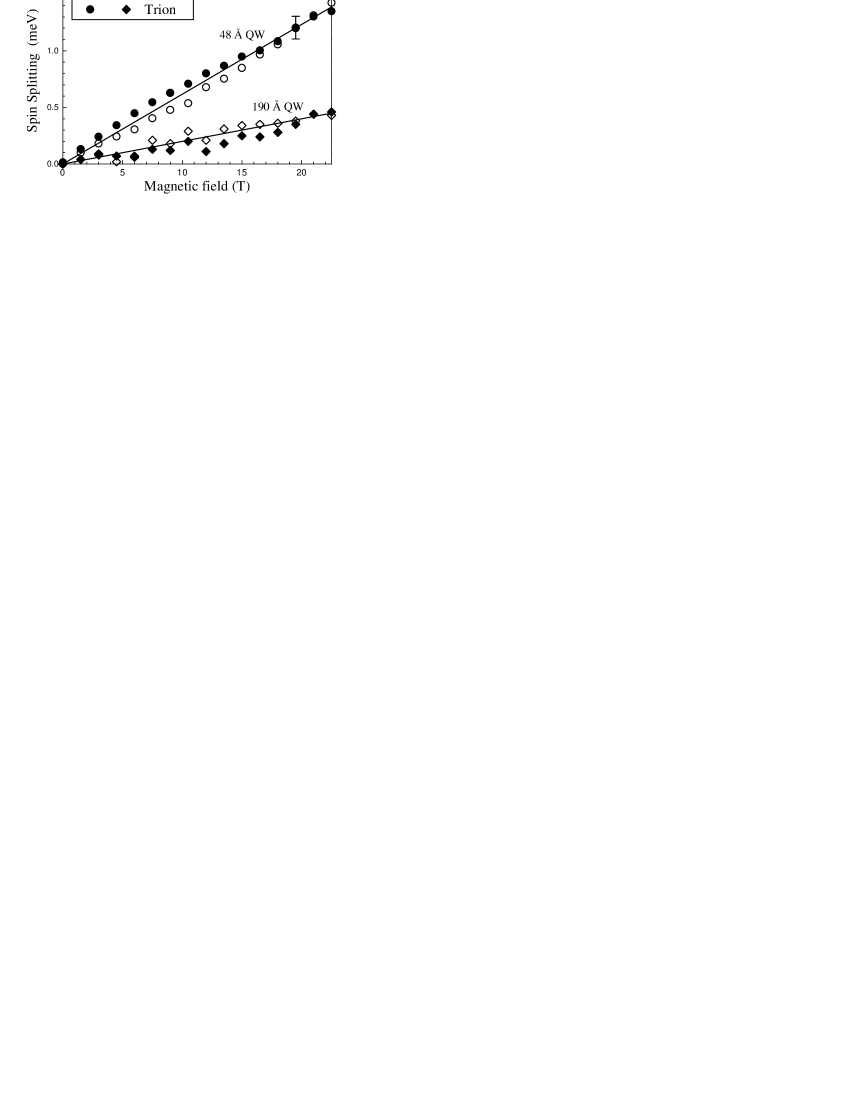
V.2 Spin splitting of trions
In the studied structures, the Zeeman splitting of the trion singlet state closely follows the behavior of the exciton Zeeman splitting. Typical examples for 48 and 190 Å ZnSe/Zn0.82Be0.08Mg0.10Se QW’s are given in Fig. 18. Deviations between exciton and trion splittings are inside the error bar of spectral resolution of 0.1 meV. This result is explained on the basis of a spin structure of trion and exciton states suggesting that the electron and hole wave functions in a trion are the same as in a neutral exciton (see e.g. Refs. Yakovlev et al., 2001; Vanhoucke et al., 2001). Indeed the ground state of the negatively charged exciton exhibits a hole spin splitting as the two electrons with antiparallel spin orientation are insensitive to external magnetic fields. However, the Zeeman splitting of the trion optical transition must also reflect the Zeeman contribution of the bare electron, which remains after trion recombination. As a result, the Zeeman splitting of is given by , which is identical to the exciton spin splitting. A similar consideration holds for the positively charged exciton.
Different spin splitting of excitons and trions has been reported for a 200 Å GaAs-based QW and related to a different mixing of wave functions in than in Glasberg et al. (1999). Also for ZnSe/Zn(S,Se) QW’s with small confinement potential 35 meV different spin splittings of exciton and negatively changed exciton have been found Homburg et al. (2000). We suppose that the small energy splitting between the heavy-hole and light-hole states in these structures allows mixing of these states in a trion, that is resulted in a modification of the hole g factor. In our structures was relatively large 11-20 meV (see Table 3) which prevents the modification of the hole g factor.
V.3 Oscillator strength of trions
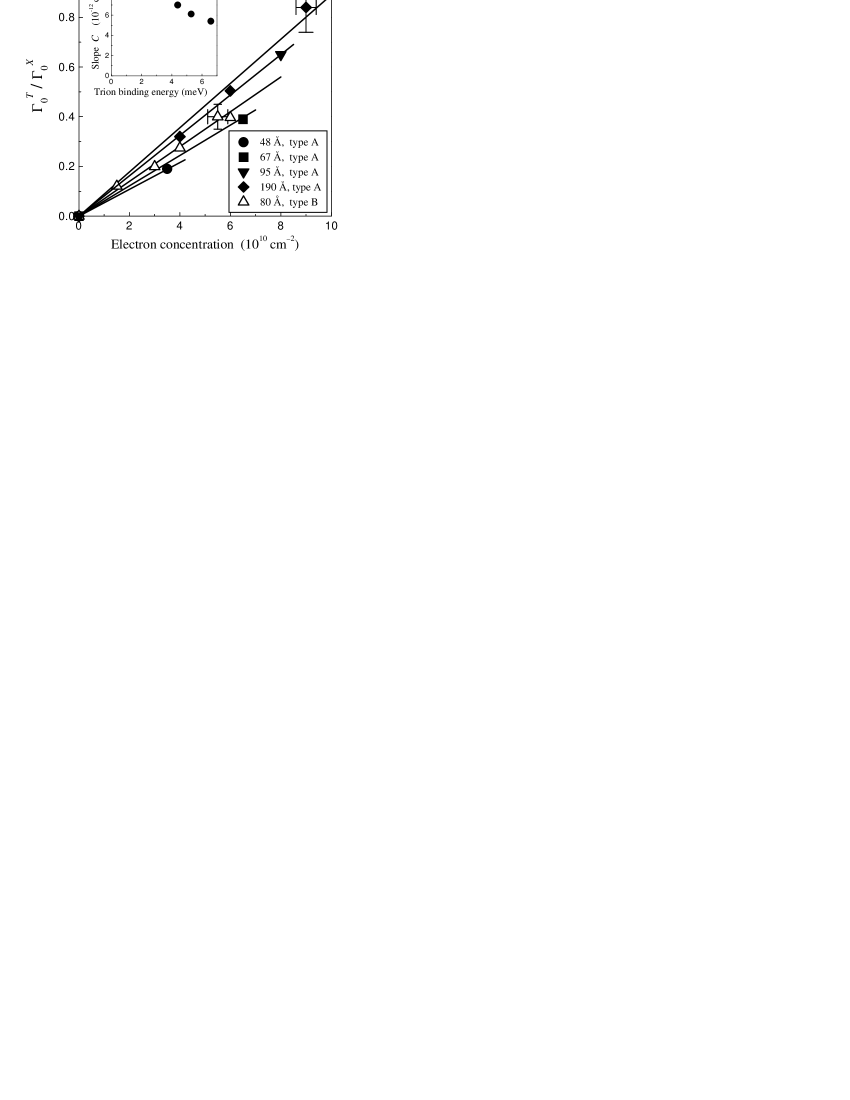
Treatment of resonances in reflectivity spectra allows extracting the oscillator strength (i.e. radiative damping of trions and excitons. A detailed study of the trion oscillator strength in an 80 Å ZnSe/Zn0.89Mg0.11S0.18Se0.82 QW can be found in Ref. Astakhov et al., 2000. It has been established experimentally that grows linearly with electron concentration . The value of is a very useful parameter for evaluation of the electron density by optical method Astakhov et al. .
In Fig. 19 is plotted as a function of for QW’s of different thickness. Electron concentration was evaluated from the polarization properties of in external magnetic fields (see e.g. Fig. 14). The value of the slope increases for wider QW’s with smaller binding energies of trions. This is illustrated in the inset of Fig. 19 where is plotted as a function of . Trions with the smallest binding energy have the largest extension of wave function, which covers the largest number of unit cells and, respectively, gives the largest value. Results from the inset of Fig. 19 confirm this conclusion. It is worthwhile to note that that these results also allow determination of a carrier density in ZnSe-based QW’s of various widths.
V.4 Trion Linewidth
We discuss here the linewidth of exciton and trion luminescence lines presented in Fig. 3. It was found that for QW’s thinner than 100 Å, the trion line is systematically broader than the exciton one. The difference in linewidths grows up to 60% in a 29 Å QW. At least two physical reasons for that can be suggested: (i) PL linewidth is contributed by localization energies for carriers. In the case of excitons it is summed up from the electron and hole contributions, where the electron plays a dominant role. In case of trions, two electrons and one hole participate. Qualitatively it should result in larger broadening, but the quantitative approach to this problem does not seems to be very trivial, because it will depend strongly on the choice of a model for localizing potential. (ii) Another reason is related to a certain freedom in the energy conservation law in case of the trion recombination. An electron, which is left after trion recombination, can have a finite kinetic energy. The energy of emitted photon will be reduced by this amount. Respectively, the trion line will exhibit additional broadening due to the electron kinetic energy.
The first mechanism has a strong dependence on the QW width - its contribution should increase proportionally with growing broadening of the exciton line. However, the character of the well width dependence for the second mechanism is not very obvious for us.
The second mechanism has been studied theoretically and experimentally for GaAs-based QW’s Esser et al. (2000). It was shown that it has a strong temperature dependence and at =2 K the additional broadening of the trion line is about 0.04 of the exciton binding energy. Applying this estimation to our QW’s we get the contribution of the second mechanism of 0.8 meV for a 190 Å QW and of 1.5 meV for a 29 Å QW. In the narrow QW, exciton and trion linewidths are 4 and 6.5 meV, respectively, i.e. they differ by 2.5 meV. From this we suggest that both mechanisms have comparable contribution to the broadening of the trion emission line. Further experiments including the careful analysis of the temperature dependencies of the trion linewidth are required to separate the role of two mechanisms.
VI CONCLUSIONS
Negatively and positively charged excitons in ZnSe-based QW’s were investigated in structures with various QW widths and free carrier densities. The binding energy of shows a strong dependence on the QW width, increasing from 1.4 to 8.9 meV as the well width decreases from 190 to 29 Å. This variation is 6.4 times while the neutral exciton binding energy increases only twice. The binding energy of is 25% smaller than that of . This observation is in qualitative agreement with model calculations and is explained by stronger “effective” Coulomb repulsion in case of hole-hole interaction compared with electron-electron interaction. Qualitatively different behavior for and is found in external magnetic fields. increases its binding energy depending on the QW width by 35-150%, while in contrast shows a decrease of its binding energy by 25%. A detailed set of exciton parameters for the studied structures is collected in the paper. We hope that this will encourage theoretical efforts for better understanding the energy- and spin structure of trions.
Acknowledgements.
We acknowledge stimulating discussions with A. B. Dzyubenko and R. A. Suris. We are thankful to A. Esser for allowing us to use in this paper his unpublished results on calculation of trion binding energies. The work was supported in part by the Deutsche Forschungsgemeinschaft through Sonderforschungbereich 410 and grant Nos. Os98/6, 436 RUS 113/557 and He-1939/16-1, as well as by grants of the Russian Foundation for Basic Research (grants Nos. 00-02-04020 and 01-02-04010) We feel deep sorrow at the death of our colleague W. Faschinger, who was an outstanding scientists and very kind person.References
- Lampert (1958) M. A. Lampert, Phys. Rev. Lett. 1, 450 (1958).
- Kheng et al. (1993) K. Kheng, R. T. Cox, Y. M. d’Aubigne, F. Bassani, K. Saminadayar, and S. Tatarenko, Phys. Rev. Lett. 71, 1752 (1993).
- Cox et al. (1998) R. T. Cox, V. Huard, K. Kheng, S. Lovisa, R. B. Miller, K. Saminadayar, A. Arnoult, J. Cibert, S. Tatarenko, and M. Potemski, Acta Phys. Pol. A 94, 99 (1998).
- Glasberg et al. (1999) S. Glasberg, G. Finkelstein, H. Shtrikman, and I. Bar-Joseph, Phys. Rev. B 59, R10425 (1999).
- Astakhov et al. (1999) G. V. Astakhov, D. R. Yakovlev, V. P. Kochereshko, W. Ossau, J. Nürnberger, F. Faschinger, and G. Landwehr, Phys. Rev. B 60, R8485 (1999).
- Crooker et al. (2000) S. A. Crooker, E. Johnston-Halperin, D. D. Awschalom, R. Knobel, and N. Samarth, Phys. Rev. B 61, R16307 (2000).
- Kheng et al. (1994) K. Kheng, R. T. Cox, V. P. Kochereshko, K. Saminadayar, S. Tatarenko, F. Bassani, and A. Franciosi, Superlattices and Microstructures 15, 253 (1994).
- Ossau et al. (1998) W. Ossau, D. R. Yakovlev, U. Zehnder, G. V. Astakhov, A. V. Platonov, V. P. Kochereshko, J. Nürnberger, F. Faschinger, M. Keim, A. Waag, et al., Physica B 256-258, 323 (1998).
- Lovisa et al. (1998) S. Lovisa, R. T. Cox, T. Baron, M. Keim, A. Waag, and G. Landwehr, Appl. Phys. Lett. 73, 656 (1998).
- Ivanov et al. (1999) V. Y. Ivanov, M. Godlewski, J. P. Bergman, B. Monemar, M. Behringer, and D. Hommel, Proc. 24th Int. Conf. on the Physics of Semiconductors, Jerusalem, Israel 1998 (World Scientific, Singapore, 1999), ed. by D. Gershoni, published on CD.
- Homburg et al. (2000) O. Homburg, K. Sebald, P. Michler, J. Gutowski, H. Wenisch, and D. Hommel, Phys. Rev. B 62, 7413 (2000).
- Yakovlev et al. (2001) D. R. Yakovlev, G. V. Astakhov, W. Ossau, S. A. Crooker, K. Uchida, N. Miura, A. Waag, N. A. Gippius, A. Y. Sivachenko, and A. B. Dzyubenko, Phys. Stat. Sol. (a) 227, 353 (2001).
- Yakovlev et al. (2000a) D. R. Yakovlev, H. A. Nickel, B. D. McCombe, A. Keller, G. V. Astakhov, V. P. Kochereshko, W. Ossau, J. Nürnberger, F. Faschinger, and G. Landwehr, J. Crystal Growth 214-215, 823 (2000a).
- Yakovlev et al. (2000b) D. R. Yakovlev, J. Puls, G. V. Mikhailov, G. V. Astakhov, V. P. Kochereshko, W. Ossau, J. Nürnberger, F. Faschinger, F. Henneberger, and G. Landwehr, Phys. Stat. Sol. (a) 178, 501 (2000b).
- Wagner et al. (1999) H. P. Wagner, H. P. Tranitz, and R. Schuster, Phys. Rev. B 60, 15542 (1999).
- Astakhov et al. (2000) G. V. Astakhov, V. P. Kochereshko, D. R. Yakovlev, W. Ossau, J. Nürnberger, F. Faschinger, and G. Landwehr, Phys. Rev. B 62, 10345 (2000).
- Riva et al. (2000) C. Riva, F. M. Peeters, and K. Varga, Phys. Rev. B 61, 13873 (2000).
- Lozykowski and Shastri (1991) H. J. Lozykowski and V. K. Shastri, J. Appl. Phys. 69, 3235 (1991).
- Asai and Oe (1983) H. Asai and K. Oe, J. Appl. Phys. 54, 2052 (1983).
- König et al. (1999) B. König, U. Zehnder, D. R. Yakovlev, W. Ossau, T. Gerhard, M. Keim, A. Waag, and G. Landwehr, Phys. Rev. B 60, 2653 (1999).
- Miyajima et al. (1995) T. Miyajima, F. P. Logue, J. F. Donegan, J. Hegarty, H. Okuyama, A. Ishibashi, and Y. Mori, Appl. Phys. Lett. 66, 180 (1995).
- Ishibashi (1996) A. Ishibashi, J. Crystal Growth 159, 555 (1996).
- Shahzad et al. (1995) K. Shahzad, J. Petruzzello, J. M. Gaines, and C. Ponzoni, Appl. Phys. Lett. 67, 659 (1995).
- Landolt-Börnstein (1999) Landolt-Börnstein, II-IV and I-VI Compounds; Semimagnetic Compounds, vol. III/41B of New Series (Springer, Berlin, Heidelberg, 1999), ed. by U. Rössler.
- Ohyama et al. (1988) T. Ohyama, K. Sakakibara, E.Otsuka, M.Isshiki, and K. Igaki, Phys. Rev. B 37, 6153 (1988).
- Hölscher et al. (1985) H. W. Hölscher, A. Nöthe, and C. Uihlein, Phys. Rev. B 31, 2379 (1985).
- Okuyama et al. (1994) H. Okuyama, Y. Kishita, T. Miyajima, A. Ishibashi, and K.Akimoto, Appl. Phys. Lett. 64, 904 (1994).
- Okuyama et al. (1998) H. Okuyama, Y. Kishita, and A. Ishibashi, Phys. Rev. B 57, 2257 (1998).
- Litz et al. (1996) M. T. Litz, M. Korn, H. Ress, U. Lunz, W. Ossau, A. Waag, G. Landwer, K. Watanabe, T. Walter, B. Neubauer, et al., J. Crystal Growth 159, 54 (1996).
- Wilmers et al. (1999) K. Wilmers, T. Wethkamp, N. Esser, C. Cobet, W. Richter, M. Cardona, V. Wagner, H. Lugauer, F. Fischer, T. Gerhard, et al., Phys. Rev. B 59, 10071 (1999).
- Vegard (1921) L. Vegard, Z. Phys. 5, 17 (1921).
- Crooker et al. (1999) S. A. Crooker, D. G. Rickel, S. K. Lyo, N. Samarth, and D. D. Awschalom, Phys. Rev. B 60, R2173 (1999).
- Gippius et al. (1998) N. A. Gippius, A. L. Yablonskii, A. B. Dzyubenko, S. G. Tikhodeev, L. V. Kulik, V. D. Kilakovskii, and A. Forchel, J. Appl. Phys. 83, 5410 (1998).
- Sirenko et al. (1997) A. A. Sirenko, T. Ruf, M. Cardona, D. R. Yakovlev, W. Ossau, A. Waag, and G. Landwehr, Phys. Rev. B 56, 2114 (1997).
- Kiselev et al. (1998) A. A. Kiselev, E. L. Ivchenko, A. A. Sirenko, T. Ruf, M. Cardona, D. R. Yakovlev, W. Ossau, A. Waag, and G. Landwehr, J. Crystal Growth 184-185, 831 (1998).
- Wolverson et al. (1999) D. Wolverson, J. J. Davies, C. L. Orange, K. Ogata, S. Fujita, K. Nakano, H. Okuyama, S. Itoh, B. Jobst, and D. Hommel, Phys. Rev. B 60, 13555 (1999).
- Davies et al. (2000) J. J. Davies, D. Wolverson, I. J. Griffin, O. Z. Karimov, C. L. Orange, D. Hommel, and M. Behringer, Phys. Rev. B 62, 10329 (2000).
- Naumov et al. (1995) A. Naumov, D. Mi, M. Sturge, W. Ge, L. S. Dang, H. Mariette, and N. Magnea, J. Appl. Phys. 78, 1196 (1995).
- Shields et al. (1995) A. J. Shields, J. L. Osborne, M. Y. Simmons, M. Pepper, and D. R. Ritchie, Phys. Rev. B 52, R5523 (1995).
- Kossacki et al. (1999) P. Kossacki, J. Cibert, D. Ferrand, Y. M. d’Aubigne, A. Arnoult, A. Wasiela, S. Tatarenko, and J. A. Gaj, Phys. Rev. B 60, 16018 (1999).
- (41) G. V. Astakhov, V. P. Kochereshko, D. R. Yakovlev, W. Ossau, J. Nürnberger, F. Faschinger, G. Landwehr, T. Wojtowicz, G. Karczewski, and J. Kossut, submitted to Phys. Rev. B.
- Huard et al. (2000) V. Huard, R. T. Cox, K. Saminadayar, A. Arnoult, and S. Tatarenko, Phys. Rev. Lett. 84, 187 (2000).
- Suris et al. (2001) R. A. Suris, V. P. Kochereshko, G. V. Astakhov, D. R. Yakovlev, W. Ossau, J. Nürnberger, F. Faschinger, G. Landwehr, T. Wojtowicz, G. Karczewski, et al., Phys. Stat. Sol. (a) 227, 343 (2001).
- Stebe and Ainane (1989) B. Stebe and A. Ainane, Superlattices and Microstructures 5, 545 (1989).
- Sergeev and Suris (2001) R. A. Sergeev and R. A. Suris, Phys. Solid State 43, 746 (2001), [Fizika Tverdogo Tela 43, 714 (2001)].
- Stebe et al. (1997) B. Stebe, G. Munschy, L. Stauffer, F. Dujardin, and J. Murat, Phys. Rev. B 56, 12454 (1997).
- Yassievich et al. (1999) I. N. Yassievich, V. M. Chistyakov, and V. P. Kochereshko, Proc. 24th Int. Conf. on the Physics of Semiconductors, Jerusalem, Israel 1998 (World Scientific, Singapore, 1999), ed. by D. Gershoni, published on CD.
- (48) A. Esser, private communication.
- Finkelstein and Bar-Joseph (1995) G. Finkelstein and I. Bar-Joseph, Nouvo Cimento D 17, 1239 (1995).
- Taliercio et al. (1998) T. Taliercio, P. Lefebvre, V. Calvo, D. Scalbert, N. Magnea, H. Mathieu, and J. Allegre, Phys. Rev. B 58, 15408 (1998).
- Vanhoucke et al. (2001) T. Vanhoucke, M. Hayne, M. Henini, and V. V. Moshchalkov, Phys. Rev. B 63, 125331 (2001).
- (52) G. Yusa, H. Shtrikman, and I. Bar-Joseph, 27 March 2001 (unpublished), eprint cond-mat/0103561.
- Whittaker and Shields (1997) D. M. Whittaker and A. J. Shields, Phys. Rev. B 56, 15185 (1997).
- Esser et al. (2000) A. Esser, E. Runger, R. Zimmermann, and W. Langbein, Phys. Rev. B 62, 8232 (2000).