Self-organized criticality in a model of collective bank bankruptcies
Abstract
The question we address here is of whether phenomena of collective bankruptcies are related to self-organized criticality. In order to answer it we propose a simple model of banking networks based on the random directed percolation. We study effects of one bank failure on the nucleation of contagion phase in a financial market. We recognize the power law distribution of contagion sizes in 3d- and 4d-networks as an indicator of SOC behavior. The SOC dynamics was not detected in 2d-lattices. The difference between 2d- and 3d- or 4d-systems is explained due to the percolation theory.
Keywords: econophysics, Monte Carlo, randomly directed percolation, business failure
I Introduction
In recent years, physicists have intensively studied economic and social systems composed of many mutually interacting parts Levy et al. (2000); Mantegna and Stanley (1999); Bouchaud and Potters (2000); Sornette (2000). The methods borrowed from physics provided a better understanding of such phenomena like crashes in a stock market Sornette and Johansen (1998), occurrence of extremely large market shares Solomon et al. (2000), and emergence of totalitarianism in democratic societies Galam (1999); Hołyst et al. (2001); Kacperski and Hołyst (2000, 1996). Like many other economic phenomena, collective bankruptcies arise from the complex nature of financial and capital markets Aleksiejuk and Hołyst (2001); Rochet and Tirole (1996); Angelini (1996); Iori and Jafarey (2001). Here we focus on one of the most extreme examples of systemic failure, namely bank bankruptcies. We use banking terminology following our previous studies on interbank markets Aleksiejuk and Hołyst (2001), but the proposed model is general enough to describe many other types of collective failures.
As emphasized in Iori and Jafarey (2001), the history of modern banking is full of examples of systemic failures at both moderate and large scales. Perhaps most of the readers are familiar with anecdotal accounts of the Great American Depression of 1929, or those of the 1997 East Asian crisis. On the other hand, very few people noticed financial troubles of Bank Śla̧ski a few years ago in Poland. What is the reason behind the fact that one bankruptcy triggers off an avalanche of further failures while other does not?
II Banking reality and network model
There are two main characteristics describing financial weakness of a bank: liquidity and solvency. Liquidity is the ability to pay short-term commitments on time, whereas solvency encompasses all commitments. Loss of solvency is a sufficient condition for bankruptcy and loss of liquidity is its necessary condition, respectively. Banks face shortfalls and surpluses of money resulting from imbalances between revenues and expenses. This additional or lacking money may be balanced via interbank lending. In this way interbank lending prevents banks from the loss of liquidity.
At present, interbank market is an important element of money market. In most of interbank markets the mean transaction period is shorter than one month and still shortening. Moreover, the total amount of money in interbank lending transactions exhibits a growing tendency. Banks are willing to invest their money into interbank market because it is considered to bear the lowest risk, so that the lowest obligatory reserves have to be created for the given credits. Examining the Polish data Zatryb (1994) we see that the average equity capital of a standard Polish bank amounts to about ten percent of all liabilities. The same statistics report that the average value of assets located in interbank market is close to fifteen percent. Regulations concerning bankruptcy, which are common for almost all financial systems, define the bankruptcy condition as a loss of fifty percent of equity capital.
The numbers quoted show that interbank transactions constitute an important component of banking assets as well as liabilities Angelini (1996); Rochet and Tirole (1996); Zatryb (1994). Single bankruptcies, through the network of credit and debt relationships, may seriously threaten the entire banking system.
In our model vertices on a lattice of the linear size which for the simplicity has a regular symmetry (square, cubic or 4d-hypercubic), represent banks. Directed junctions may be dynamically formed between neighboring nodes. These directed connections simulate flows of money (interbank transactions, loans and credits). The paper follows our model of mass bankruptcies based on the random directed percolation Aleksiejuk and Hołyst (2001). In comparison to previous work, the major development of the present model is the implementation of the concept of banking balance, which when positive, can be invested to make profits, but when negative, must be refilled to prevent the loss of liquidity. The next feature distinguishing the proposed model from the previous one, where a constant concentration of interbank connections was assumed, is assigning time-dependent weights to directed connections (i.e. credits) and vertices (i.e. banking capitals).
The dynamical rules governing the temporal evolution of the model are as follows:
-
•
Initially all banks are ’balanced’. During the following time steps each bank , with equal probability, experiences shortfalls or surpluses of money denoted by (for simplicity ). After time the banking capital amounts to .
-
•
At each time step banks with surpluses () tend to invest their money, whereas banks with shortfalls () want to replenish their resources in order to maintain liquidity. The best place to realize both aims is the interbank market. During trading, banking capital is redistributed within the nearest neighborhood of a bank i.e. interbank financial transactions (loans and credits) arise. If a -bank owes money to an -bank we denote the amount of the debt by . It follows that , where denotes the weight of connection between the pair of neighbors and expresses unbalanced money inside the bank .
-
•
If a bank has borrowed money in the past period (), its priority is to repay its creditors. Such a bank when having a surplus () will intend it for the payment of debts. On the other hand, a lender-bank () when having a short-lived liquidity troubles ( and ) will collect money from its debtors to eliminate a temporary financial problems.
-
•
Bank goes bankrupt for either of the two reasons:
-
–
because of the loss of solvency, when its capital falls below the ’solvency threshold’ , or
-
–
because of the loss of liquidity, when unbalanced money inside a bank exceeds the ’liquidity threshold’ where .
-
–
-
•
Lender-banks that have given credits to a bankrupt lose their money. We assume that these banks become ’infected’ and they attempt to secure their positions by collecting their money from the debtors. The borrower-banks that have to repay incurred debts are also assumed as ’infected’. These banks propagate infection to their further uninfected lenders. The effect of contagion transmission by infected borrower-bank is related to the situation when a lender having a contact with an infected debtor wants to protect itself against losses and tries to collect given credits. In this way, a bankruptcy of a single bank may initiate an avalanche of bank failures similarly to the domino effect well known in social and economic modeling.
-
•
When the avalanche stops, new balanced banks () are created to replace the failed ones.
The above dynamical rules of the model become comprehensible after examining Fig. 1 which presents an example of a banking network on the square lattice of size .
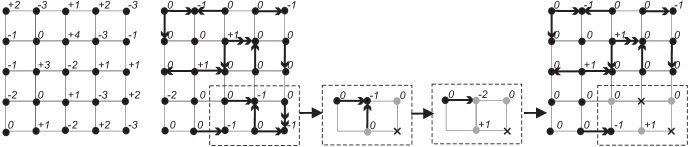
For simplicity we denote a bank located in the row and in the column by the subscript . The figure was generated under the following assumptions: , , . A random set of variables as an initial condition was assumed. There is no interbank market at the first stage of the figure. Effects of interbank trading appear at the second stage. Arrows with single or double arrowheads correspond to or respectively. After trading, the interbank market is almost balanced. Only one failure resulting from the loss of liquidity happened (the bank ). However because there were no commitments of this bank to its neighbours thus this bank failure did not lead to further network contagion. Let us now assume that the last bank () faces a shortfall () in the next time step (our model is governed by asynchronous dynamics). This forces its immediate bankruptcy due to the loss of solvency (). The failure infects two other banks with numbers and respectively. Since the bank tries to collect the credit given to bank it forces its failure according to the liquidity condition. The second bankruptcy infects the bank. In this way the contagion process originating from the node triggers off a small avalanche of two failures within the cluster of five ’infected’ / failed banks.
III Computer simulations and results
We investigated effects of a single bank failure on the nucleation of contagion phase in the banking network. The simulations were done for square, cubic and 4d-hypercubic lattices. Although one could expect similar results for all dimensions, we observe a noticeable difference in behavior. The distribution of infection area in the networks based on square lattice is exponential (Fig.2), whereas the same dynamical rules in four-dimensional hypercubic lattices generate power law distributions (Fig.4). The fact that the contagion in two-dimensional systems is characterized by exponentially decaying distribution of stopping times indicates subcritical behavior. For 4d-hypercubic lattices, the contagion process may continue infinitely as the result of long-range spatial and temporal correlations between the participants of the interbank market. Three-dimensional cubic lattices described by different combinations of the system parameters ( and ) exhibit a continuous transition from sub-critical to critical behavior of the model (Fig.3).


These differences can be explained as follows. The expansion of the infection area corresponds to avalanches of random directed percolation. On square lattices, the neighborhood of each vertex consists of only four vertices. In terms of our model, it means that the average number of potential financial partners of a bank (neighbors whose banking capital has an opposite sign) equals to two. Given the above considerations, we conclude that the average concentration of interbank connections should not exceed fifty percent of all possible links in the lattice (). The random directed percolation threshold satisfies on square lattices Aleksiejuk and Hołyst (2001). Comparing two parameters makes it clear that two-dimensional banking networks always remain in the sub-critical region of the percolation phase transition. On 4d-hypercubic lattices, the threshold amounts to while . For this reason the four-dimensional interbank market driven by threshold dynamics of the participants can balance at the edge of percolation phase transition in a self-organized critical state almost regardless of the system parameters values. On the other hand the three-dimensional percolation threshold is only slightly smaller than the maximum concentration of interbank connections . Tuning the solvency threshold with the fixed liquidity parameter shows that although the 3d-model tends to the self-organized critical dynamics, for certain combinations of system parameters ( and ) the double security system consisting of liquidity and solvency monitoring keeps it in the sub-critical region (Fig.3).
We interpret the power law (free-scale) distributions of failure sizes in 3d-cubic and 4d-hypercubic lattices as a symptom of self-organized critical behavior of the model. The slopes of the histograms approach the same value in both cases. Despite these reasonable power-laws indicating SOC dynamics, some non-equilibrium effects in the model are not yet understood. Large systems in higher dimensions are particularly sensitive to these effects.
To understand the SOC phenomenon on the microscopic level one needs to consider the dynamical character of the system parameter . In fact there are two competing processes that increase or decrease the mean number of interbank connections .
- A.
-
Due to the random character of the stochastic variable and the random selection of a financial partners from the nearest neighbors, the number of interbank connections is growing up.
- B.
-
Due to collective bankruptcies the number of interbank connections is falling down because new banks that replace bankrupts are not involved in the interbank market at the beginning of their activity.
If the value of is below the percolation threshold then the mean size of contagion cluster is small and the process overcomes the process . It follows that in the course of time the number of interbank connections is growing up driving the system to the critical state. If the value of exceeds a critical value (the percolation threshold) then a large contagion cluster spreading all over the system can appear. As a result a lot of banks that were involved in the network of interbank transactions face bankruptcy. The process overcomes the process and the parameter is diminishing.
IV Discussion
The model presented here relates the phenomena of collective bankruptcies in banking networks to the self-organized dynamics driving the system towards the critical point. Although a similar effect of power law scaling of collective bank failures was partially discussed in Aleksiejuk and Hołyst (2001); Iori and Jafarey (2001), the previous approaches were related to externally controlled critical parameters and did not translate into terms of self-organized criticality. In the present model, due to the inclusion of more realistic assumptions concerning the interbank market the connectivity parameter can oscillate at the edge of the phase transition. At this point we would like to stress, that however we abstract from details of banking mechanisms and encompass all of them in only one parameter (the unit balance ) thanks to this simplification, the model becomes more comprehensible and gains universality.
One could imagine a number of further extensions of the model. Since the real banking networks do not possess any regular symmetry it would be instructive to analyze the model from the point of view of the random graph architecture. The model introduced here bases on the assumption of a fixed number of nearest neighbors. The above situation is not observed in reality but as our results emphases, the artificial lowering of the dimensionality of the network keeps the model in the subcritical state. Since in the four-dimensional network, the double security system consisting of liquidity and solvency monitoring does not bring any effective control of the whole network security, the control should be established over the number of debtors or amounts of the credits.
Acknowledgements.
We are grateful to Prof. Dietrich Stauffer for the critical reading of this manuscript and for making the Crey-T3E from Jülich Supercomputer Center available to numerical tests. Two of us (AA and JH) are thankful to Prof. Dirk Helbing for his hospitality during the stay in Dresden. The work has been in part supported by the ALTANA AG due to the Herbert Quandt-Programm and by the DAAD.References
- Levy et al. (2000) H. Levy, M. Levy, and S. Solomon, Microscopic Simulation of Financial Markets (Wiley, 2000).
- Mantegna and Stanley (1999) R. N. Mantegna and H. E. Stanley, An Introduction to Econophysics (Cambridge University Press, 1999).
- Bouchaud and Potters (2000) J. P. Bouchaud and M. Potters, Theory of Financial Risks (Wiley, 2000).
- Sornette (2000) D. Sornette, Critical Phenomena in Natural Sciences (Springer, 2000).
- Sornette and Johansen (1998) D. Sornette and A. Johansen, Physica A 261, 581 (1998).
- Solomon et al. (2000) S. Solomon, G. Weisbuch, L. de Arcangelis, N. Jan, and D. Stauffer, Physica A 277, 239 (2000).
- Galam (1999) S. Galam, Physica A 274, 132 (1999).
- Hołyst et al. (2001) J. A. Hołyst, K. Kacperski, and F. Schweitzer, Annual Review of Comput. Phys. 9, 253 (2001).
- Kacperski and Hołyst (2000) K. Kacperski and J. A. Hołyst, Physica A 287, 631 (2000).
- Kacperski and Hołyst (1996) K. Kacperski and J. A. Hołyst, J. Stat. Phys. 84, 169 (1996).
- Aleksiejuk and Hołyst (2001) A. Aleksiejuk and J. A. Hołyst, Physica A 299, 198 (2001).
- Rochet and Tirole (1996) J. C. Rochet and J. Tirole, Journal of Money, Credit and Banking 28, 733 (1996).
- Angelini (1996) P. Angelini, Journal of Banking and Finance 20, 853 (1996).
- Iori and Jafarey (2001) G. Iori and S. Jafarey, Physica A 299, 205 (2001).
- Zatryb (1994) G. Zatryb, Financial market in Poland (in Polish) (Biblioteka Menedzera i Bankowca, 1994).