Structural phase control of (La1.48Nd0.40Sr0.12)CuO4 thin films by epitaxial growth technique
Abstract
Epitaxial growth of (La1.48Nd0.40Sr0.12)CuO4 thin films was studied by pulsed-laser deposition technique on three different substrates, SrTiO3 (100), LaSrAlO4 (001), and YAlO3 (001). The (Nd,Sr,Ce)2CuO4-type structure appears at the initial growth stage on SrTiO3 (100) when the film is deposited under the growth conditions optimized for (La,Sr)2CuO4. This (Nd,Sr,Ce)2CuO4-type structure can be eliminated by increasing the substrate temperature and the laser repetition frequency. Films on LaSrAlO4 (001) maintain a La2CuO4-type structure as bulk samples, but those on YAlO3 (001) show phase separation into La2CuO4- and Nd2CuO4-type structures. Such complicated results are explained in terms of the competition between lattice misfit and thermodynamic conditions. Interestingly the films with La2CuO4-type structure prepared on SrTiO3 and LaSrAlO4 show different surface structures and transport properties. The results indicate the possibility of controlling charge stripes of (La1.48Nd0.40Sr0.12)CuO4 as was demonstrated in (La,Ba)2CuO4 thin films by Sato et al. (Phys. Rev. B 62, R799 (2000)).
pacs:
74.72.Jt, 74.76.Bz, 74.80.DmI Introduction
One of the current issues of high-temperature (high-) superconductivity is the formation of the stripe phase. Since the discovery of one-dimensional modulations of static spin and charge order in (La2-x-yNdySrx)CuO4 (LNSCO) crystals, [1] the relationship between the crystal structure and the stripe has been intensively studied. [2] Thin-film samples have a great advantage in the study of this issue, because one can modify the lattice parameters from those of bulk samples through an epitaxial growth technique. Sato and Naito[3] and Locquet et al.[4] have shown that in-plane compression of the crystal significantly increases of (La2-xSrx)CuO4 (LSCO) films grown on a LaSrAlO4 (001) substrate. More surprisingly, the films on LaSrAlO4 (001) do not exhibit the anomalous suppression of at a carrier concentration of 0.12 which has been studied for a decade as a 1/8 problem. The recovery of superconductivity has already been confirmed in LSCO and (La2-xBax)CuO4 films. [5, 6] Nevertheless, it is important to study this issue using LNSCO thin films, because LNSCO is the only composition in which the static charge order has been confirmed experimentally. [7] In this paper, I report the detailed growth conditions of LNSCO thin films on several substrates. In contrast to the case of LSCO and LBCO, the presence of Nd ions requires more careful adjustment of growth conditions, because one must pay attention to three different phases.
II Sample Preparation
All the films were prepared by pulsed laser deposition (PLD). A KrF ( = 248 nm) excimer laser was used with an energy density of approximately 1.5 J/cm2. In order to optimize the growth condition, I focused on the substrate temperature () and the growth rate, which is controlled by changing the laser repetition rate (). A typical growth rate per pulse is about 0.5 Å. Because of the absence of any report on LNSCO-film growth, the reported growth conditions of LSCO films were used as the the starting point for this study. According to the previous literature [8, 9] typical values of for LSCO films are around 750 780∘C. As will be shown later, however, LNSCO film requires a higher substrate temperature than LSCO films. A target with a chemical composition of La:Nd:Sr:Cu = 1.48:0.40:0.12:1.00, which is the same composition as that reported in Ref. [1], was prepared by a conventional solid-state reaction method. Oxidation was carried out with a mixture gas of O2 and O3; total pressure () was held at approximately 3.9 Pa (30 mTorr) and the partial pressure of O3 was held at approximately 5.0 10-3 Pa during the deposition. After the deposition, total pressure was increased to 26.3 Pa (200 mTorr) without changing the partial pressure of O3, and films were annealed under this condition for 30 min. Oxidation was terminated when the films had cooled to 200∘C. All the growth conditions and grown phases are summarized in Table I, in which the main and secondary phases are shown.
III Results and Discussion
A , , and ’ phases
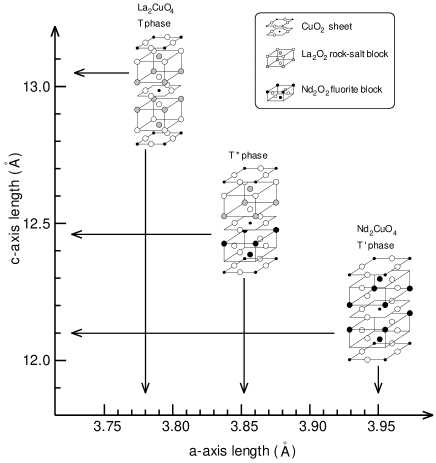
It is useful to describe the crystal structures before showing the experimental results. Figure 1 shows the schematic crystal structure of three CuO4-type (: lanthanoid) compounds: , , and ’ phases. The rock-salt (La2O2) and fluorite (Nd2O2) blocks are inserted between adjacent CuO2 sheets, in the case of and ’ phases, respectively. [10] Singh et al. reported that Nd substitution for La in La2CuO4 causes a phase transition from the to the ’ phase in accordance with the continuous decrease of ionic radius of the La-site element. [11] For the phase, these two blocks are alternately inserted between the adjacent CuO2 planes. In a bulk sample, it is believed to be necessary to perform complicated substitution to obtain the -phase structure. For example, in the first -phase superconductor (Nd,Sr,Ce)2CuO4, Sr2+ ions in the rock-salt block are partially substituted by Nd3+ ions, and simultaneously, Nd3+ ions in the fluorite block are partially substituted by Sr2+ and Ce4+ ions. [12]
Because of the difference in the intrinsic size of rock-salt and fluorite blocks, the lattice parameters of the three phases are clearly different from one another. As is indicated by arrows in Fig. 1, [10] the representative lattice parameters at room temperature are = 3.80 Å, = 13.1 Å, [13] = 3.85 Å, = 12.6 Å, [12, 14, 15] and = 3.95 Å, = 12.1 Å [11, 16] for , , and ’ phases, respectively. One might expect the boundaries from to and to ’ phases to become unclear after complicated chemical substitutions, however, in x-ray diffraction, with respect to the 00 reflections, we can easily detect the phase by observing 00 ( : odd) reflections which are absent in both - and ’-phase structures.
B Films on SrTiO3 (100)
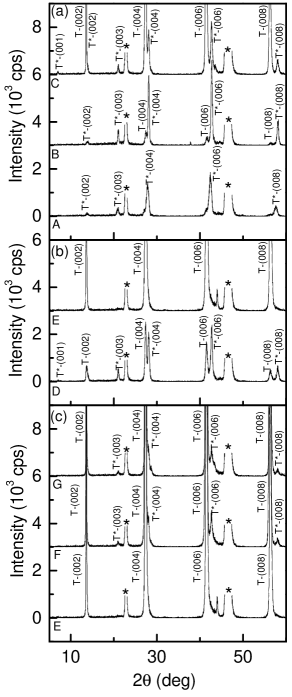
First, I show the results of films grown on SrTiO3 (100) ( = 3.905 Å). Figure 2 (a) shows the x-ray diffraction spectra for samples A ( = 150 Å), B ( = 300 Å), and C ( = 1500 Å) prepared at = 1 Hz. For sample A, almost all observed peaks are assigned to a -phase structure, with only a trace of the phase being observable. By increasing the thickness, however, the diffraction peaks of the phase increase in sample B, and the volume fraction of phase exceeds that of the phase in sample C. This result indicates that the phase is stably grown only at the initial growth stage. The phase appears after the film thickness exceeds a certain value. A similar tendency was observed for samples D ( = 300 Å) and E ( = 1500 Å) (Fig. 2 (b)), which were prepared at a faster pulse rate, = 5 Hz. Interestingly, the phase is no longer a major phase in sample D and almost disappears in sample E. When we compare samples C and E (and also samples B and D), it is clear that the faster growth rate suppresses the appearance of the phase. Since the film thickness is almost the same between samples C and E (and between samples B and D), the diffraction data actually reflect the difference in the volume fractions. Thus the laser repetition rate is concluded to be one of the crucial factors in obtaining a -phase film.
Next let us see the dependence at = 5 Hz. X-ray diffraction spectra of three samples prepared at = 830∘C (sample E), 800∘C (sample F), and 750∘C (sample G) are shown in Fig. 2 (c). The phase is again found in samples F and G. In contrast to the previous reports on the PLD growth of LSCO thin films, in which the optimum substrate temperatures were reported to be 750 780∘C, [8, 9] the phase remains in LNSCO films even at = 800∘C. Therefore, the Nd substitution probably creates a stable -phase region, and pushes the stable -phase region to higher temperatures.
As a result, it is found that -phase LNSCO films can be grown on SrTiO3 (100) only at = 830∘C and = 5 Hz, which are higher and faster than the values for LSCO films. The difference between samples A, B and C is explained as follows. The longer lattice constant of SrTiO3 first stabilizes -phase LNSCO, but, after sufficient lattice relaxation, -phase LNSCO becomes stable. This means that all treatments which suppress the epitaxial effect from SrTiO3 will stabilize the -phase structure. The present result indicates that the faster growth rate reduces the influence of lattice mismatch with the substrate.
C Films on LaSrAlO4 (001) and YAlO3 (001)
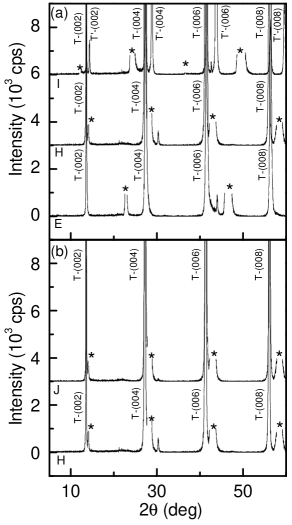
To check the effect of lattice matching, films on LaSrAlO4 (001) ( = 3.76 Å) and YAlO3 (001) ( = 3.71 Å) were also prepared. [17] Growth conditions were set at = 830∘C and = 5 Hz similarly to the case of pure -phase films on SrTiO3. Results are shown in Fig. 3 (a). First, one can see that sample H consists of a pure -phase structure, as does sample E. The -axis length of sample H is approximately 13.13 Å, which is significantly longer than that of sample E, 13.07 Å. This -axis expansion is understood to be a consequence of in-plane compression by LaSrAlO4 (001) as was reported for LSCO films. [3, 4, 5] A substantial difference from the case of SrTiO3 is that the phase is not stable on LaSrAlO4 even if we reduce the growth rate. As is shown in Fig. 3 (b), the film prepared at = 1 Hz also consists of a pure -phase structure, indicating that the appearance of the phase is a consequence of only the in-plane lattice expansion by SrTiO3.
The film on YAlO3 (001) shows a complex structure. Sample I shows not only a set of Bragg peaks from the phase but also another set of peaks at higher angles with similar intensities. It is difficult to identify this second phase from only the -axis length, because the estimated -axis length is 12.41 Å, which is an intermediate value between those of and phases. However, the absence of (00) ( : odd) peaks indicates that the second phase has a -phase structure. Recently reported (La,Ce)2CuO4 thin films grown on SrTiO3 (100) also have similar -axis lengths. [18, 19] The reason why the phase was stably grown on YAlO3 (001) is not simple, because the in-plane lattice parameters of YAlO3 (001) are very short (shorter than those of the phase), while the -axis length of a typical -phase crystal is far longer than those of and phases. Therefore, the lattice misfit between YAlO3 and the phase takes the largest value.
D Phase diagram
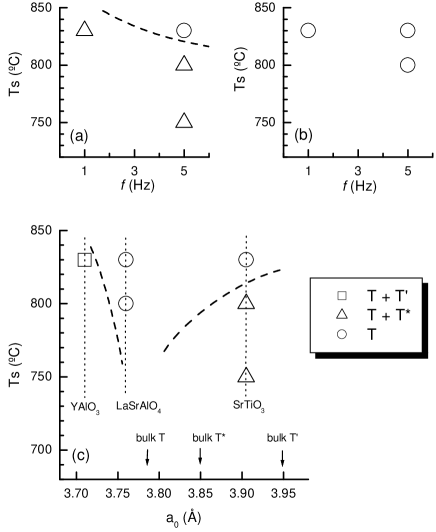
Based on the x-ray diffraction results, I can summarize the obtained phase of (La1.48Nd0.40Sr0.12)CuO4 films as a function of , , and the -axis length of substrates. Figure 4 (a) clearly indicates that higher growth temperatures and faster growth rates are indispensable for eliminating the phase on SrTiO3 (100). There is no such difficulty in obtaining the -phase structure in the films on LaSrAlO4, as shown in Fig. 4 (b). To elucidate the difference between SrTiO3 and LaSrAlO4, it is useful to plot the phase diagram as a function of the -axis length. Figure 4 (c) summarizes the obtained phases at = 5 Hz. It is clear that the -phase region extends to low temperatures at around = 3.80 Å. Since LaSrAlO4 shows the least lattice misfit with the bulk (La1.48Nd0.40Sr0.12)CuO4, the extension of the -phases region to lower temperatures is reasonable.
The -axis length of YAlO3 is far shorter than that of bulk (La1.48Nd0.40Sr0.12)CuO4; the difference of almost 0.1 Å leads to the large misfit value of 2.4%. In the case of such a lattice-mismatch condition, we may expect several situations. One is that the phase is governed only by thermodynamic conditions with no influence of the substrates. However, this does not seem to be the current case because the thermodynamic conditions favor only one stable phase and the coexistence of and ’ phases cannot be explained. Another possibility is that the short -axis length actually exerts a considerable strain effect on the film. In some regions, the very short of YAlO3 allows Nd-poor films to be grown epitaxially, which leads to the growth of Nd-rich films in other regions which are less influenced by the substrate. This scenario is more likely for the current case, because it naturally leads to the phase separation of and ’ phases.
The appearance of the phase in the film on SrTiO3 is unexpected and suggests a strong epitaxial effect. The -axis length of SrTiO3 is far longer than that of bulk (La1.48Nd0.40Sr0.12)CuO4. As is indicated in Fig. 4, the typical -axis length of the bulk -phase structure is between those of the bulk phase and SrTiO3. Therefore it is most likely that the competition between the thermodynamic conditions and the epitaxial effect forces LNSCO films to have a -phase structure. Note that the phase has not previously been identified in the LNSCO compound; the Nd substitution for La in LSCO induces a direct phase transition from the to the ’ phase. [11] Thus it is concluded that the appearance of the phase is the result of an epitaxial strain effect. The absence of ’ phase in this case suggests that the film on SrTiO3 is homogeneous, in contrast to that on YAlO3. The present result indicates that moderate expansion along the in-plane direction can stabilize the -phase structure of LNSCO. One may ask how rock-salt and fluorite blocks are formed from the same La-Nd-Sr components. There is no direct evidence, but I suggest that the rock-salt block may be slightly La rich while the fluorite block may be Nd rich.
In closing this section, the effects of the lattice expansion coefficient should be discussed. The thermal expansion coefficients of the three substrate materials are reported to be = 9 10-6 K-1, 10.5 10-6 K-1, and 5-10 10-6 K-1, for SrTiO3 (100), LaSrAlO4 (001), and YAlO3 (001), respectively. [4, 20] Expected in-plane lattice constants at the optimal growth temperature (830∘C) are then = 3.914 Å, 3.77 Å, and 3.71-3.72 Å. Since, to our knowledge, there is no report on the high-temperature thermal expansion coefficient of LNSCO compounds, we refer to the values for LSCO. Using the value reported by Locquet et al. ( = 8.5 10-6 K-1) [4], we can expect = 3.81 Å for the present composition of LNSCO. The shift of lattice constants is very small, and the epitaxial relationship at the growth temperature is similar to that at room temperature. Therefore, we may safely discuss the epitaxial relationship using the room-temperature lattice constants.
E Comparison of -phase films on SrTiO3 and LaSrAlO4
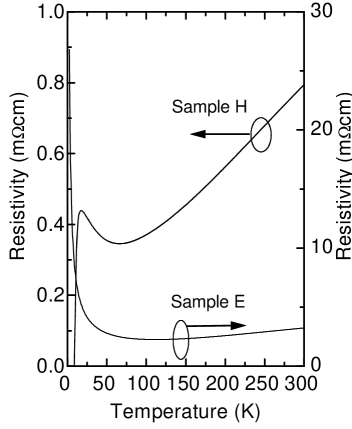
In this section, I address several properties of the pure -phase films on SrTiO3 (100) (Sample E) and LaSrAlO4 (001) (Sample H), because they show a clear difference. One of the important differences is in the transport property. Figure 5 shows the temperature dependence of the resistivity for samples E and H. Neither sample exhibits the discontinuous jump associated with the the structural phase transition from the low-temperature orthorhombic (LTO) to the low-temperature tetragonal (LTT) phase, which is observed in bulk LNSCO crystals. This indicates that a strong epitaxial relation prevents the films from behaving as bulk. [21] Sample H shows sufficiently low resistivity at room temperature and becomes superconducting below = 8.5 K, while sample E has a high resistivity and shows insulating behavior. Nakamura and Uchida presented the resistivity and magnetization data of (La1.48Nd0.40Sr0.12)CuO4 single crystals; the former indicates superconductivity below 10 K while the latter indicates almost no diamagnetism. [22] Subsequent to several investigations on the relationship between the crystal structure and superconductivity, [23, 24] Moodenbaugh et al., studied polycrystalline LNSCO in detail, upon which they found an absence of bulk superconductivity in the sample with the same composition as used in the current study. [25] The absence of superconductivity with the current chemical composition is still an open question, because it strongly depends on the preparation technique. However, at least the suppression of superconductivity in this composition is widely accepted, and the difference between samples E and H is substantial. The result is qualitatively similar to that reported in LSCO and LBCO thin films, [5, 6] which suggests that the same epitaxial strain effect controls the superconductivity of LNSCO films. However, the high resistivity of sample E cannot be explained by only a strain effect, and I believe that significant lattice expansion due to the effect of the SrTiO3 substrate may induce a structural disorder that causes a very high resistivity value.
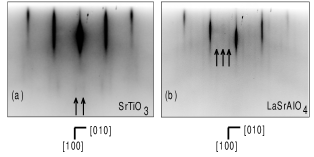
The difference of the substrate also induces different structural modulations. Reflection high-energy electron diffraction (RHEED) patterns of samples E and H are shown in Fig. 6. Several satellite streaks (indicated by arrows) are observed, in addition to the main streaks, for both films, but the positions are different from each other. In sample E, the structural modulation runs along the Cu-Cu diagonal direction with respect to the CuO2 plane, while it runs along the Cu-O-Cu bond direction in sample H. The difference in the modulation directions is probably related to the crystal symmetry of samples E and H. At present, I have no evidence that the observed modulations are related directly to the transport properties; the on-going study of the structural analysis will clarify this.
IV Summary
I have found that the growth conditions of -phase LNSCO films are not the same as those of LSCO, and we should pay special attention not only to the substrate conditions (materials and temperatures) but also to the deposition rate. However, pure -phase LNSCO films can be grown on SrTiO3, which opens the way to the study of the stripe problem with thin-film samples. The next step is to elucidate how the structural difference of LNSCO films stabilizes the static stripe order, by various methods. For this purpose, a detailed study of the dependence of structural and transport properties on Sr doping is now being performed, which will be reported elsewhere.
The author acknowledges H. Sato, M. Naito, Y. Ando, S. Komiya, and A. N. Lavrov for fruitful discussions.
REFERENCES
- [1] J. M. Tranquada, B. J. Sternlieb, J. D. Axe, Y. Nakamura, and S. Uchida, Nature (London) 375, 561 (1995).
- [2] J. M. Tranquada, N. Ichikawa, and S. Uchida, Phys. Rev. B 59, 14712 (1999), and see also references therein.
- [3] H. Sato and M. Naito, Physica C274, 221 (1997).
- [4] J.-P. Locquet, J. Perret, J. Fompeyrine, E. Mächler, J. W. Seo, and G. Van Tendeloo, Nature (London) 394, 453 (1998).
- [5] H. Sato, A. Tsukada, M. Naito, and A. Matsuda, Phys. Rev. B 61, 12447 (2000).
- [6] H. Sato, A. Tsukada, M. Naito, and A. Matsuda, Phys. Rev. B 62, R799 (2000).
- [7] Recently, the charge order has been found in La1.875Ba0.125-xSrxCuO4. See, M. Fujita, H. Goka, K. Yamada, and M. Matsuda, condmat/01078355 (2001).
- [8] I. E. Trofimov, L. A. Johnson, K. V. Ramanujachary, S. Guha, M. G. Harrison, M. Greenblatt, M. Z. Cieplak, and P. Lindenfeld, Appl. Phys. Lett. 65, 2481 (1994).
- [9] W. Si, H. -C. Li, and X. X. Xi, Appl. Phys. Lett. 74, 2839 (1999).
- [10] For convenience, I assumed pseudotetragonal symmetry for all grown phases.
- [11] K. K. Singh, P. G. Ganguly, and J. B. Goodenough, J. Solid State Chem. 53, 254 (1984).
- [12] H. Sawa, S. Suzuki, M. Wantanabe, J. Akimitsu, H. Matsubara, H. Watabe, S. Uchida, K. Kokusho, H. Asano, F. Izumi, and E. Takayama-Muromachi, Nature 337, 347 (1989).
- [13] Y. Goto, T. Kamiyama, T. Ohshima, and H. Asano, Proc. 4th Int. Sym. Superconductivity, Tokyo, 89 (1991).
- [14] G. H. Kwei, R. B. von Dreele, S. -W. Cheong, Z. Fisk, and J. D. Thompson, Phys. Rev. B 41, 1889 (1990).
- [15] F. Izumi, E. Takayama-Muromachi, A. Fujimori, T. Kamiyama, H. Asano, J. Akimitsu, and H. Sawa, Physica C 158, 440 (1989).
- [16] Y. Tokura, H. Takagi, and S. Uchida, Nature 337, 345 (1989).
- [17] We estimate the lattice parameters of YAlO3 using pseudotetragonal notation. To say exactly, YAlO3 is orthorhombic with = 5.18 Å and = 5.33 Å.
- [18] Y. Matsuo, K. Betsuyaku, H. Katayama-Yoshida, and T. Kawai, Proc. 12th Int. Symp. Superconductivity, Morioka, 912 (1999).
- [19] M. Naito and M. Hepp, Jpn. J. Appl. Phys. 39, L485 (2000).
- [20] H. Asano, S. Kubo, O. Michikami, M. Satoh, and T. Konaka, Jpn. J. Appl. Phys. 29, L1452 (1990).
- [21] Preliminary structural anlysis indicates that both samples E and H have tetragonal symmetry at room temperature.
- [22] Y. Nakamura and S. Uchida, Phys. Rev. B 46, 5841 (1992).
- [23] M. K. Crawford, R. L. Harlow, E. M. McCarron, and W. E. Farneth, Phys. Rev. B 44, 7749 (1991).
- [24] B. Büchner, M. Breuer, A. Freimuth, and A. P. Kampf, Phys. Rev. Lett. 73, 1841 (1994).
- [25] A. R. Moodenbaugh, L. H. Lewis, and S. Soman, Physica C 290, 98 (1997).
| Sample | Substrate | frequency | thickness | phase | ||
|---|---|---|---|---|---|---|
| [Hz] | [C∘] | [Å] | main | sub | ||
| A | SrTiO3 (100) | 1 | 830 | 150 | ||
| B | SrTiO3 (100) | 1 | 830 | 300 | ||
| C | SrTiO3 (100) | 1 | 830 | 1500 | ||
| D | SrTiO3 (100) | 5 | 830 | 300 | ||
| E | SrTiO3 (100) | 5 | 830 | 1500 | — | |
| F | SrTiO3 (100) | 5 | 800 | 1500 | ||
| G | SrTiO3 (100) | 5 | 750 | 1500 | ||
| H | LaSrAlO4 (001) | 5 | 830 | 1500 | — | |
| I | YAlO3 (001) | 5 | 830 | 1500 | ’ | |
| J | LaSrAlO4 (001) | 1 | 830 | 1500 | — | |