Slow Kinetics of Capillary Condensation in Confined Geometry: Experiment and Theory
Abstract
When two solid surfaces are brought in contact, water vapor present in the ambient air may condense in the region of the contact to form a liquid bridge connecting the two surfaces : this is the so-called capillary condensation. This phenomenon has drastic consequences on the contact between solids, modifying the macroscopic adhesion and friction properties. In this paper, we present a survey of the work we have performed both experimentally and theoretically to understand the microscopic foundations of the kinetics of capillary condensation. From the theoretical point of view, we have computed the free energy barrier associated with the condensation of the liquid from the gas in a confined system. These calculations allow to understand the existence of very large hysteresis, which is often associated with capillary condensation. This results are compatible with experimental results obtained with a surface forces apparatus in a vapor atmosphere, showing a large hysteris of the surface energy of two parallel planes as a function of their distance. In the second part, we present some experiments on the influence of humidity on the avalanche angle of granular media. We show that the ageing in time of this avalanche angle can be explained by the slow kinetics of capillary condensation in a random confined geometry.
keywords:
Capillary condensation , Granular , Surface forces apparatusPACS:
61.43.Gt; 68.45.D1 Introduction
Molecules confined in narrow pores, with pore widths of a few molecular diameters, can exhibit a wide range of physical behavior. The introduction of wall forces, and the competition between fluid-wall and fluid-fluid forces, can lead to interesting surface driven phase changes, since for a small confinement the surface effects can be more important than the bulk effects [1]. Such effects can be observed in porous materials which have a large specific area. Porous materials are involved in many physical, chemical or biological processes. Their adsorption properties are known to present a variety of behavior related to the texture of the porous matrix, which provides an experimental way to analyze the pore size distribution. Interpretation of adsorption isotherms in these materials commonly involves a well known phenomenon, capillary condensation [1, 2, 3], which corresponds to the condensation of liquid bridges in the pores. More fundamentally, capillary condensation is a gas-liquid phase transition shifted by confinement. A basic model of confinement is provided by the slab geometry, for which the fluid is confined between two parallel planar solid walls. The classical theory of capillarity [3] predicts that in this geometry the liquid phase condenses when the substrate-liquid surface tension is smaller than the substrate-vapor surface tension , and when the distance between the surfaces is lower than satisfying the Kelvin equation:
| (1) |
Here, is the difference between the bulk densities of the liquid and the gas phase, is the (positive) undersaturation and is the chemical potential at bulk coexistence. If the vapor can be considered as an ideal gas, we have: , where is the Boltzmann’s constant, is the absolute temperature and the saturated vapor pressure divided by the partial pressure of the vapor. Although the equilibrium properties of this transition have motivated many experimental [4, 5, 6, 7] and theoretical studies [8, 3, 9], capillary condensation presents remarkable dynamical features which are still to be explained. The most striking feature is the huge metastability of the coexisting phases, which contrasts with the bulk liquid-vapor transition.
Since capillary condensation is a first order phase transition, one should be able to identify a critical nucleus and a corresponding free energy barrier away from the spinodal. For sufficiently small , it can be shown that the liquid films coating the solid surfaces become unstable due to fluid-fluid interactions and grow to fill the slab. This has been carefully studied by several authors [7, 11, 12]). In this article we show that, as in the homogeneous nucleation case, the shape of the critical nucleus results from the balance between surface and volume contributions. The height of the activation barrier is so large that it can induce a large metastability of the vapor phase. This first theoretical result is compared to experiments on capillary condensation in a surface forces apparatus. In the second part of this article, we will discuss the influence of this slow kinetics of capillary condensation on the mechanical properties of a granular material in a humid atmosphere.
2 Homogeneous nucleation of a liquid phase between ideal surfaces
2.1 Method
Since capillary condensation occurs only in a confined geometry, the problem which arises in computing an energy barrier for the vapor/liquid transition is the validity of the macroscopic concepts of the classical theory of capillarity.
To address this problem we use the following approach:
i– We
use a Density Functional Theory (DFT) model for the fluid phase,
taking into account the long range interactions with the solid
surfaces, and study the time evolution of a metastable confined
vapor with a Langevin equation. We perform this study in a two
dimensional geometry and determine the energy barrier associated
with the vapor/liquid transition as a function of the distance
between the walls.
ii– We compare these results with the prediction of the classical
theory of capillarity in two dimensions. The classical theory
gives the correct qualitative behavior and dependency of the
energy barrier as a function of the confinement up to a numerical
prefactor.
iii– We then use the classical theory to calculate the energy
barrier to condensation between two parallel plates in the three
dimensional case, and discuss the order of magnitude obtained.
2.2 Theoretical calculation of the activation energy in a 2D geometry
We first use a mesoscopic Landau-Ginzburg model for the grand potential of the 2D system confined between two walls. In terms of the local density , we write the “excess” part of the grand potential , where is the pressure of the system at coexistence, as:
| (2) |
In this equation, is a phenomenological parameter allowing a simple treatment of inhomogeneous fluids; is the confining external potential, which we took for each wall as , with the distance to the corresponding wall; and have the dimensions of an energy and a distance, can be interpreted as the negative of the “excess” pressure , with the bulk free-energy density [13]. To allow a phase transition in this system, we assume a phenomenological double well form for : , where is a phenomenological parameter [14]. The system is then driven by a non-conserved Langevin equation for :
| (3) |
where is a phenomenological friction coefficient and is a Gaussian noise field related to through the fluctuation-dissipation relationship [16]. This time dependent Landau-Ginzburg model provides a good phenomenological description of the dynamics of the density field as soon as the dynamics of the nucleation is not limited by the crossing of the activation barrier. This model has been previously successfully applied to homogeneous nucleation [15].
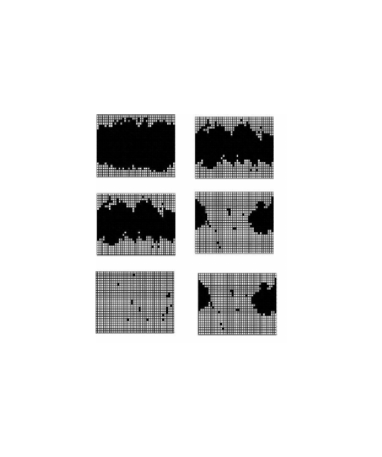
The units of energy, length are such that . Time is in units of with . In these units, we took , , , . Typical values of the chemical potential and temperature are , (which is roughly half the critical temperature in this model). Periodic boundary conditions with periodicity were applied in the lateral direction. The simulated system is initially a gas state filling the whole pore, and its evolution is described by equation (3). A typical evolution (see figure 1) of the mean density in the slit shows that: i) As expected [8], due to the long range nature of the external potential a thick liquid film of thickness rapidly forms on both walls on a short time scale ( and in our case) ii) Fluctuations of the interfaces around their mean value induce after a while a sudden coalescence of the films. This second process has a characteristic time .
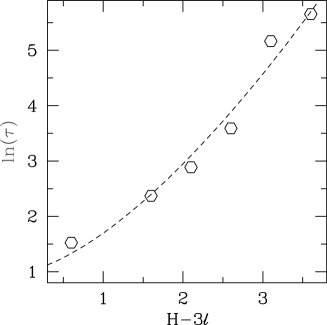
Studying the influence of the temperature on , we have shown [17] that this time obeys an Arrhenius law , where is identified as the energy barrier for nucleation. In the 2D case, we have calculated [17] the energy barrier expected from the classical theory of capillarity:
| (4) |
The dependence ( being fixed) on the activation time is plotted in fig. 2. As seen in fig. 2, the DFT model provides a good agreement with this classical prediction as far as the distances between the walls is replaced by an effective distance to take into account the presence of the wetting films. The prefactor can be estimated from the data plotted in fig. 2, yielding , while the classical prediction gives (here the liquid-vapor surface tension -at finite temperature - has been computed from independent Monte-Carlo simulations of the model, yielding ). The macroscopic theory thus gives a correct qualitative picture and a semi-quantitative agreement of the activation energy for capillary condensation.
2.3 Nucleation between parallel plates in three dimensions
We use then the classical theory of capillary to estimate the activation energy for nucleating a liquid phase between two parallel plates. In the grand-canonical ensemble the critical nucleus corresponds to a saddle-point of the grand potential. We will consider the perfect wetting situation , although a generalization to the partial wetting case is straightforward. The grand potential of a pore partially filled with liquid may be written [8]
| (5) |
where (resp. ) is the volume of the gas (resp. liquid) phase and , and respectively denote the total solid-liquid, solid-vapor and liquid-vapor surface area. The following expression is obtained for the “excess” grand potential, , with the grand-potential of the system filled with the gas phase only :
| (6) |
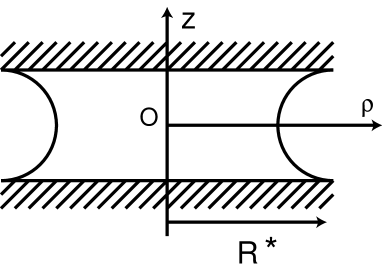
where we have used . Within classical capillarity, long range fluid-fluid interactions are not taken into account, therefore the critical nucleus has to be a liquid bridge connecting the plates. One also expects this critical nucleus to exhibit rotational invariance, so that in eq. (6) is best parameterized in cylindrical coordinates (see fig. 3). In terms of , the position of the LV interface, one obtains
| (7) |
where the index denotes differentiation. Extremalization of the grand potential (7) leads to the usual condition of mechanical equilibrium, the Laplace equation, which relates the local curvature to the pressure drop according to the Laplace law of capillarity: . This condition remains valid although the nucleus corresponds to a saddle point and not a minimum of the grand-potential.
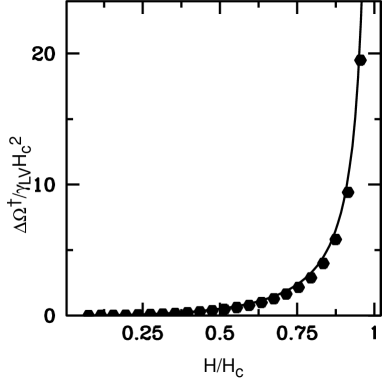
The main difference with bulk homogeneous nucleation comes from the pressure drop at the interface: here, the liquid pressure inside the meniscus is lower than the gas pressure since , so that the critical nucleus takes the form of a liquid bridge between the solid substrates instead of the spherical shape encountered in bulk homogeneous nucleation. The previous Laplace equation is non-linear and cannot be solved analytically. From dimensional arguments however, one expects , with a dimensionless function. The latter can be obtained from the numerical resolution of the Laplace equation, yielding the shape of the meniscus [18]. Numerical integration of eq. (7) then gives the corresponding free energy barrier. The result for the energy barrier is plotted in figure 4. As can be seen from the figure, a divergence of is obtained as the pore width reaches . When the axisymetric extension of the bridge is large compared to , the negative (axisymmetric) contribution to the curvature is negligible and the L-V profile can be approximated by a semi-circular shape. This allows to obtain explicit expressions for the different contributions to in eq. (6) as a function of the extension of the bridge, namely , and . Maximization of as a function of yields the following expression for the free energy barrier
| (8) |
which does exhibit a divergence at . As shown in figure 4, this approximate expression is in very good agreement with the numerical calculation, even at small confinement . Physically, an important consequence of the diverging energy barrier at is that the gas phase becomes extremely metastable: for water at C, at a relative humidity of , we obtain nm and . This numerical estimate shows that the energy barrier is always larger than the thermal energy of the system, except when .
2.4 Experimental evidence of the metastability
Metastability effects in capillary condensation are very often observed in porous media, where they are responsible for hysteresis loops in adsorption/desorption isotherms. In such hysteresis loops however it is not possible to tell which branch is the stable one. We have studied the capillary condensation of alkane vapors between smooth metal surfaces with a Surface Forces Apparatus [7]. In this type of experiments, the pressure of vapor is kept constant, and the distance between the surfaces (a sphere and a plane) is varied. The condensation of a liquid phase is revealed by a very strong adhesion force due to the capillary depression in the liquid phase. On the contrary, almost no interaction is measured when the surfaces are separated by the vapor. In these experiments, one observes the hysteresis loop of the force as a function of the distance between the surfaces associated with the metastability effects in the liquid/vapor transition. The particularity of SFA experiments is that it is possible to know which branch of the curve correspond to the lower energy state and therefore which phase is stable for a given confinement. This is due to the so-called Derjaguin approximation, which relates the force measured between a sphere of large radius of curvature , and a plane, to the interaction energy per unit area of two parallel plates separated by the same distance [2]:
| (9) |
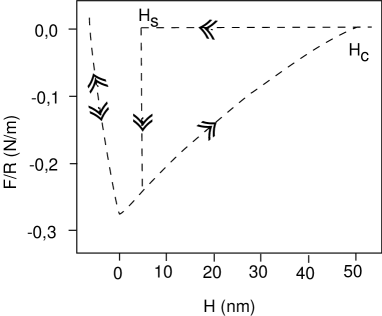
The force curve shows then clearly that for a large range of values of the confinement the vapor phase is metastable. In the hysteresis range, the vapor never condenses over the time of the experiments–typically some hours–showing that the energy barrier to overcome in order to form a liquid bridge between the surfaces is actually quite large.
3 Slow kinetics of capillary condensation: the aging of the friction coefficient
3.1 Humidity induced aging of the avalanche angle of a granular medium
Since the condensation of liquid in a confined geometry can be hindered by high activation energy, one expects that capillary condensation processes may display slow kinetics. We discuss here in more detail the influence of humidity an the slow evolution in time of a macroscopic property: the avalanche angle of granular media.
Solid friction properties of a large number of solid materials are well described by the Coulombs’law, which states that the minimum tangential force that must be applied to a contact between solids in order to bring them into relative motion obeys the relation , where is the normal load applied to the contact and the static friction coefficient. Systematic studies on various material (for a review see Baumberger [19]) show that increases slowly with the time during which the solid have been into contact at rest. This aging behavior of the static friction coefficient is often found to be logarithmic in time [20]:
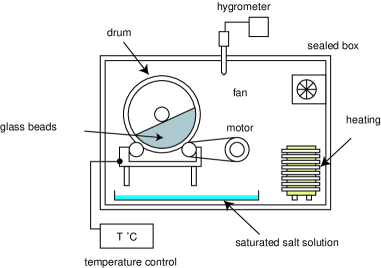
More recently, the influence of humidity on this aging behavior has been brought into evidence. Dieterich [21] first showed in rock onto rock friction , that aging occurs only in humid atmosphere. In our group, we have studied more specifically the influence of humidity on aging of friction properties in granular media. For that purpose, we have measured the avalanche angle of a granular media consisting of micrometric glass beads in a controlled environment (see fig. 6). Using a rotating drum, the time during which the granular heap remains at rest can easily be varied.
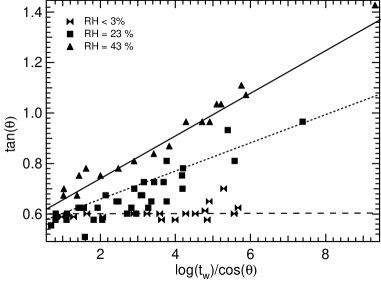
The evolutions of the maximum angle of stability as a function of the resting time , at different humidities are shown in figure 7. The data clearly show an aging behavior, since the angle of first avalanche systematically increases with the resting time.
A first important point in this aging behavior is that it cannot be explained by an increase of the friction coefficient alone. Indeed, avalanche angle larger than can be obtained for high humidities and large waiting time; in those cases the granular heap has enough internal cohesion to remain stuck to the upper part of internal wall of the drum . The effect of such a cohesive force can be included in Coulomb’s analysis by adding an additional force to the normal component of the weight of a layer of glass beads at the surface of the heap [23]. This yields the following condition for an avalanche to occur:
| (10) |
where is the weight of the layer of glass beads undergoing the avalanche. Since the data show a linear dependence of the tangent of the avalanche angle with , we can conclude that there is a cohesion force in the granular media which increases as . This dependency is observed over more than 4 decades of time (resting times range from 5 to 200 000 s). We do not observe any saturation of the angle at times as long as 200 000 s. The amplitude of this aging in characterized by the slope of the lines obtained is this representation.
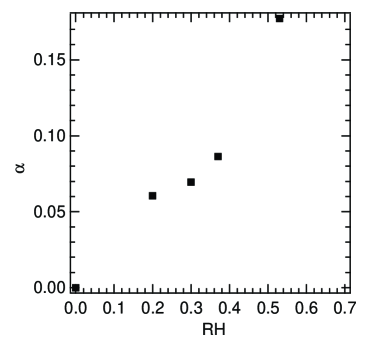
A very important parameter for this aging behavior is the humidity of the surrounding atmosphere. We do not observe any aging in dry atmosphere. Figure 8 shows that this aging increases with the relative humidity: this increase is reversible.
3.2 A simple model of thermally activated process for aging
Although a lot can be learned from the perfectly flat slab geometry, the latter is certainly too idealized to account for the kinetics of adsorption in “real” experimental systems such as the previous ones. 9
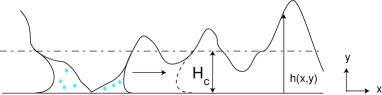
We show here that these logarithmic time dependence of the cohesion force between the surfaces may be understood by taking into account the influence of surface roughness on the dynamics of capillary condensation. Let us consider a simple model consisting of two surfaces facing each other and rough at the nanometric scale, as depicted on fig. 9. As emphasized in the introduction capillary condensation typically occurs in pores of nanometric size. We thus have to consider the roughness of the surfaces at the nanometer level. Here again we shall stay at a macroscopic description, and focus on a qualitative picture of the influence of roughness on the transition mechanism. Without loss of generality, one may consider that one of the walls is perfectly flat. When roughness is present, there is a broad range of gaps between the surfaces. In particular, there are regions where the two surfaces are in close contact. In such regions, condensation should take place on a very short time-scale. Thus at “early times”, one has to consider a set of wetted islands, which we shall consider as independent one of the other. Once these islands have formed, they should grow up to a point where the distance between the surfaces is equal to , so that a meniscus of radius forms at the liquid-vapor interface, allowing for mechanical equilibrium.
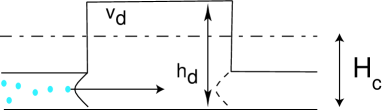
In doing so however, the wetted area has to overcome unfavorable regions where the distance between the two surfaces is larger then . Let us consider a specific jump over such a “defect”, as idealized in fig. 10. We denote by the “averaged” gap inside the defect (), and by its area. The free energy cost for the liquid bridge to overcome this defect is approximatively given by
| (11) | |||||
where is the excess volume of the defect, . We can thus estimate the time to overcome the defect as
| (12) |
One may expect the defects to have a broad distribution of excess volume , so that the activation times are very widely distributed. After a time , only the defects with an activation time smaller than have been filled by the
liquid phase. Using eq. 11 and 12 these have an excess volume which verifies . The number of filled defects at a time is then typically where is the typical width of the distribution of excess volume of the defects. Now, once a liquid bridge has bypassed a defect, the area wetted by the liquid increases by some typical (roughness dependent) . The time wetted area grows in time as:
| (13) | |||||
Assuming a typical radius of curvature of the asperities, we find if , that . If we now assume that the vapor is an ideal gas, then . This give a cohesion force between two beads:
| (14) | |||||
This model gives the good dependency of the cohesion force with the resting time in qualitative agreement with the experiments. It is not possible to test directly this prediction since and are not easily measured but we can check the dependency of with the relative humidity. However we can check the internal coherence of this mechanism by estimating the order of magnitude of the cohesion force needed to induce aging of the avalanche angle. Using equation 10, the increase of the cohesion force during the time must be:
| (15) |
The numerical value of is thus of the order of the weight of a bead. On the other hand, the maximum value of the capillary force between two beads in contact is obtained when the beads are ideal sphere (no roughness): N for beads of radius m in water vapor humidity. This is four order of magnitude larger than the weight of a bead:N.
Therefore one see that a slow kinetics of capillary condensation between rough surfaces, leads to a logarithmic growth in time of the capillary force and can actually be responsible for the aging of the avalanche angle of granular media, as well as more generally for the humidity induce aging of the friction properties of surfaces.
References
- [1] L. D. Gelb, K. Gubbins, R. Radhakrishnan, M. Sliwinka-Bartowiak, Rep. Prog. Phys. 62 (1999) 1573–1659.
- [2] J. Israelachvili, Intermolecular & Surface Forces, 2nd Edition, Academic Press, London, 1992.
- [3] R. Evans, U. M. B. Marconi, P. Tarazona, J. Chem. Phys. 84 (4) (1986) 2376–99.
- [4] L. Fisher, J. Israelachvili, Nature 277 (5697) (1979) 548–549.
- [5] L. Fisher, J. Israleachvili, Colloids and Surfaces 3 (4) (1981) 303–19.
- [6] H. K. Christenson, J. Colloid Interf. Sci. 121 (1) (1988) 170–178.
- [7] J. Crassous, E. Charlaix, J.-L. Loubet, Europhys. Let. 28 (1) (1994) 37–42.
- [8] R. Evans, U. M. B. Marconi, Chem. Phys. Lett. 114 (4) (1985) 415–422.
- [9] B. V. Derjaguin, Prog. Surf. Sci. 40 (1992) 46–61.
- [10] L. Bocquet, E. Charlaix, S. Ciliberto, J. Crassous, Nature 396 (6713) (1998) 735–737.
- [11] H. Christenson, Phys. Rev. Lett. 73 (13) (1994) 1821–25.
- [12] M. Forcada, J. Chem. Phys. 98 (1) (1993) 638–43.
- [13] J. Rowlinsom, B. Widom, Molecular Theory of Capillarity, Clarendon Press, Oxford, 1982.
- [14] S. A. Safran, Statistical Thermodynamics of Surfaces Interfaces and Membranes, Addison-Wesley, Reading, Massachussetts, 1996.
- [15] O. T. Valls, G. F. Mazenko, Phys. Rev. B 42 (10) (1990) 6614–22.
- [16] P. M. Chaikin, T. Lubensky, Cambridge University Press, Cambridge, 1995.
- [17] F. Restagno, L. Bocquet, T. Biben, Phys. Rev. Lett. 84 (11) (2000) 2433–36.
- [18] W. H. Press, S. A. Teukolsky, W. T. Vetterling, B. P. Flannery, Numerical Recipes in Fortran 77, Cambridge University Press, Cambridge, 1992.
- [19] T. Baumberger, Solid State Comm. 102 (2-3) (1997) 175–85.
- [20] E. Rabinowicz, The Friction and Lubricationf of Solids, John Wiley and Sons, New-York, 1965.
- [21] J. Dieterich, G. Conrad, J. Geoph. res. 89 (B6) (1984) 4196–4202.
- [22] B. Crétinon, Technique de l’Ingénieur R3 045 1–17.
- [23] T.C. Halsey, Phys. Rev. Lett. 80 (14) (1998) 3141–4