Bulk and Interfacial Shear Thinning of Immiscible Polymers
Abstract
Nonequilibrium molecular dynamics simulations are used to study the shear thinning behavior of immiscible symmetric polymer blends. The phase separated polymers are subjected to a simple shear flow imposed by moving a wall parallel to the fluid-fluid interface. The viscosity begins to shear thin at much lower rates in the bulk than at the interface. The entire shear rate dependence of the interfacial viscosity is consistent with a shorter effective chain length that also describes the width of the interface. This is independent of chain length and is a function only of the degree of immiscibility of the two polymers. Changes in polymer conformation are studied as a function of position and shear rate. Shear thinning correlates more closely with a decrease in the component of the radius of gyration along the velocity gradient than with elongation along the flow. At the interface, this contraction of chains is independent of and consistent with the bulk behavior for chains of length . The distribution of conformational changes along chains is also studied. Central regions begin to stretch at a shear rate that decreases with increasing , while shear induced changes at the ends of chains are independent of .
I Introduction
The viscosity of a polymer melt decreases when the melt is subjected to a sufficiently large shear rate, a phenomenon known as shear thinning. This non-Newtonian behavior is important in polymer processing and applications and has been extensively studied both experimentally and theoretically[1, 2, 3]. The basic origin of shear thinning is that polymers elongate and align with the flow when they are sheared more rapidly than they can relax. As the shear rate increases, the degree of alignment rises and the polymers present a decreasing hydrodynamic resistance to flow. Recent numerical simulations [4, 5, 6, 7, 8] have investigated a variety of issues in this non-Newtonian regime, including the shear-rate dependence of the viscosity, polymer conformation, and wall slip.
One area which has yet to be explored is shear-thinning near the interface between immiscible polymers. Blending of polymers is common in industry, as this is one way of creating new materials. However, the blended polymers are often immiscible, leading to phase separation. The resulting interfaces can have a major impact on the processing and ultimate properties of the blend.
The static properties of interfaces in binary polymer blends are typically described by the Flory-Huggins model [9]. The degree of immiscibility is characterized by a parameter , which represents the free energy cost for placing a monomer of one type into a homogeneous region of the other type. There is a characteristic length of the loops of one type of polymer that penetrate into the region occupied by the other polymer. By balancing the enthalpic cost and entropy gain, one finds that [10]. The interface width scales as the radius of gyration of a segment of length .
De Gennes and coworkers argued that the dynamic properties of the interface should also be controlled by rather than the chain length [10]. In particular, they suggested that for polymers in the Rouse limit the interfacial viscosity should be given by the bulk viscosity of chains of length . This implies that is only a function of and has no dependence on (as long it is larger than ). Goveas and Fredrickson reached similar conclusions from more detailed calculations [11].
In a recent paper we presented a simulation study of the interfacial viscosity in the Newtonian regime of a symmetric binary blend of Rouse polymers [12]. As predicted [10, 11], we found that the interfacial viscosity is determined by the degree of immiscibility and converges to a chain length independent value at large . Moreover, both and the interface width decrease with increasing immiscibility and their values are consistent with a common value of .
In this paper we investigate the shear thinning behavior of the interfacial viscosity. We find that the same that sets the width of the interface and the Newtonian viscosity determines the shear rate where shear thinning begins. Indeed the entire variation of with shear rate follows the bulk shear thinning curve for chains of length and is independent of . The shear rate dependent viscosity converges to the bulk behavior for chains of length at distances of order from the interface. Since is larger than , the bulk viscosity is higher than in the Newtonian regime and begins to shear thin at a lower shear rate. Indeed, the interface does not begin to shear thin until has decreased to a value that is comparable to the Newtonian limit of . At higher shear rates the viscosity is nearly independent of distance from the interface.
We also examine changes in the conformational properties of chains near the interface and in the bulk as a function of shear rate. In equilibrium, the bulk values of the mean-square components of the end-to-end vector are equal, . The two components in the plane of the interface ( and ) remain nearly unchanged at the interface, but the normal component decreases because of the constraint imposed by immiscibility. As the shear rate is increased, polymers elongate along the direction of flow (), and contract in the orthogonal directions. We find substantial elongation before there is any measurable change in bulk viscosity. The onset of bulk shear thinning appears to be more closely correlated with the onset of contraction in the direction. The correlation between viscosity and contraction is even more dramatic at the interface. Like , plots of as a function of shear rate are independent of and follow the bulk behavior for chains of length . In contrast, changes in elongation depend on and begin at lower shear rates than changes in .
II Model
The polymer model and simulation techniques are similar to those used in previous work [12, 13, 14]. The polymer potential is based on the bead-spring model developed by Kremer and Grest [15]. Linear polymers containing beads each are created by linking nearest neighbors on a chain with the potential
| (1) |
where is the distance between beads and , , , and and set the length and energy scales, respectively. All particles in the system interact through a truncated Lennard-Jones potential
| (2) |
where the interaction energy and cutoff depend on the types and of beads and , respectively. The cutoff is set at to produce a purely repulsive interaction between beads. For interactions between polymers of the same type , with or . The two types of polymers are made immiscible [16] by increasing the repulsive energy between unlike beads to , where or . Both values of are sufficient to produce phase separation for the range of chain lengths considered here, and .
The bounds of the simulation cell are periodic in the and directions, with periods and , respectively. In the direction the cell is bounded by top and bottom walls. Each contains atoms tied to the sites of a plane of an fcc lattice by harmonic springs of stiffness . The walls are separated by . They confine polymer beads, yielding a bead density of in regions far away from interfaces. Density oscillations are induced within a few of the walls [17]. However, the solid/polymer interfaces are only introduced to produce shear and are not of direct interest here. We thus restrict our discussion to regions more than five from the walls, where wall-induced ordering is negligible.
A symmetric blend is created in the following way. Polymers whose centers of mass are located in the bottom half of the simulation box are labeled type and the remaining polymers are labeled . The dividing plane is adjusted to ensure that there are equal numbers of polymers of each type. We also studied single phase systems with and at the same bead density.
Shear flow is induced by moving the top wall parallel to the interface at a constant speed in the direction. Due to the sharp wall/polymer interface and large polymer viscosity there can be a substantial difference between the velocities of the wall atoms and adjacent polymer beads [13, 14, 17, 18, 19]. We increased the wall/polymer interactions to limit this interfacial “slip”. Atoms and beads interact through a Lennard-Jones potential with . For most simulations and the cutoff is extended to to include part of the attractive region in the Lennard-Jones potential. At the highest shear rates studied, the wall/polymer interactions are increased by choosing , and .
The equations of motion are integrated using a fifth-order predictor-corrector method [20], with a time step , where is the basic unit of time, and is the mass of a monomer. A constant temperature of is maintained with a Langevin thermostat [15]. To ensure that this thermostat does not bias the shear profile, the Gaussian white noise and damping terms are only added to the equations of motion for the velocity components normal to the mean flow ( and ) [13, 21]. There is a characteristic time required for energy to flow from velocity fluctuations along the flow direction to the thermostatted components. When the inverse shear rate becomes comparable to this time, the kinetic energy along the flow direction is no longer thermostatted effectively. This limits the maximum shear rate in our simulations to about 0.2. However the correct ensemble for higher shear rates is a matter of continuing debate, and such strongly nonequilibrium states are not accessible to experiments [21, 22].
The local shear rate, , of the fluid is easily calculated by taking the local rate of change in the component of velocity, as a function of , i.e. . This is done by taking slices parallel to the plane, of width , and averaging the velocity of the monomers within these slices. The viscosity within a slice is found from
| (3) |
where the shear stress is constant throughout the system in steady state. Values of shear rate and viscosity presented below are averaged over ten slices.
The wall velocity is varied from to . As shown in Table I, this leads to a variation by almost two orders of magnitude in the bulk shear rate evaluated far from any interface. Note that this shear rate is the same in both fluids since we consider a symmetric melt. Statistical fluctuations drop with the total distance the wall moves and increase with increasing chain lengths (e.g. Fig. 2). The simulations at lower shear rate were sheared for more than a million time steps after equilibration. Half this interval was used for higher shear rates.
III Results
A Interface Width
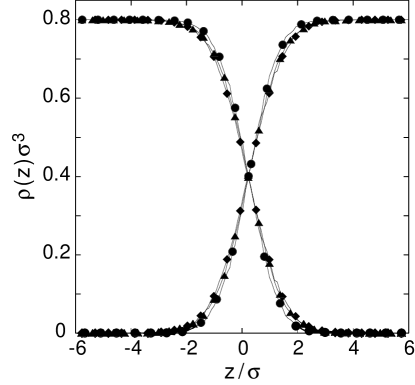
In Fig.1 we show the densities of the two types of beads in the region near the interface for and and 64. For this strongly immiscible case, the densities change from their bulk values to zero over a few . Moreover, these density profiles are nearly unaffected when is changed by a factor of and the bulk shear rate is changed by a factor of 100.
Previous studies of equilibrium interfaces have related the interface width to the radius of gyration of polymer segments that enter the interfacial region [9, 10, 11, 23, 24]. The length of these segments, , is determined by the degree of immiscibility and becomes independent of in the large limit. Earlier studies of the equilibrium properties of the model considered here[12] are consistent with these predictions. For example, for the density profiles are independent of for . As illustrated in Fig. 1, this behavior extends to the highest shear rates studied here. The same insensitivity to shear rate is found for the less immiscible case of where the interface is slightly wider.
B Viscosity
The bulk viscosity of polymers whose length is shorter than the entanglement length can be described with Rouse theory [25]. The limiting Newtonian viscosity at low shear rates scales linearly with chain length: , where is the monomeric friction coefficient and is the statistical segment length. DeGennes and coworkers [10] argued that the viscosity in the interfacial region, , should be determined by the effective length rather than because is the length of segments that must relax during shear flow. Their conclusion is supported by the analysis of Goveas and Fredrickson[11] and by our earlier simulations in the Newtonian limit [12].
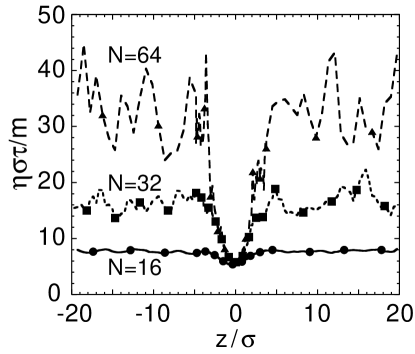
The dependence of the bulk and interfacial viscosities on chain length in the Newtonian limit is illustrated in Figure 2. Here is plotted against height for over the range of chain lengths where the interface width, and thus , is constant. Away from the interface approaches the bulk viscosity, which rises linearly with for up to 64. The slope of this rise determines , since is known from static properties [12, 15] and .
In the interfacial region the viscosity is smaller than the bulk value and is independent of chain length. This is consistent with the picture that the constant value of determines . Equating to the chain length that would give a bulk viscosity equal to yields . A similar analysis for yields , and in both cases the radius of gyration corresponding to is 1.6 times the interface width [12]. Thus the Newtonian response is consistent with the picture advanced by deGennes and coworkers [10].
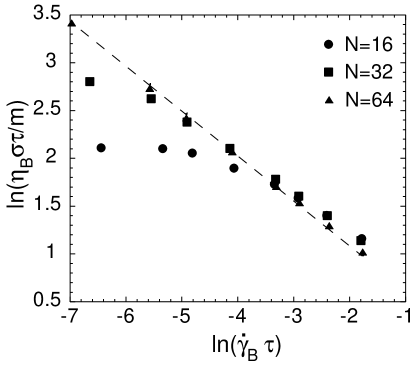
The shear thinning behavior of the bulk viscosity with increasing shear rate is shown in Fig. 3. As is well known, the onset of shear thinning occurs when the system is sheared more rapidly than it can relax. Since the time to relax increases with chain length, the onset of shear thinning moves to lower shear rates with increasing [7]. As in previous work [7], the decrease in viscosity at high shear rates can be fit to a power law , with near 1/2. The dashed line in Fig. 3 shows a fit to data with . The low shear rate viscosity increases with chain length, and the high shear rate behavior is nearly independent of .
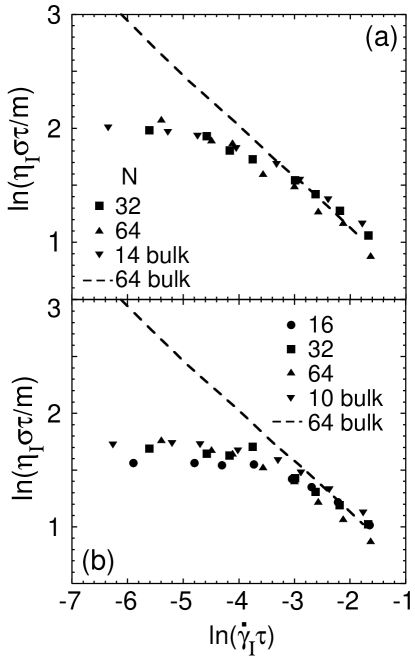
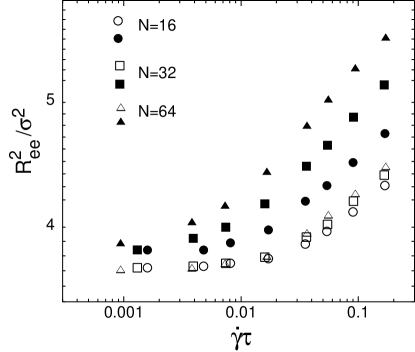
The variation of the interfacial viscosity with the interfacial shear rate is shown in Fig. 4 for different and . In all cases, begins to shear thin at much higher shear rates than . Data is only presented for values of where the Newtonian response and interface width are independent of chain length, so that should also be constant. One sees from the figure that the shear thinning behavior is also independent of in this limit. Moreover, the entire shear thinning curve for all at each value of is consistent with the bulk shear thinning behavior of chains with length equal to the values of inferred from the corresponding Newtonian response. This is strong evidence that a single segment length determines the non-Newtonian shear thinning behavior as well as the static interface profile and Newtonian response.
C Polymer Conformations
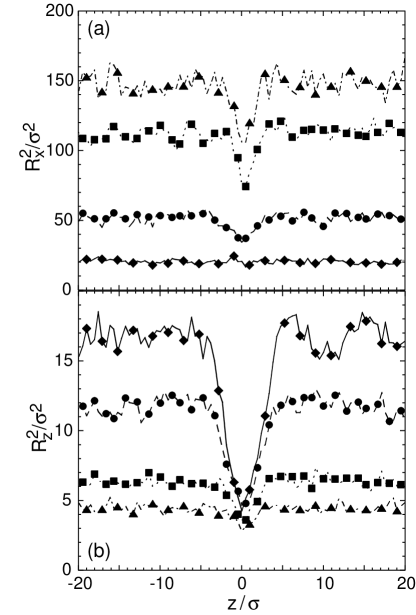
We now describe the changes in chain conformation that are associated with the shear thinning of the bulk and interface. Fig. 5 shows the mean square of the three components of the end-to-end vector as a function of the height of the polymer’s center of mass. The two panels show results for two low shear rates with and . The lowest shear rate (panel (a)) is well into the Newtonian regime, and the polymers have time to relax to equilibrium conformations. Far from the interface the polymers follow isotropic random walks with . Near the interface is strongly suppressed because immiscibility eliminates paths that take polymers too far into the other phase. The values of and are nearly unaffected by this constraint, but show a small rise that is comparable to our statistical noise. The value of does not attain its bulk level until the center of mass is far enough from the interface that chains are unlikely to reach it. This distance is comparable to the bulk value of , which is larger than the range over which the density changes (Fig. 1).
Panel (b) of Fig. 5 shows the mean square components of at the third lowest shear rate in Fig. 3. Surprisingly, although the viscosity is nearly indistinguishable from the low shear rate limit, there is a substantial change in conformation. The component along the flow direction, , increases by about 25% throughout the system. The bulk value of drops by about 10%, while the interfacial value is nearly unchanged. This is consistent with the observation that the interface shear thins at higher shear rates than the bulk.
Conformation changes at much higher shear rates are illustrated in Fig. 6. Here the mean square and components of the end-to-end vector are plotted as a function of center of mass height for , , and four values of . As expected, chains in the bulk regions are stretched and aligned along the flow direction. At the lowest shear rate, the bulk value of is about 20% above its equilibrium value. At the highest shear rate, the length of the polymer along the flow direction has grown to about 40% of the fully extended length. The components orthogonal to the flow decrease. The drop in is much larger than that in , which drops from about 17 to 10 over the studied range of . Overall there is a net increase in from about 50 to 180, because the increase in is much larger than the decrease in the other two components.
Chains in the interfacial region also stretch along the flow direction and contract in the orthogonal directions. However, as with the viscosity, the shear rate dependence is shifted to higher at the interface. The value of is initially slightly higher at the interface and increases more slowly with , leading to a pronounced dip at the highest shear rates. In contrast, the dip in at the interface decreases with increasing shear rate because the bulk value drops more rapidly with .
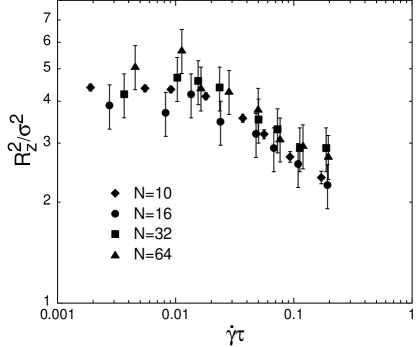
Fig. 7 provides a more detailed picture of the variation in the conformation of chains near the interface with increasing shear rate. Interfacial values of are plotted against shear rate for 32, and 64 at . Bulk values for chains with length equal to the inferred value of are shown for comparison. All curves are flat at low shear rates, and begin to decrease at the point where the interfacial viscosity begins to fall in Fig. 4. As with the data for , the interfacial conformations for all chain lengths collapse on to a universal curve that coincides with the bulk curve for chains of length within our errorbars. This provides further evidence that a single time scale corresponding to controls the behavior of the interface. Note that the uncertainties are larger for interfacial values due to the relatively low number of polymers whose center of mass lies at the interface. As discussed previously[12, 26], there is a preponderance of chain ends at the interface. This reduces the number of chain centers at the interface by a factor of three for the parameters considered here.
The idea that relaxation times should scale with the length of a subset of the chain rather than its entire length is related to other recent work[27]. These papers have examined changes in the conformation of individual chains pulled through gels or other polymers. Segments at the free end of the chain are assumed to relax with a time scale that is characteristic of bulk polymers with the same length as the segment. Since the relaxation time grows with the length of the segment, the polymer is less relaxed and more stretched as one moves away from the free end toward the pulling end.
A similar phenomenon should occur within individual chains in a sheared polymer melt. Segments at the end of the chain will be more relaxed than the center leading to a dumbbell configuration that narrows in the center. In addition, the ends should begin to stretch at higher shear rates than the center because their characteristic relaxation time is shorter. Fig. 8 shows the end-to-end distance of segments of length as a function of shear rate. Results for the two end-segments are averaged and compared to a segment in the middle of the chain. Note that the ends show the same behavior for all indicating that the characteristic relaxation time for their conformations is only a function of segment length. In contrast, the middle segment becomes more stretched as increases and the characteristic rate at which it can no longer relax decreases with increasing . These effects are reminiscent of a nematic coupling effect seen recently in polymers, where the orientation of middle segments also relaxed more slowly with increasing , while the rapid relaxation of ends was independent of [28].
IV Summary and Discussion
In this paper we have examined shear thinning and conformational changes in the bulk and interfacial regions of a phase-separated binary blend of Rouse chains. The bulk behavior is consistent with previous studies. The most surprising result is that pronounced elongation of the chains is observed before there is a noticeable change in viscosity. The onset of significant changes in seems more closely connected to the contraction along the gradient direction, which becomes appreciable at higher shear rates than the elongation along the flow direction.
The changes in interfacial viscosity are consistent with the prediction [10, 11] that the interfacial viscosity is determined entirely by the characteristic length of loops that cross the interface between immiscible polymers. This length is determined by the degree of immiscibility and independent of for the polymers studied here. The interfacial viscosity shows these same trends. For each degree of immiscibility, plots of interfacial viscosity against interfacial shear rate for different collapse onto a single curve. The entire curve coincides with the bulk shear thinning behavior of polymers of length for and for . Thus a single effective chain length describes both the Newtonian value of and its shear thinning behavior. Our previous work showed that the same effective chain length described the width of equilibrium interfaces.[12]
The suppression of the viscosity near the interface (Fig. 2) leads to an effective slip boundary condition [10, 11, 12]. The amount of slip is most pronounced in the Newtonian limit where the difference between and is largest. As the bulk viscosity begins to shear thin, the amount of slip decreases. Once the shear rate is high enough to produce significant shear thinning at the interface, the bulk and interfacial viscosities converge (Fig. 4). In this limit the amount of slip is negligible.
Changes in the conformation of polymers near the interface were also studied. In equilibrium, the interface suppresses the component of the end-to-end vector perpendicular to the interface, but has little effect on the in-plane components. The changes in interfacial viscosity are most closely correlated with changes in the perpendicular component. Like , plots of against shear rate for different chain lengths collapse onto a common curve that is consistent with that for bulk chains of length (Fig. 7). While the elongation increases more slowly near the interface than in the bulk, it begins at much lower shear rates than the change in interfacial viscosity (i.e. Fig. 5) and depends on chain length. Thus our results for both the bulk and interface indicate that polymer contraction perpendicular to the interface is the most important structural change associated with shear thinning.
We also explored changes in the conformation of segments of 4 beads within longer chains as a function of shear rate. Segments in the center of the chains began to elongate at the same shear rate where the bulk viscosity for the given chain length showed shear thinning. However, the conformation of the ends remained unchanged until much higher shear rates. Moreover, the conformation of the ends was nearly independent of the total chain length and their shear thinning behavior was comparable to that for bulk chains with length 4. Recent studies of much longer chains have used the concept of a position dependent relaxation time to determine the conformation of a single chain in a solvent or gel [27]. Our study shows that the same concept applies to polymer melts.
V Acknowledgements
Support from the Semiconductor Research Corporation through AMD Custom Funding and from National Science Foundation Grant No. DMR 0083286 is gratefully acknowledged.
REFERENCES
- [1] W. Carl, Macromol. Theory Simul., 3 705 (1994).
- [2] F. Ganazzoli and A. Tacconelli, Macromol. Theory Simul., 7 79 (1998).
- [3] A. N. Semenov, A. V. Subbotin, G. Hadziioannou, G. Ten Brinke, E. Manias and M Doi, Macromol. Symp. 121, 175 (1997).
- [4] T. W. Liu, J. Chem. Phys. 90 5826 (1989).
- [5] J. J. López Cascales, S. Navarro and J. García de la Torre, Macromolecules 25, 3574 (1992).
- [6] P. J. Daivis and D. J. Evans, J. Chem. Phys. 100 541 (1994).
- [7] Z. Xu, J. J. de Pablo, and S. Kim, J. Chem. Phys. 102 5836 (1995).
- [8] A. V. Lyulin, D. B. Adolf, and G. R. Davies, J. Chem. Phys. 111, 758 (1999).
- [9] P. Flory, Principles of Polymer Chemistry (Cornell University Press, Ithaca, 1953).
- [10] F. Brouchard-Wyart, P.G. de Gennes, and S. Troian, C.R. Acad. Sci (Paris), 308 II, 1401 (1989); P.G. de Gennes in Physics of Surfaces and Interfaces, ed. I. C. Sanchez (Butterworth-Heinmann, Boston, 1992)
- [11] J. L. Goveas and G.H. Fredrickson, Eur. Phys. J. B, 2 79 (1998).
- [12] S. Barsky and M. O. Robbins, Phys. Rev. E 63 ref. 0211801 (2001).
- [13] P. A. Thompson and M. O. Robbins, Phys. Rev. A 41, 6830 (1990).
- [14] P. A. Thompson and S. M. Troian, Nature 389, 360 (1997).
- [15] K. Kremer and G.S. Grest, J. Chem. Phys. 92, 5057 (1990).
- [16] G. S. Grest, M.-D. Lacasse, K. Kremer, and A. M. Gupta, J. Chem. Phys. 105 10583 (1996); M.-D. Lacasse, G. S. Grest and A. J. Levine, Phys. Rev. Lett. 80 309 (1998).
- [17] R. Khare, J. J. de Pablo, and A. Yethiraj, Macromolecules 29 7910 (1996).
- [18] A. Jabbarzadeh, J. D. Atkinson and R. I. Tanner, J. Chem. Phys. 110 2612 (1999).
- [19] K. B. Migler, H. Hervet and L. Leger, Phys. Rev. Lett. 70 287 (1993).
- [20] M. Allen and D. Tildesley, Computer Simulations of Liquids,(Oxford University Press, Oxford, 1987).
- [21] M. J. Stevens and M. O. Robbins, Phys. Rev. E48, 3778 (1993).
- [22] S. S. Sarman, D. J. Evans and P. T. Cummings, Phys. Rep. 305, 1 (1998).
- [23] E. Helfand and Y. Tagami, J. Chem. Phys. 56, 3592 (1971).
- [24] H. Furukawa, Phys. Rev. A 40, 6403 (1989).
- [25] M. Doi and S.F. Edwards, The Theory of Polymer Dynamics (Clarendon, Oxford, 1986).
- [26] E. Helfand, S. M. Bhattacharjee, and G. H. Fredrickson, J. Chem. Phys. 91 7200 (1989).
- [27] F. Brochard-Wyart, Europhys. Lett. 23, 105 (1993); 30, 387 (1995). A. Adjari, F. Brochard-Wyart, P. G. de Gennes, L. Leibler, J.-L. Viovy, and M. Rubinstein, Physica A 204, 17 (1994).
- [28] S. Barsky and G. Slater, Macromolecules 32 6348 (1999).
| .00159 | |||||
| .00479 | |||||