Optical studies of charge dynamics in c-axis oriented superconducting MgB2 films
Abstract
Temperature dependent optical conductivities and DC resistivity of c-axis oriented superconducting (Tc = 39.6 K) MgB2 films ( nm) have been measured. The normal state ab-plane optical conductivities can be described by the Drude model with a temperature independent Drude plasma frequency of cm-1 or eV. The normal state resistivity is fitted by the Bloch-Grüneisen formula with an electron-phonon coupling constant . The optical conductivity spectra below Tc of these films suggest that MgB2 is a multi-gap superconductor.
pacs:
PACS: 74.25.Gz, 74.76.Db, 74.25.KcThe recent discovery of superconductivity in MgB2 with Tc of 39 K has generated much scientific interest [2]. As in the case of the high-Tc cuprates, debate rages as to the mechanism of superconductivity in this material. Initial isotope effect measurements suggested electron-phonon coupling as the pairing mechanism for superconductivity in MgB2 [3, 4]. Many theoretical studies [5, 6, 7, 8] since then have concluded that strong electron-phonon coupling is responsible for the high transition temperature, with . However, other pairing mechanisms have also been proposed, e.g. ‘dressing’ and ‘undressing’ of holes [9], acoustic plasmons [10] and the ‘filamentary’ thoery [11]. This inconclusive state of affairs is mainly due to the lack of consensus on many important physical quantities in MgB2. For example, the reported values for the superconducting gap vary from 4 meV [12] to 15 meV [13]. Infrared spectroscopy is able to measure such quantities as the scattering rate , the Drude plasma frequency and [14]. In this work, we analyze the optical data of MgB2 to determine the electron-phonon coupling constant, , in a similar fashion as in the optical study [15] of Ba0.6K0.4BiO3 (T K), where was obtained experimentally.
There have been very few optical studies on MgB2 to date. Gorshonov et al. [16] measured the reflectance of a polycrystalline pellet using the grazing angle method and set a lower limit of to be meV. Pronin et al. [17] examined the complex optical conductivity of a MgB2 thin film in the frequency range of meV. More recently, Jung et al. [18] carried out transmission measurements on a c-axis oriented MgB2 film ( nm) with T K and fitted the data with a gap value of meV. However, to obtain the optical constants of bulk MgB2 in a wide frequency region, reflectivity measurements are the preferred method.
In this Letter, temperature dependent optical conductivities and DC resistivity of c-axis oriented superconducting (T K) MgB2 films ( nm) are reported. The normal state ab-plane optical conductivities can be well described by the Drude model with cm-1. Using this plasma frequency is determined by fitting the DC resistivity data. In addition, the optical conductivities in the superconducting state exhibit complex behavior suggesting that MgB2 is a multi-gap superconductor.
For this study, several c-axis oriented MgB2 films are used: one very thin film ( nm) similar to the film studied by Jung et al. [18] and two thicker films ( nm). These high-quality c-axis oriented films were deposited on c-cut Al2O3 substrates using a pulsed laser deposition method as described previously [19]. X-ray measurements showed that the MgB2 grains were highly oriented with their c-axes normal to the substrate. These MgB2 films have a tan appearance, similar to the high purity MgB2 polycrystalline samples [3]. The thick MgB2 films ( nm) are opaque in the visible region.
The Al2O3 substrates with the MgB2 films are mounted on an optically-black cone, and the temperature dependent reflectance is measured in a near-normal-incidence arrangement from to over cm-1, with the electric field parallel to the ab-plane on Bruker IFS 66v/S and 113v spectrometers. The absolute reflectance is determined by evaporating a gold film in situ in ultra-high vacuum ( Torr). The details of this technique have been described previously [20]. The optical conductivities are then determined from a Kramers-Kronig analysis of the reflectance.
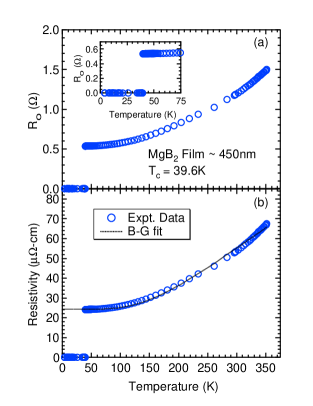
In Fig. 1(a), the temperature dependent DC sheet resistance, R□, measured by a standard four-probe technique of a MgB2 film ( nm) is shown. The residual resistance ratio (RRR) of R□ at 295 K and at 40 K is 2.2. The low temperature region near Tc is given in the insert of Fig. 1(a). The superconducting transition in this film is extremely sharp with a transition region of K and a Tc of 39.6 K indicating that these thick MgB2 films are of excellent quality [19].
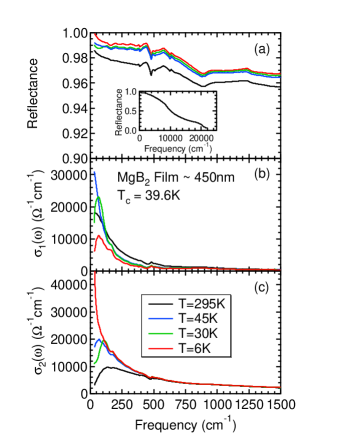
The raw data of the optical measurements on these MgB2 films ( nm) are summarized in Fig. 2. The absolute reflectance is quite high as shown in Fig. 2(a), however, several sharp phonon features can be clearly identified. As a comparison, the reflectance of the thin MgB2 film ( nm) is also measured. The two strong infrared active TO-phonons of c-cut Al2O3 crystals at 440 and 570 cm-1 [21] can be easily observed for the thin MgB2 film but completely absent in the reflectance data of the thick films ( nm), indicating that the thick films are totally opaque. Therefore, the ab-plane optical properties measured for these MgB2 films ( nm) are intrinsic. In the insert, the reflectance data at 295 K is given for the entire frequency region: from 30 to cm-1. The largest possible frequency interval is needed to carry out a reliable Kramers-Kronig analysis. The results of such an analysis are shown as temperature dependent in Fig. 2(b) and in Fig. 2(c). Superconducting behavior can be easily identified as a drop in at low frequencies below Tc.
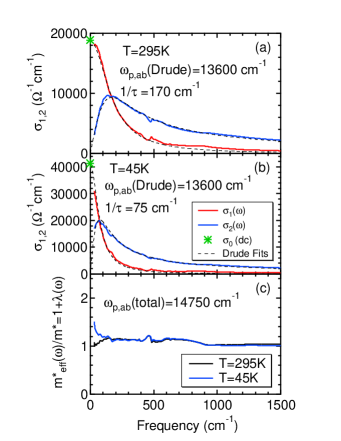
The normal state optical conductivities of these MgB2 films are analyzed in Fig. 3. In Fig. 3(a), and at 295 K are shown. Both the real and imaginary parts of the optical conductivities at low frequencies can be well described by the simple Drude model of the form:
| (1) |
where is the Drude plasma frequency, is the scattering rate, is the number of free-carriers per unit volume and is the average effective mass of the occupied carrier states. The Drude model describes the experimental data surprisingly well at 295 K. The fitting parameters have the values cm-1, and cm-1. This Drude plasma frequency of cm-1 is quite consistent with the value obtained from an optical study of a polycrystalline MgB2 sample [22]. However, in addition to the Drude peak, some other contributions to are also observed in that optical study [22]. Using the optical data, one can determine the DC resistivity to be -cm at 295 K. Thus, the averaged thickness of this MgB2 film is derived as R□ = nm which agrees very well with the typical thickness of 400 nm of these films [19]. The DC resistivity can now be plotted as shown in Fig. 1(b). It is interesting that the experimental Drude plasma frequency of 1.68 eV is much smaller than the value of eV predicted by calculations of the electronic structure in MgB2 [5, 6, 7, 8]. These calculations usually give values of Drude plasma frequencies that are reasonably close to experimental values, even in highly correlated systems like high Tc cuprates [23].
Keeping the same, the optical conductivities at 45 K are fitted with Eq. (1). The results are given in Fig. 3(b). Both and again fit well with the Drude model with a scattering rate of cm-1. In addition, the DC resistivity at 45 K is in good agreement with the zero frequency extrapolation of . Therefore, the DC conductivity and real part the optical conductivity are in excellent agreement.
From the ab-plane optical data, one can calculate the frequency dependent electron-phonon coupling constant in the extended Drude formalism [24]:
| (2) |
where is the total plasma frequency of free ab-plane carriers. The purpose of casting the optical data in the extended Drude form is to account for the small deviations from the simple Drude model by using a frequency dependent scattering rate . The result of this analysis is shown in Fig. 3(c). The value of derived optically varies from 0 to about 0.2 in the optical phonon region, where cm-1 is derived from the conductivity sum rule. The value of is slightly larger than due to the fact that the sum rule captures addtional spectral weight in the high frequency region.
The electron-phonon coupling constant is traditionally determined from the temperature dependent DC resistivity using the Bloch-Grüneisen formula
| (3) |
with three parameters: - the residual resistivity at ; - the Debye temperature and . A non-linear least squares fit to the resistivity data with the Eq. (3) is given in Fig. 1(b) using eV. The experimental curve and the theoretical fit agree quite well with the fitting parameters: -cm; K and . The value K is consistent with the experimentally measured value that varies from 800 K [25] to 1050 K [26]. However, is significantly smaller than most theoretical predictions of [5, 6, 7, 8] in MgB2.
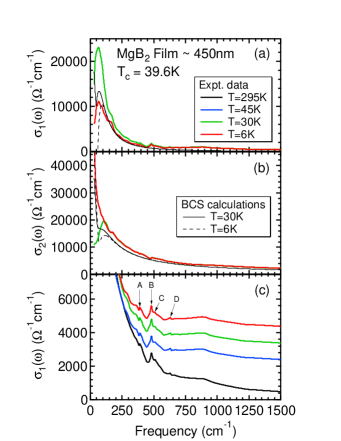
The optical conductivities of these MgB2 films in the superconducting state are examined in Fig. 4. The superfluid plasma frequency is found to be cm-1 at 6 K from the Ferrel-Glover-Tinkham sum rule. However, the optical spectra below Tc cannot be fitted by the BCS model using a single isotropic gap. Theoretical curves at 30 K and 6 K generated with a BCS model [27] are shown in Figs. 4(a) and 4(b). The parameters used are: cm-1 and cm-1. There are significant deviations between the experimental data and the BCS calculations. However, from our optical data the upper and lower limits of the superconducting gap can be estimated: 5 meV meV. The complex gap behavior observed in our optical conductivity data in the superconducting state adds support to the suggestion that MgB2 is a multi-gap superconductor [6, 13, 26].
Four sharp phonon peaks can be identified in as shown in Fig. 4(c) that can be assigned to -point optical phonons in MgB2 [5]. The two strong phonon peaks marked as A and B are the two infrared active lattice modes: at 380 cm-1 () and at 480 cm-1 (). Their relatively large oscillator strengths are the consequence of the low plasma frequency in MgB2. Two weak phonon peaks marked as C and D at 510 cm-1 and 630 cm-1 are tentatively assigned as the Raman active mode and the silent mode according to the phonon calculations [5]. These two phonons with even symmetry become infrared active because of the lattice imperfections in the films. Alternatively, several Raman studies [28] on MgB2 have assigned a very broad band centered at 620 cm-1 as the mode. In addition, three broad features are also observed at 160, 880 and 1240 cm-1 in . The resolution of this optical study is 4 cm-1 in the phonon region, and none of the four sharp phonon modes exhibit detectable changes in either their intensities, peak positions, or line-widths going through Tc.
The surprising aspect of our results is the small value of derived from both the DC resistivity and optical conductivity measurements. A simple application of McMillan formula [29] with will give T K. However, there are several reasons why the BCS theory should not be abandoned right way for MgB2: 1) the superconducting gap in MgB2 has unusual properties. Gap anisotropy including dimensional effects [30] modifies Tc relative to the McMillan formula; 2) the value that goes into the McMillan formula can differ somewhat with respect to [31]; 3) c-axis optical and transport properties should be experimentally studied. On the other hand, given the small value of alternative mechanisms of superconductivity in MgB2 should be examined both experimentally and theoretically. It is interesting to note that many of the optical constants in MgB2 are quite similar to those in Ba0.6K0.4BiO3 [15], e.g. the scattering rate, the Drude plasma frequency, and particularly the small value of . A common mechanism might be responsible for superconductivity in both systems. In addition, having a small free-carrier plasma frequency ( eV) seems to be an universal characteristic shared by almost all superconductors with a T K.
In conclusion, we have measured optical conductivities and DC resistivity of c-axis oriented superconducting MgB2 films. With a Drude plasma frequency of cm-1, is determined from DC resistivity data. The small measured value poses a serious problem to the strong electron-phonon coupling picture. Other theoretical models need to be explored to account both for the complex behavior of the superconducting gap and possible different pairing mechanism in MgB2.
We thank P.C. Canfield, V.J. Emery, J.E.Hirsch, P.D. Johnson, S.A. Kivelson, G. Schneider, T. Valla, T. Vogt, and Z. Yusof for helpful discussions. Part of the work was supported by the U.S. Department of Energy under Contract No. DE-AC02-98CH10886 and the other part by the Ministry of Science and Technology of Korea through the Creative Research Initiative Program. Research undertaken at NSLS was supported by the U.S. DOE, Division of Materials and Chemical Sciences.
REFERENCES
- [1] Electronic address: jtu@bnl.gov
- [2] J. Nagamatsu et al., Nature (London) 410, 63 (2001).
- [3] S.L. Bud’ko et al., Phys. Rev. Lett.86, 1877 (2001).
- [4] D.G. Hinks, H. Claus, and J.D. Jorgensen, cond-mat/0104242.
- [5] J. Kortus et al., Phys. Rev. Lett.86, 4656 (2001).
- [6] A.Y. Liu, I.I. Mazin, and J. Kortus, cond-mat/0103570.
- [7] Y. Kong, O.V. Dolgov, O. Jepsen, and O.K. Anderson, Phys. Rev. B64, 020501(R) (2001).
- [8] J.M. An and W.E. Pickett, Phys. Rev. Lett.86, 4366 (2001).
- [9] J.E. Hirsh and F. Marsiglio, cond-mat/0102479.
- [10] K. Voelker, V.I. Anisimov, and T.M. Rice, cond-mat/0103082.
- [11] J.C. Phillips and J. Jung, cond-mat/0102261.
- [12] G. Rubio-Bollinger, H. Suderow, and S. Vieira, Phys. Rev. Lett.86, 5582 (2001).
- [13] F. Giubileo et al., cond-mat/01045146.
- [14] M. Tinkham, Introduction to Superconductivity (Krieger, Malabar, 1975); B. Farnworth and T. Timusk, Phys. Rev. B10, 5119 (1976); F. Gao et al., Phys. Rev. B54, 700 (1996).
- [15] A.V. Puchkov, T. Timusk, W.D. Mosley, and R.N. Shelton, Phys. Rev. B50, 4144 (1994).
- [16] B. Gorshunov et al., cond-mat/0103164.
- [17] A.V. Pronin, A. Pimenov, A. Loidl, and S.I. Kransnosvobodtsev, cond-mat/0104291.
- [18] J.H. Jung et al., cond-mat/0105180.
- [19] W.N. Kang et al., Science 292, 1521 (2001).
- [20] C.C. Homes, M. Reedyk, D. Crandles, and T. Timusk, Appl. Opt. 32, 2972 (1993).
- [21] A.S. Barker, Phys. Rev. 132, 1474 (1963).
- [22] A. B. Kuz’menko et al., in Sixth International Conference on Spectroscopy of Novel Superconductors, edited by A. Bansil (Elsevier, Chicago, 2001), p. 51 (poster P28).
- [23] W.E. Pickett, P.B. Allen, and H. Krakauer, Phys. Rev. B37, 7482 (1988).
- [24] A.V. Puchkov, D.N. Basov, and T. Timusk, J. Phys. C 8, (1996).
- [25] R.K. Kremer, B.J. Gibson, and K. Ahn, cond-mat/0102432.
- [26] F. Bouquet et al., cond-mat/0104206.
- [27] W. Zimmermann et al., Physica C 183, 99 (1991).
- [28] X. K. Chen et al., cond-mat/0104005; A.F. Goncharov et al., cond-mat/0104042; J. Hlinka et al., cond-mat/0105275.
- [29] W.L. McMillan, Phys. Rev. 167, 331 (1968); P.B. Allen and R.C. Dynes, Phys. Rev. B 12, 905 (1975).
- [30] P.B. Allen, Z. Phys. B 47, 45 (1982) (and references therein).
- [31] P.B. Allen, in Handbook of Superconductivity, edited by C.P. Poole (Academic, San Diego, 2000), p. 478.