Bursts in a fiber bundle model with continuous damage
Abstract
We study the constitutive behaviour, the damage process, and the properties of bursts in the continuous damage fiber bundle model introduced recently. Depending on its two parameters, the model provides various types of constitutive behaviours including also macroscopic plasticity. Analytic results are obtained to characterize the damage process along the plastic plateau under strain controlled loading, furthermore, for stress controlled experiments we develop a simulation technique and explore numerically the distribution of bursts of fiber breaks assuming infinite range of interaction. Simulations revealed that under certain conditions power law distribution of bursts arises with an exponent significantly different from the mean field exponent . A phase diagram of the model characterizing the possible burst distributions is constructed.
PACS number(s): 46.50.+a, 62.20.Fe, 62.20.Mk
I introduction
Recently, the breakdown of disordered materials under externally imposed stresses has attracted much attention and by now several aspects of the breakdown process are well understood [1, 2]. The possibilities of pure analytical approaches for breakdown phenomena are rather limited, hence, computer simulation is an indispensable tool in this field. Models, computer simulations are based on, can be classified as lattice models and fiber bundle models. In lattice models the elastic medium is represented by a spring (beam) network, and disorder is captured either by random dilution or by assigning random failure thresholds to the bonds [1]. The failure rule usually applied in lattice models is discontinuous and irreversible: when the local load exceeds the failure threshold of a bond, the bond is removed from the calculations (i.e. its elastic modulus is set to zero).
A very important class of models of material failure are the fiber bundle models (FBM) [3, 4, 5, 6, 7, 8, 9, 10, 11, 12, 13, 14, 15, 16, 17, 18, 19, 20, 21, 22, 23, 24, 25, 26, 27, 28, 29, 30, 31, 32, 33, 34], which have been extensively studied during the past years. These models consists of a set of parallel fibers having statistically distributed strength. The sample is loaded parallel to the fibers direction, and the fibers fail if the load on them exceeds their threshold value. In stress controlled experiments, after each fiber failure the load carried by the broken fiber is redistributed among the intact ones. The behaviour of a fiber bundle under external loading strongly depends on the range of interaction, i.e. on the range of load sharing among fibers. Exact analytic results on FBM have been achieved in the framework of the mean field approach, or global load sharing, which means that after each fiber breaking the stress is equally distributed on the intact fibers implying an infinite range of interaction and a neglect of stress enhancement in the vicinity of failed regions [3, 4, 5, 6, 7, 8, 9, 10, 11, 12, 13, 14, 15, 16, 17, 26, 27, 28]. In spite of their simplicity FBM’s capture the most important aspects of material damage and they provide a deep insight into the fracture process. Over the past years several extensions of FBM have been carried out by considering stress localization (local load transfer) [9, 14, 15, 19, 32, 33, 34], the effect of matrix material between fibers [14, 15, 16, 17, 26, 27, 28], possible non-linear behavior of fibers [5], thermally activated breakdown [10] of fibers, and coupling to an elastic block [25].
Very recently, a novel continuous damage law has been introduced in lattice models [35] of fracture. In this model when the failure threshold of a lattice bond is exceeded the elastic modulus of the bond is reduced by a factor (), furthermore, multiple failures of bonds are allowed. Simulations revealed that under strain controlled loading the system develops into a self organized state, which is macroscopically plastic, and is characterized by a power law distribution of avalanches of breaks. We worked out an extensions of fiber bundle models by implementing a continuous damage law for the fibers [12], in the spirit of Ref. [35]. It has been demonstrated in Ref. [12] that the continuous damage fiber bundle model (CDFBM) provides a broad spectrum of description of materials varying its parameters and for certain parameter settings the model recovers the variants of FBM known in the literature. CDFBM can be relevant for materials where the microscopic damage mechanism is gradual multiple failure of components, i.e. matrix and fibers [39, 41]. Very recently, the CDFBM was further developed by Moral et al. taking into account time dependence in the failure process [13].
One of the most appealing results on CDFBM was that the multiple failure of brittle elements can give rise to a macroscopic plastic behaviour of the specimen, which is then followed by a hardening or softening regime, furthermore, under certain conditions damage localization occurs. However, the microscopic damage process of CDFBM has not been explored. The main goal of the present paper is to reveal the microscopic failure process in order to understand the emergence of the plastic macroscopic state. Analytic results are obtained to characterize the damage process along the plateau under strain controlled loading, furthermore, for stress controlled experiments we develop a simulation technique and explore numerically the distribution of bursts of fiber breaks. The effect of localization on the process of damage is clarified. A phase diagram of the model characterizing the possible constitutive behaviours and burst distributions is constructed in terms of the two parameters of the model.
II model
The continuous damage fiber bundle model is an extension of the commonly used fiber bundle models by generalizing the damage law of fibers. The model system is composed of parallel fibers with identical Young-modulus but with random failure thresholds , . The failure strength of individual fibers is an independent identically distributed random variable with a probability density and a cumulative probability distribution . The fibers are assumed to have linear elastic behaviour up to breaking (brittle failure). Under uniaxial loading of the specimen a fiber fails if it experiences a load larger than its breaking threshold . In the framework of our model at the failure point the stiffness of the fiber gets reduced by a factor , where , i.e. the stiffness of the fiber after failure is . In principle, a fiber can now fail more than once and the maximum number of failures allowed for fibers is a parameter of the model. Once a fiber has failed its damage threshold can either be kept constant for the further breakings (quenched disorder) or new failure thresholds of the same distribution can be chosen (annealed disorder), which can model some microscopic rearrangement of the material after failure. The damage law of the model is illustrated in Fig. 1 for both types of disorder. The characterization of damage by a continuous parameter corresponds to describe the system on length scales larger than the typical crack size. This can be interpreted such that the smallest elements of the model are fibers and the continuous damage is due to cracking inside fibers. However, the model can also be considered as the discretization of the system on length scales larger than the size of single fibers, so that one element of the model consists of a collection of fibers with matrix material in between. In this case the microscopic damage mechanism resulting in multiple failure of the elements is the gradual cracking of matrix and the breaking of fibers. In the following we refer to the elements of the continuous damage FBM as fibers, but we have the above two possible interpretations in mind.

After failure the fiber skips a certain amount of load which has to be taken by the other fibers. For the load redistribution we assume infinite range of interaction among fibers (mean field approach), furthermore, equal strain condition is imposed which implies that stiffer fibers of the system carry more load. At a strain the load of fiber that has failed times reads as
| (1) |
where is the actual stiffness of fiber . It is important to note that, in spite of the infinite interaction range, Eq. (1) is different from the usual global load sharing where all the intact fibers carry always the same amount of load. In the following the initial fiber stiffness will be set to unity.
III constitutive laws
Here we provide a derivation of the constitutive law of the continuous damage FBM in a more transparent way than in Ref. [12]. This general theoretical framework facilitates to obtain analytic results also for the microscopic failure process. The key quantity is the probability that during the loading of a specimen an arbitrarily chosen fiber failed precisely -times at a strain , where denotes the failure index, and is assigned to the intact fibers. can be cast in the following form for annealed disorder
| (2) | |||||
| for | (3) | ||||
| and | (4) |
and for quenched disorder
| (5) | |||
| (6) | |||
| (7) |
It can be easily seen that the probabilities Eqs. (2,5) fulfill the normalization condition . Average quantities of the fiber ensemble during a loading process can be calculated using the probabilities Eqs. (2,5). For instance, the average load on a fiber at a given strain reads as
| (8) |
which provides the macroscopic constitutive behaviour of the model, and the expression in the brackets can be considered as the macroscopic effective Young modulus of the sample (). The single terms in the sum give the load carried by the subset of fibers of failure index . The variants of fiber bundle models used widespread in the literature can be recovered by special choices of the parameters and of the model. A micromechanical model of composites [16, 17, 20, 21] can be obtained with the parameter values ,
| (9) |
while setting , , i.e. skipping the second term in Eq. (9) results in the classical dry bundle model of Daniels [3].
In Fig. 2 we show the explicit form of the constitutive law with annealed disorder for different values of in the case of the Weibull distribution
| (10) |
where is the Weibull modulus and denotes the characteristic strength of fibers. The parameter values are set to , in all the calculations.
Note that in the constitutive equation Eq. (8) the term of the highest failure index can be conceived such that the fibers have a residual stiffness of after having failed times. This residual stiffness results in a hardening of the material, hence, the curves in Fig. 2(a) asymptotically tend to straight lines with a slope . Increasing the hardening part of the constitutive behavior is preceded by a longer and longer plastic plateau, and in the limiting case of the materials behavior becomes completely plastic. A similar plateau and asymptotic linear hardening has been observed in brittle matrix composites, where the multiple cracking of matrix turned to be responsible for the relatively broad plateau of the constitutive behavior, and the asymptotic linear part is due to the linear elastic behavior of fibers remained intact after matrix cracking [39].

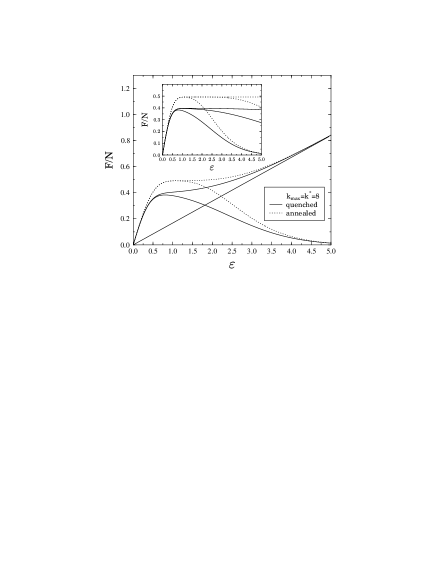
In order to describe macroscopic cracking and global failure of a specimen instead of hardening, the residual stiffness of the fibers has to be set to zero after a maximum number of allowed failures [12, 35]. In this case the constitutive law can be obtained from the general form Eq. (8) by replacing in the upper limit of the sum by . A comparison of the constitutive laws of the dry and continuous damage FBM with global failure is presented in Fig. 2(b). One can observe that the dry FBM constitutive law has a relatively sharp maximum, while the continuous damage FBM curves exhibit a plateau whose length increases with increasing . Note that the maximum value of corresponds to the macroscopic strength of the material, furthermore, in stress controlled experiments the plateau and the decreasing part of the curves cannot be reached. However, by controlling the strain , the plateau and the decreasing regime can also be realized. The value of the driving stress corresponding to the plastic plateau, and the length of the plateau are determined by the damage parameter , and by , : Decreasing at a fixed , or increasing at a fixed give rise to an increase of the plateau’s length.
In Fig. 3 we compare the constitutive laws of the model with different types of disorder for hardening and softening of fibers. It can be seen that there is no qualitative difference between the curves of annealed and quenched disorder, however, the inset shows that when the fibers do not have residual stiffness (softening) the local shape of the curves around the maximum is different. The different types of maxima of the constitutive curve of the two different disorders result in a very interesting behaviour of the burst distributions, which will be discussed later.
IV Damage
The damage state of the model at a certain can be characterized by the average number of failures occurred. Based on the probabilities Eqs. (2,5), we introduce a damage variable as
| (11) |
which is an integral quantity of the damage process. From the properties of it can be seen that is a monotonically increasing function, and . Then the average number of failures can be obtained as . Fig. 4 illustrates the behaviour of for three different values of .
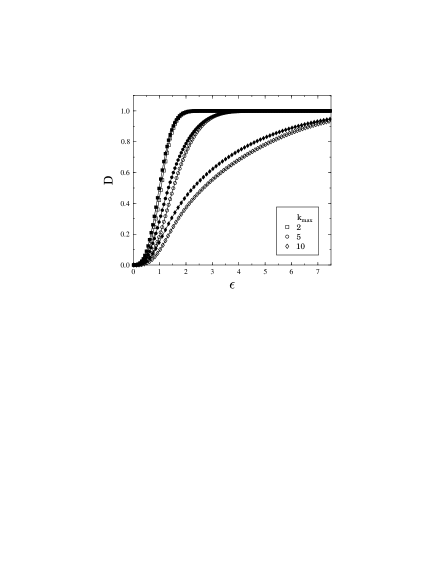
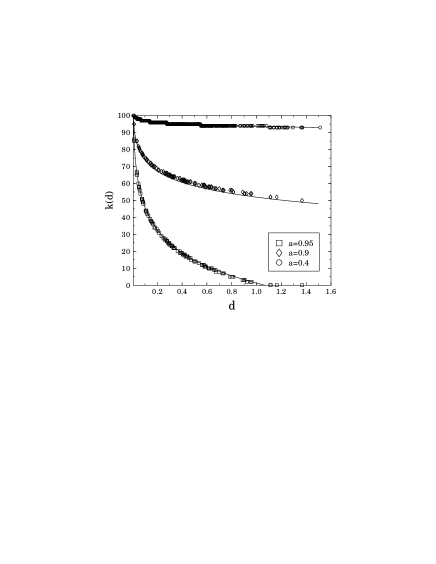
It can be observed in Fig. 4 that the overall behaviour of the damage variable is nearly the same for annealed and quenched disorder, however, there is a significant difference between the microscopic damage processes in the two cases. In spite of the infinite range of interaction among fibers, localization of damage occurs for the case of quenched disorder. It means that weaker fibers tend to break more often than the stronger ones. For quenched disorder, the strain where the weakest fiber of failure threshold reaches , is . Hence, at this loading stage the failure index of fibers as a function of the damage threshold can be obtained as
| (12) |
Localization of damage means that is a decreasing function of , and it can be seen from Eq. (12) that the localization gets more pronounced when the damage parameter . This localization effect is illustrated in Fig. 5, where the analytic result Eq. (12) is compared to simulations for three different values of .
V Distribution of bursts
One of the most interesting aspects of the damage mechanism of disordered solids is that the breakdown is preceded by an intensive precursor activity in the form of avalanches of microscopic breaking events [29, 30, 31, 38, 35]. Under a given external load a certain fraction of fibers fails immediately. Due to the load transfer from broken to intact fibers this primary fiber breaking may initiate secondary breaking that may also trigger a whole avalanche of breakings. If is large enough the avalanche does not stop and the material fails catastrophically. For the dry FBM it has been shown by analytic means that in the case of global load transfer the size distribution of avalanches follows asymptotically a universal power law with an exponent [29, 30, 38], however, in the case of local load transfer no universal behaviour exists, and the avalanche characteristic size is bounded [31]. This precursory activity can also be observed experimentally by means of the acoustic emission analysis. Acoustic emission measurements have revealed that for a broad variety of disordered materials the response to an increasing external load takes place in bursts having power law size distribution over a wide range [36, 37, 38].
Introducing a continuous damage law in lattice models, simulations revealed that under strain controlled conditions the system tends to a steady state, which is macroscopically plastic [35], similarly to our case. Due to the long range interaction, the plastic steady state is characterized by power law distributed avalanches of breaks and it has been argued that the underlying damage mechanism displays self organized criticality. In the following we study the distribution of bursts in our CDFBM under strain and stress controlled conditions.
A Strain controlled case
Under strain controlled conditions of fiber bundles there is no load transfer from broken to intact fibers since the load carried by each fiber is determined by the externally imposed strain and the local fiber stiffness according to Eq. (1). This implies that the number of fibers which break due to an infinitesimal increase of the external strain is completely determined by the statistics of fiber strength, i.e. by and . It has been discussed in Sec. III that the plastic plateau and the decreasing part of the constitutive law can only be realized in strain controlled experiments. To reveal the nature of ductility arising in our model it turns to be useful to study the statistics of bursts occurring under strain controlled conditions.
The basic quantity to characterize bursts is the probability that a fiber, which has failed times up to strain imposed externally, will fail again under an infinitesimal strain increment . From Eqs. (2,5) can be cast in the form for annealed disorder
| (13) | |||||
| (14) |
and for quenched disorder
| (15) |
and the total probability of fiber breaking can be obtained by summing over
| (16) |
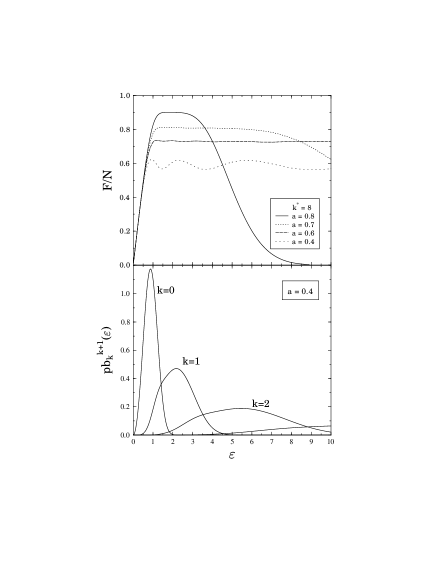
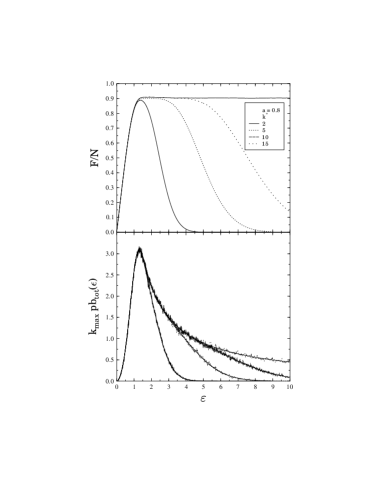
The number of fiber failures occurring in the strain interval can be obtained as . This is a very important characteristic quantity of the microscopic damage process since it can be monitored experimentally by means of acoustic emission techniques. The behaviour of is shown in Fig. 6 for the softening case with several values of , where also the corresponding constitutive curves are presented. It can be seen that has a maximum where the plastic regime of the constitutive curve starts, and it is a decreasing function of in the whole plastic region. Due to the stiffness reduction of the system caused by the subsequent failures, in the plastic regime the same increase of strain results in smaller and smaller load increments on fibers, and hence, and the number of failures decreases. It also implies that the breaking activity, which can be measured by acoustic emission techniques, decreases along the plateau in agreement with experiments [41, 42, 43].
It follows from the above argument that decreasing the value of the damage parameter while is kept fixed, the length of the plastic plateau, preceding the decreasing or hardening part of the constitutive behaviour, increases since larger strain is required to achieve successive failure. This is demonstrated in Fig. 7, where one can also see that for small the constitutive curve develops distinct maxima. In order to clarify the occurrence of these maxima in the plastic plateau, in Fig. 7 we also plotted for three different values of at . With decreasing the length of the plastic plateau increases, however, the consecutive maxima of get more and more separated giving rise to visible maxima in the plateau. The broader the disorder distribution is, the smaller the value of is where the maxima of appear.
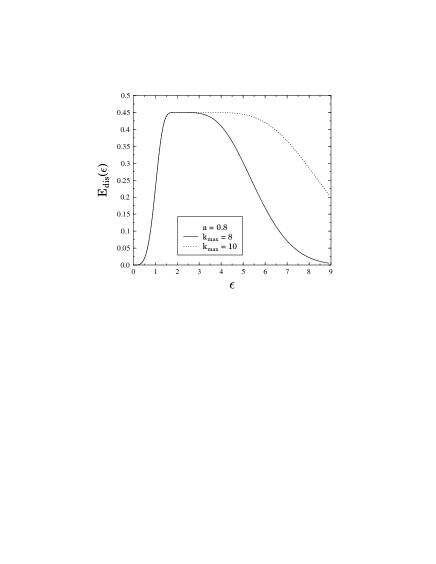
The energy dissipation rate is also a very important aspect of the ductile regime of the model. The energy dissipation rate is defined so that the energy dissipated due to the failure of fibers in the strain interval can be obtained as
| (17) |
where the expression in the bracket provides the energy dissipated by the failure of a fiber which has already failed -times. In Fig. 8 the energy dissipation rate is plotted for two different values of . Comparing Fig. 8 to the corresponding constitutive curves in Fig. 2 it can be observed that in the plastic regime is constant.
B Stress controlled case
Under stress controlled loading conditions the microscopic dynamics of the damage process is more complicated than in the strain controlled case, since the failure of each fiber is followed by a redistribution of load, which can provoke further fiber breakings resulting in an avalanche of failure events. Studying the statistics of avalanches under quasi-static loading of a specimen, important information can be gained about the dynamics of damage, which can be then compared to the results of acoustic emission experiments. Due to the difficulties of the analytic treatment, we develop a simulation technique and explore numerically the properties of bursts in our continuous damage fiber bundle model. The interaction of fibers, the way of load redistribution is crucial for the avalanche activity. A very important property of CDFBM is that in spite of the infinite range of interaction the load on intact fibers is not equal, but stiffer fibers cary more load, furthermore, for quenched disorder damage localization occurs, which might affect also the avalanche activity.
To implement the quasi-static loading of a specimen of fibers in the framework of CDFBM, the local load on the fibers has to be expressed in terms of the external driving . Making use of Eq. (1) it follows that
| (18) |
and hence, the strain and the local load on fibers can be obtained as
| (19) |
when the external load is controlled. The simulation of the quasi-static loading proceeds as follows: in a given stable state of the system we determine the load on the fibers from the external load using Eq. (19). The next fiber to break can be found as
| (20) |
i.e. that fiber breaks for which the ratio is the smallest. Here denotes the index of the fiber to break, is the damage threshold of fiber , and is the local load on it. To ensure that the local load of a fiber is proportional to its stiffness, the external load has to be increased in a multiplicative way, so that is imposed, and the failure index of fiber is increased by one . After the breaking of fiber , the load carried by the fibers has to be recalculated making use of Eq. (19), which provides also the correct load redistribution of the model. If there are fibers in the state obtained, whose load exceeds the local breaking threshold, they fail, i.e. their failure index is increased by 1 and the local load is again recalculated until a stable state is obtained. A fiber cannot break any longer if its failure index has reached or during the course of the simulations. This dynamics gives rise to a complex avalanche activity of fiber breaks, which is also affected by the type of disorder. The size of an avalanche is defined as the number of breakings initiated by a single failure due to an external load increment.
Simulations revealed that varying the two parameters of the model , or and the type of disorder, the CDFBM shows an interesting variety of avalanche activities, characterized by different shapes of the avalanche size distributions.
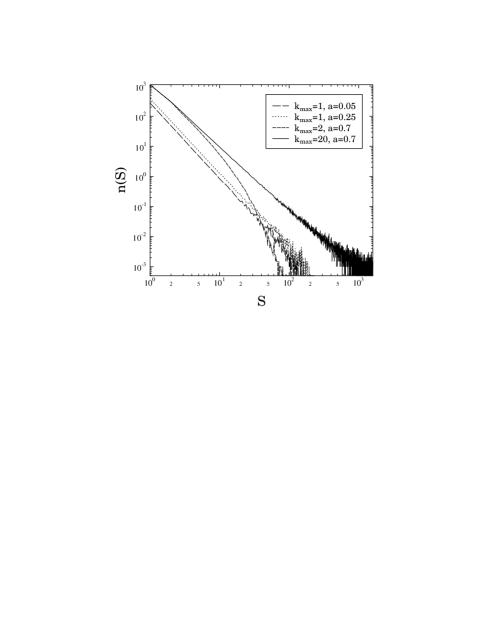
In Fig. 9 the histograms of the avalanche sizes are shown which were obtained for a system of remaining stiffness and annealed disorder with Weibull parameters , . Since in the limiting case of the CDFBM recovers the global load sharing dry fiber bundle model, in Fig. 9 the curves with small and are power laws with an exponent in agreement with the analytic results [29, 30]. Increasing the value of at a fixed only gives rise to a larger number of avalanches, i.e. parallel straight lines are obtained on a double logarithmic plot, but the functional form of does not change. However, when exceeds a critical value ( was obtained with the Weibull parameters specified above) the avalanche statistics drastically changes. At a fixed when is smaller than a specific value , the avalanche sizes show exponential distribution, while above the distribution takes a power law form with an exponent .

Based on the above results of simulations a phase diagram is constructed which summarizes the properties of avalanches with respect to the parameters of the model. Fig. 10 demonstrates the existence of three different regimes. If the damage parameter is smaller than , the dynamics of avalanches is close to the simple Dry Bundle Model characterized by a power law of the mean field exponent . However, for the avalanche size distribution depends on the number of failures alowed. The curve of in the phase diagram separates two different regimes. For the parameter regime below the curve, avalanche distributions with an exponential shape were obtained. However, the parameter regime above is characterized by a power law distribution of avalanches with a constant exponent significantly different from the mean field exponent [29, 30]. It is important to emphasize that the overall shape of phase diagram is independent of the type of the disorder (annealed or quenched), moreover, the specific values and depend on the details of the disorder distribution .
A very different behavior was obtained for the system when fibers do not have remaining stiffnes after a number of failures. Simulations revealed that in this case the avalanche statistics strongly depends on the type of disorder. When the disorder is quenched the size distribution of avalanches follows always the dry bundle results for the whole domain of parameters, i.e. shows power law behaviour with an exponent . When the larger number of breakings results in more avalanches but the overall distribution does not change.
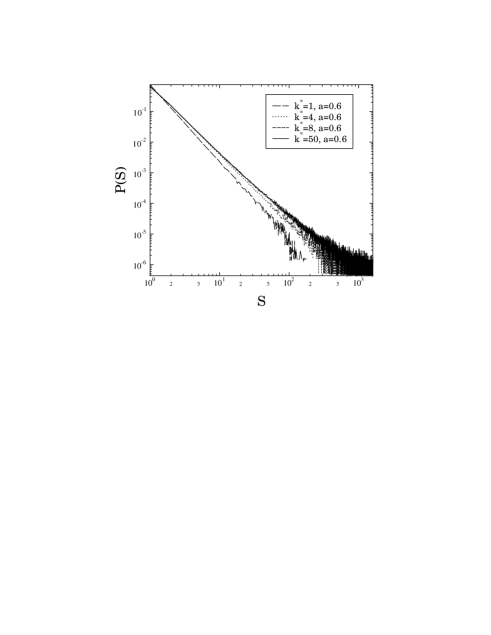
Nevertheless, when the disorder is annealed the system shows a more complex behaviour. When falls below a certain critical value the results are similar to DBM independently of the value of , however, for a novel avalanche dynamics appears (for the present values of the Weibull parameters was obtained). In Fig. 11 the avalanche distributions are shown for an value above , varying the value of . It is very important to emphasize that the curves in all the cases can be well fitted with a power law, however, the value of the exponent depends on . Two extreme cases can be distingushed: for the system recovers the DBM avalanche dynamics. On the other hand, for the exponent of the power laws is , similarly to the case of remaining stiffness. Below the exponents vary as a function of between the mean field exponent and .
Based on Refs. [29, 30] the different types of avalanche size distributions can also be understood up to some extent in terms of the constitutive curves of Sec. III. Comparing Fig. 3 and Figs. 9, 11 it can be recognized that if the constitutive curve has a single quadratic maximum the corresponding avalanche size distribution of CDFBM follows the mean field results, while other types of avalanche statistics arises when this condition does not hold.
VI Conclusions
A detailed analytical and numerical study of the continuous damage fiber bundle model is presented. The model is an extension of the classical fiber bundle model by introducing a continuous damage law, and allowing for multiple failure of fibers with quenched and annealed disorders. A simple general derivation of the constitutive behaviour of the model is provided, which also facilitates to obtain analytic results for the microscopic damage process. Varying its parameters, the model provides a broad spectrum of description of materials ranging from strain hardening to perfect plasticity, and hence, the model can be relevant to describe the damage process of various types of materials [39, 40, 41, 42, 43]. It is a remarkable feature of the model that multiple failure of brittle elements can result in a macroscopically plastic state, which has also been observed experimentally in materials where the damage mechanism is the gradual multiple failure of ingredients [42, 43].
The present study focused on the microscopic damage process to understand the emergence of the plastic plateau under strain controlled loading, and the resulted avalanche activity under stress controlled loading of the continuous damage fiber bundle model. Analytic results are obtained to characterize the damage process along the plateau under strain controlled loading, furthermore, for stress controlled experiments a simulation technique was developed and the distribution of avalanches of fiber breaks was explored numerically. Simulations showed that depending on the parameters of the model the distribution of bursts of fiber breaks can be exponential or power law. Based on extensive computer simulations, a phase diagram characterizing the possible avalanche distributions is constructed in terms of the two parameters of the model. One of the most appealing outcomes is that the model has a broad parameter regime where the avalanche statistics shows a power law behaviour with an exponent significantly different from the well know mean field exponent, in spite of the infinite range of interaction among fibers. The results obtained have relevance to understand the acoustic emission measurements performed on various elasto-plastic materials [39, 40, 41, 42, 43].
Acknowledgment
This work was supported by the project SFB381, and by the NATO grant PST.CLG.977311. F. Kun acknowledges financial support of the Bólyai János Fellowship of the Hungarian Academy of Sciences and of the Research Contract FKFP 0118/2001.
REFERENCES
- [1] Statistical models for the fracture of disordered media, edited by H. J. Herrmann and S. Roux (North-Holland, Amsterdam, 1990).
- [2] Statistical Physics of Fracture and Breakdown in Disordered Systems, edited by B. K. Chakrabarti and L. G. Benguigui (Clarendon Press, Oxford, 1997).
- [3] H. E. Daniels, Proc. R. Soc. London A 183, 405 (1945).
- [4] B. D. Coleman, J. Appl. Phys. 29, 968 (1958).
- [5] D. Krajcinovic and M. A. G. Silva, Int. J. Solids Structures 18, 551 (1982).
- [6] D. Sornette, J. Phys. A 22, L243 (1989).
- [7] D. Sornette, J. Phys. France 50, 745 (1989).
- [8] I. L. Menezes-Sobrinho, A. T. Bernardes, and J. G. Moreira, Phys. Rev. E 63, R25104 (2001).
- [9] C. Moukarzel and P. M. Duxbury, J. Appl. Phys. 76, 1 (1994).
- [10] S. Roux, Phys. Rev. E 62, 6164 (2000).
- [11] Y. Moreno, J. B. Gomez, A. F. Pacheco, Phys. Rev. Lett. 85, 2865 (2000).
- [12] F. Kun, S. Zapperi, and H. J. Herrmann, Eur. Phys. J. B17, 269 (2000).
- [13] L. Moral, Y. Moreno, J. B. Gómez, and A. F. Pacheco, Phys. Rev. E 63, 066106 (2001).
- [14] D. G. Harlow and S. L. Phoenix, J. Composite Mater. 12, 195 (1978).
- [15] R. L. Smith and S. L. Phoenix, J. Appl. Mech. 48, 75 (1981); D. G. Harlow and S. L. Phoenix, J. Mech. Phys. Solids 39, 173 (1991).
- [16] S. L. Phoenix, M. Ibnabdeljalil and C.-Y. Hui, Int. J. Solids Structures Vol. 34, No. 5, 545 (1997).
- [17] S. L. Phoenix and Raj, Acta Metall. Mater. 40, 2813 (1992).
- [18] F. Kun and H. J. Herrmann, Journal of Materials Science 35, 4685 (2000).
- [19] I. J. Beyerlein and S. L. Phoenix, J. Mech. Phys. Solids 44, 1997 (1996).
- [20] W. A. Curtin, J. Am. Ceram. Soc. 74, 2837 (1991).
- [21] W. A. Curtin, J. Mech. Phys. Solids 41, 217 (1993).
- [22] S. J. Zhou and W. A. Curtin, Acta. Metal. Mater. 43, 3093 (1995).
- [23] F. Hild, A. Burr, and F. A. Leckie, Eur. J. Mech. A 13, 731 (1994).
- [24] P. L. Leath and P. M. Duxbury, Phys. Rev. B 49, 14905 (1994).
- [25] A. Delaplace, S. Roux, and G. Pijaudier-Cabot, Int. J. Solids Struct. 36, 1403 (1999).
- [26] W. A. Curtin and N. Takeda, J. Comp. Matls. 32, 2042 (1998).
- [27] W. A. Curtin, J. Am. Ceram. Soc. 74, 2837 (1991).
- [28] W. A. Curtin, Phys. Rev. Lett. 80, 1445 (1998).
- [29] P. C. Hemmer and A. Hansen, J. Appl. Mech. 59, 909 (1992).
- [30] M. Kloster, A. Hansen, and P. C. Hemmer, Phys. Rev. E 56, 2615 (1997).
- [31] A. Hansen and P. C. Hemmer, Phys. Lett. A 184, 394 (1994).
- [32] W. I. Newman, A. M. Gabrielov, T. A. Durand, S. L. Phoenix, and D. L. Turcotte, Physica D 77, 200 (1994).
- [33] W. I. Newman, D. L. Turcotte, and A. M. Gabrielov, Phys. Rev. E 52, 4827 (1995).
- [34] P. Duxbury, P. D. Beale and P. L. Leath, Phys. Rev. Lett. 57, 1052 (1986).
- [35] S. Zapperi, A. Vespignani, and H. E. Stanley, Nature (London) 388, 658 (1997).
- [36] A. Garcimartín, A. Guarino, L. Bellon and S. Ciliberto, Phys. Rev. Lett. 79, 3202 (1997); A. Guarino, A. Garcimartín and S. Ciliberto, Eur. Phys. J. B 6, 13 (1998).
- [37] A. Petri, G. Paparo, A. Vespignani, A. Alippi and M. Costantini, Phys. Rev. Lett. 73, 3423 (1994).
- [38] S. Zapperi, P. Ray, H. E. Stanley, and A. Vespignani, Phys. Rev. Lett. 78, 1408 (1997); Phys. Rev. E 59, 5049 (1999).
- [39] A. G. Evans and F. W. Zok, J. Mater. Sci. 29, 3857 (1994).
- [40] S. M. Spearing and F. W. Zok, J. Engrg. Mat. and Technol. 115, 314 (1993).
- [41] A. E. Naaman and H. W. Reinhardt, High performance fiber reinforced cement composites, (E & FN Spon, London, 1995).
- [42] A. G. Evans, J. M. Domergue, and E. Vagaggini, J. Am. Ceramic Soc. 77, 1425 (1994).
- [43] T. Kanada and V. C. Li, J. Engrg. Mech. 125, 290 (1999).