Superconducting proximity effect in clean ferromagnetic layers
Abstract
We investigate superconducting proximity effect in clean ferromagnetic layers with rough boundaries. The subgap density of states is formed by Andreev bound states at energies which depend on trajectory length and the ferromagnetic exchange field. At energies above the gap, the spectrum is governed by resonant scattering states. The resulting density of states, measurable by tunneling spectroscopy, exhibits a rich structure, which allows to connect the theoretical parameters from experiments.
pacs:
PACS numbers: 74.50.+r, 74.80.-g, 75.70.-iI Introduction
Investigating of superconducting proximity effect in normal systems has a long history back to the experiments of McMillan and Rowell[1]. Their tunneling spectroscopy measurements in normal metals connected to a superconductor revealed strong modifications of the density of states (DOS) caused by the induced superconducting correlations. These results were understood in the tunneling model of McMillan[2]. He first noted that the changes in the DOS of the normal metal occur on a scale , which in his model is identified with inverse escape time of a quasi-particle in the normal metal. Naively, one would have expected , the superconducting gap parameter, to play the dominant role, which turned out to be not the case. Furthermore, if , the energy gap in the superconductor plays no role at all and the DOS in the normal metal has a gap of the order of . We can understand these observations by noting that in clean normal metal films the electronic properties are determined by so called Andreev bound states [3]. These are bound electron-hole pairs living on trajectories, which start and end at the superconductor. The characteristic energy scale in this case is , again the inverse escape time. In recent years experiments became possible, in which the density of states was resolved locally on a sub-m scale. For example, the dependence of the tunneling DOS on the distance from the superconductor in normal metals has been measured by Guéron et al.[4] using additional tunnel junctions. These results have been successfully explained within the quasi-classical theory in the diffusive limit.[5] Other experiments made use of low temperature scanning tunneling microscopes to resolve spatially the DOS of small droplets of normal metal on the surface of a superconductor.[6] Nowadays these types of experiments are becoming a standard technique.[7, 8, 9]
The question of the proximity effect in the presence of a spin splitting is currently heavily investigated. In particular the influence of a superconductor on transport properties of a ferromagnet is under debate[10, 11, 12],in which case the proximity effect is negligible. It is, however, natural to address the question of the influence of an exchange field on the proximity density of states. In fact, this question was already addressed experimentally a while ago by Gallagher et al. [13]. They observed a spin splitting of the DOS in thin normal layers in a parallel magnetic field. New experimental developments,[14] exploring the proximity effect on a nanometer scale demand new theoretical models, beyond the simple tunneling model of McMillan. In the present paper we investigate a new model, suitable for these experiments.
The motivation stems not only from fundamental question of the coexistence of ferromagnetism and superconductivity, but also because interesting applications of ferromagnet-superconductor (FS) hybrid structures have been proposed. We only mention here the potential use of SFS-contacts in the construction of quantum computers. SFS-junctions are candidates for all-electronic -junction, which are needed in some proposals for solid-state qubits. [15, 16]
We also note, that many surprising effects in normal metal-superconductor heterostructures have been found, both experimentally and theoretically. The question, how these effects are modified by the presence of ferromagnetism, is of high interest. For example, making use of mechanically controlled break junctions, the conduction channel content of single atoms has been determined [17]. These were shown to depend on the chemistry of the atom only[18]. It was however crucial to have superconducting contacts in these experiments. Therefore, so far only superconducting elements or normal metals, with the help of the proximity effect, have been investigated.[19] It is reasonable to expect that experiments with ferromagnetic materials will be performed in the near future.
Long time ago Larkin and Ovchinnikov [20] and Fulde and Ferrel [21] independently predicted, that in the presence of an exchange field (for instance in magnetic superconductors) a specific superconducting state can be formed, in which Cooper pairs have a non-zero momentum due to spin splitting. The momentum of Cooper pairs is given by , which, in the singlet state, results from the difference between up and down spin band Fermi momenta. The resulting LOFF state is qualitatively different from the homogeneous zero-momentum state. Due to a varying superconducting phase, the order parameter has an oscillatory spatial modulation containing nodes, in which the phase changes by . The LOFF state has never been observed in bulk superconductor, but there are recently evidences for detecting an induced LOFF state in heterostructures of ferromagnets and superconductors. Many works have investigated the thermodynamics properties of FS-multilayers. Radovic et al.[22] have predicted oscillation of the superconducting critical temperature as a function of the thickness of the attached F-layer. The experimental evidence for these oscillations is not, however, conclusive.[23] The reason for this may, for example, result from a bad quality of the FS-interface.[24]
The most recent experiments have concentrated on other properties of FS-layers. Ryasanov et al. [25] measured the temperature dependence of the critical current in SFS Josephson junctions with thin F-layer and have found a non-monotonic temperature dependence. This behavior can be understood in terms of a phase shift due to the exchange field, which occurs for certain values of the thickness of the F-layer, as first was predicted by Bulaevskii et al.[26]. An indirect proof of the phase shift has been made by Kontos et al.,[14], who studied the density of states in thin ferromagnetic films contacted by a superconductor. They observed an oscillatory behavior of the induced superconducting correlation for layers of different thickness, which was attributed to influence of the exchange field. In Ref. [27], we have shown that these experimental findings could be explained by a model of a ballistic ferromagnetic layer with rough boundaries. The best agreement was obtained in the limit of large and small interface transparency .
In the present paper, we study the proximity DOS in a clean ferromagnetic layer on top of a superconductor in the full parameter range. Within the ballistic quasi-classical formalism we obtain, that the DOS for energies below the superconducting gap is completely specified by the length distribution of the classical trajectories inside the ferromagnet (Sec. II). The DOS for energies above the gap is also expressed in terms of the length distribution of the trajectories. The length distribution depends on the geometrical properties of the attached ferromagnet and the connecting boundaries. In Sec. III we specify the classical length distribution for our particular case of the F-film geometry depicted in Fig. 1. We assume, that the boundaries of the F-film are disordered, leading to complete diffusive reflection of the quasi-particles from these boundaries. We also take into account band mismatch and disorder at the FS-interface, which leads to an enhanced backscattering from this interface. For simplicity, we assume a single value of the FS-interface transparency . With the calculated distribution, the DOS at all energies is obtained as a function of the superconducting gap , the exchange field , the thickness of the F-layer and the transparency .
We analyze the DOS for different regimes of . It shows the interplay between ferromagnetism and superconductivity depending qualitatively on the thickness . For example, a weak exchange field leads to a spin-splitting of the DOS, which results in a distinctive low energy peak in the total DOS. In addition there is an overall suppression of the superconducting features of the DOS with increasing . At higher exchange fields, the DOS shows as a signature of the exchange splitting an oscillatory behavior as a function of the layer thickness. This oscillation of DOS was observed in the experiments [14]. Our findings are summarized in the following list:
-
(Sec. IV A): Andreev levels are governed by the distribution of trajectory lengths, which only depends on the geometric properties of the sample. At small energies the DOS is strongly suppressed, originating from the exponential suppression of long trajectories. The DOS at larger energies reflects the length distribution. In our model it display a multiple peak structure, resulting from multiple reflections at the SN-interface. The resulting minigap correspond to the gap found in a calculation including impurity scattering.[28]
-
(Sec. IV B): A small exchange field ’splits’ the DOS for spin up and down quasiparticles, i. e. the total DOS is more or less a superposition of ’normal’ DOS’s at energies . Accordingly, the former minigap in the DOS is destroyed. It only remains a dip in the DOS shifted to finite energies. The density of states at the Fermi level approaches the normal state values in an oscillatory way, i. e. overshooting the normal DOS for certain values of .
-
(Sec. IV C): The superconducting features of the DOS are stronger suppressed. The former peaks at are inverted into dips for thicker layers. Above the gap peaks at appear as the signature of resonant transmission through the ferromagnetic film. For thin layers features at are absent and the DOS approaches a BCS-form.
-
(Sec. IV D): For layers with the DOS exhibits coherent oscillation, i. e. the form of the DOS difference from the normal state value becomes independent of . The amplitude and sign, however, depends on the thickness. Only for very low thicknesses the DOS approaches the BCS form.
II Model and basic equations
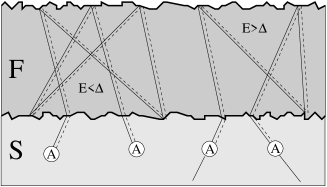
The system we study is sketched in Fig. 1. A ferromagnetic layer (F) of thickness is connected to a superconducting bank (S) on one side and bound on the other side by an insulator or vacuum. F is characterized by an exchange splitting, which we take into account as mean field in the Hamiltonian. The thickness is larger than the Fermi wave length and smaller than the elastic mean free path , which allows for a quasi-classical description [29] in the clean limit. We apply the Eilenberger equation in the clean limit
| (1) |
The matrix Green’s function for spin has the form
| (2) |
It depends on energy , the direction of the Fermi velocity and the coordinate . Here denote the Pauli matrices, is the superconducting pair potential (taken as real), and () labels the electron spin. The matrix Green’s functions obey the normalization condition . Inside then F-layer is constant and . We neglect a depression of the pair potential close to the FS interface, thus inside the superconductor, which applies in the case of a bad contact between the ferromagnet and the superconductor. Strictly speaking, we would have to include an elastic collision term in (1), even in the limit . However, changes in the spectrum due to this term are limited to small energies [28], which are negligible in all cases we study, except for the case . Disorder in the superconductor can be neglected in the limit of small interface transmission, which we mostly assume.
We have to solve Eqs. (1) along each classical trajectory with length in F, that comes from the superconductor and ends there. As boundary conditions the solutions approach the bulk values of at the beginning and the end of a trajectory deep inside the superconductor. These are given by .[30] It turns out that on a trajectory inside F the normal Green function is constant. It depends only on the length of that trajectory and is given by
| (3) |
To find the density of states per trajectory, we have to calculate
| (4) |
As the result we obtain for energies below the gap ()
| (5) |
where
| (6) |
Above the gap () we find
| (7) |
Here is the density of states at the Fermi level in the normal state. Eqs. (5) express the fact that the density of states below is a sum of -peaks resulting from Andreev bound states of electrons of (positive ’s) and holes of (negative ’s). The energies also follow from the quasi-classical quantization condition .
The total DOS is obtained by averaging the expressions (5) and (7) over all classical trajectories. Denoting the trajectory length distribution by and using (5), we find for the sub-gap DOS
| (8) | |||||
| (9) |
This formula is a general result for the sub-gap density of states of a quasi-ballistic metal connected to a superconductor. It is completely specified by the length distribution of classical trajectories, which depends only on the geometrical properties of the attached ferromagnet and the surrounding boundaries.
Averaging expression (7) over the total DOS for energies above the gap is
| (10) |
The absence of discrete bound states reflects the fact, that the Andreev reflection at energies above the gap is incomplete. Therefore, the quasi particle states in the ferromagnet are determined by ’scattering resonances’ of quasiparticles incident from the superconductor.
III Distribution of the trajectory length
Now we specify the length distribution for our particular case. We model the F-layer by a weakly disordered thin film bounded by a rough surface to the insulator and a rough FS-interface of average transparency . A typical classical trajectory is depicted in Fig 1. An electron coming from the bulk of S enters into the F-layer and after several reflection from the insulator and the FS-interface returns to the S-bank, where it is Andreev reflected as a hole and transverses the trajectory in the opposite direction. Thus, the building block of a trajectory is the segment between two successive reflections from S. The number of blocks which form the total trajectory depends on the transparency of the interface, i. e., it is roughly .
As first step, we consider the length distribution in the case of a perfectly transparent FS-interfaces, in which the length distribution is that of one elementary block. Due to the roughness of the insulator and the FS-interface the quasi-particles undergo diffusive reflection from these boundaries. Incident and reflected directions are completely uncorrelated. Then, assuming an uniform distribution for the directions of , we obtain for the length distribution of one elementary block (corresponding to the case of )
| (11) |
where () denotes angle of the incident (reflected) direction with respect to the normal to surface of the insulator. To take into account the weak bulk disorder, we include a factor . This serves mainly to yield a finite average length of the distribution (11). In a purely ballistic layer with given by (11), the average length would logarithmically divergent. Taking this into account we obtain
| (12) |
where ( is the exponential integral of order 2).
In the second step, we connect the elementary building blocks, if the FS interface has a transparency . In determining the length distribution we assume that an particle either goes through the interface or is fully reflected. Only the number of these reflection depends on . We do not take into account quantum mechanical interference for a single reflection at the FS-interface. Taking this into account will lead essentially the same results as our approach. By an expansion in the reflectivity for the distribution we can write
| (13) |
where the th term in the expansion is the contribution of the trajectories on which quasi-particles after times reflections from FS-interface leave the F-layer. It is easy to see from Eq. (13), that obeys the integral equation
| (14) |
which is readily solved by a Fourier transformation:
| (15) |
Replacing (15) in Eq. (14) we find
| (16) |
where is the Fourier transform of .
The distribution determines the relevant length scale associated with the geometrical size of the system corresponding to the typical distances quasi-particles travel inside F. We have plotted for different s and in Fig. 2. For small , it has a characteristic double peak structure close to the shortest trajectories , resulting from trajectories reflected once and twice from the insulator. At large the distribution decays exponentially as , where is the mean trajectory length. We therefore have two characteristic lengths of the distribution, the smallest possible trajectory length and the average length . The former determines the energy of the first Andreev level and the latter the possible longest length of the trajectories. For these two length scale are of the same order, leaving the thickness as the only relevant length scale. In this case has only one peak close to (see Fig. 2). Which of two length scales and determines the total density of states will depend on the other parameters.

Combining Eqs. (9) and (15) we obtain for the total sub-gap DOS
| (17) |
where . Similarly, from Eqs. (10) and (15) the total DOS for the energies above the gap is obtained:
| (18) |
Thus, in both cases the density of states is fully expressed in terms of the Fourier transform of the trajectory length distribution. Most probably a real F-film has a non-uniform thickness due to the large scale roughness of the boundaries. Assuming a smoothly varying thickness we can take this into account by averaging expressions (17) and (18) over a Gaussian distribution of the thickness around a mean value . This will also leads to a smoothening of the sharp features in DOS resulting from the lower cutoff in . The qualitative behaviour will however not change. In our calculations, we have taken a width of the distribution to be of order 10 that correspond to condition of the experiments [14].
IV Results and Discussions
Eqs. (17) and (18) express the DOS of a F-layer contacted by the superconductor in terms of the trajectory length distribution. Depending on the relative values of , , the Thouless energy and , the resulting DOS has different behaviors. We will concentrate mainly on the limit . For the length dependence it useful to distinguish between normal metal with , a weak ferromagnet of and and a strong ferromagnetic film of . We analyze the DOS in each case for different values of (), being the relevant length scale in the limit . In the end, we summarize all results in a map of the DOS depending on and .
A Normal film
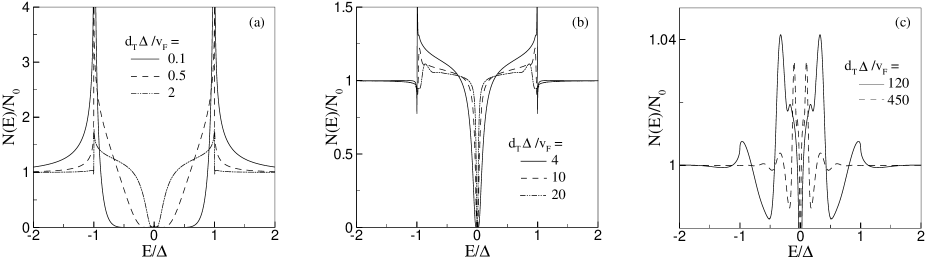
Let us start with a normal metal film () contacted by the superconductor. The DOS is shown in Fig. 3a-c, for different values of . In the limit of a very thin layer with , the DOS has essentially the form of superconducting DOS with sharp peaks at and zero DOS for energies inside the gap. By increasing the peaks are getting broader and a finite DOS appears at small energies. There is still an energy interval around with zero DOS (see Fig. 3a). Increasing further leads to a suppression of the superconducting features of the DOS. The zero DOS interval become smaller and the DOS at other energies tends to be closer to the DOS of the normal state. Thus, the density of states develops a minigap around the Fermi level, which decreases with increasing roughly as (see Fig. 3b). This minigap is related to the mean length of the trajectories , which has a finite value, if is finite. The presence of weak bulk disorder in the normal film suppresses long trajectories. Formally, this was included in the distribution of the trajectory length as the exponentially decaying factor in Eq. (12), which leads to the finite mean length . This act as an effective upper limit of order of the length of the trajectories, which gives a lower bound to the energy of the Andreev bound states. Similar features were found before within a tunneling model [2] and in the diffusive models [31, 32] in a disordered normal layer contacted by the superconductor.
The peaks of originate from the first peak in the distribution at , which at higher move to lower energies given roughly by (see Fig. 3b). They originate from Andreev peaks (AP) resulting from the trajectories with . By increasing the first AP moves to lower energies, and, when , the next AP appear at (Fig. 3c). In this case the DOS is close to the normal states values. Small deviations proportional to display many AP, as shown in Fig. 3c. Small peaks close the main peaks, which are more pronounced for the first AP, correspond to the second peak of at .
B Very weak ferromagnet,
Now we study the effect of the spin splitting in a ferromagnetic film on the DOS. First we consider the case of a weak ferromagnet, where the exchange field is of order of the superconducting gap, but . A qualitative picture of the influence of on the DOS follows from the condition (6) for the formation of Andreev bound states in the ferromagnetic layer. This is the semiclassical quantization condition for coherent superposition of two subsequent Andreev reflection of a quasi-particle from S, which propagate along a trajectory of length . It includes the phase gained by a quasiparticle of spin along a trajectory , and the phase shift produced by an Andreev reflection, . If the energy of the quasi-particle is not close to the phase shift resulting from Andreev reflection is different from zero. To obtain constructive interference the total phase must be an integer multiple of , as follows from Eq. (6). The existence of an upper limit on the length of the trajectories (as discussed above), leads to the formation of a zero DOS interval (minigap) around . Therefore, the total subgap DOS should be similar to the average of two by shifted normal spectra.
In column (I) of Fig. 4 the DOS of the ferromagnetic film with is shown for different values of . Shifting the minigap leads to minima at . The zero energy DOS becomes finite and increases with increasing . At higher the DOS has a smooth peak at zero energy and two dips at (see Fig. 4-Ia). Here, the AP are located at . By increasing the width of the dips decreases roughly as and the first AP moves to energies below the gap, i. e., (see Fig. 4-Ib). We can distinguish two domains of energies below the exchange field and energies above the exchange field . At higher the first AP moves from to and the next AP appears at . For the region the DOS shows a zero energy peak, if the first APs merge at (see Fig. 4-Ic). This is a zero energy Andreev peak (ZEAP), which originates from phase shifting caused by the exchange field. Additional shifting of the AP results in an oscillatory behavior of the DOS in the domain . As shown in Fig. 4-Id, in the limiting case of the DOS is close to the normal state value, exhibiting small deviations, which are of the order of the FS-interface transparency . The deviations have the form of small oscillations at all energies.
C Weak ferromagnet,
In the case of the suppression of the superconducting features of DOS occurs at lower , compared with the previous case of (see Fig. 4-IIa). The subgap DOS has similar features as it had for energies below in the case of . The zero energy DOS increases to the normal state values as becomes of order unity. Then, the DOS has a smooth peak at and minima at , as is shown in Fig. 4-IIb-c. The AP at move to lower energies at a higher values of and form ZEAP, when they merge at (see Fig. 4-IIc ). The size of the ZEAP is of order of .
The main feature of DOS in energies above the gap consists of sharp peaks at (see Fig. 4-IIb-d ). These peaks originate from a resonant transmission of the quasi-particles through the superconducting potential () inside the F-film. A quasi-particle incident from the superconductor to the F-film with energy above the gap, is
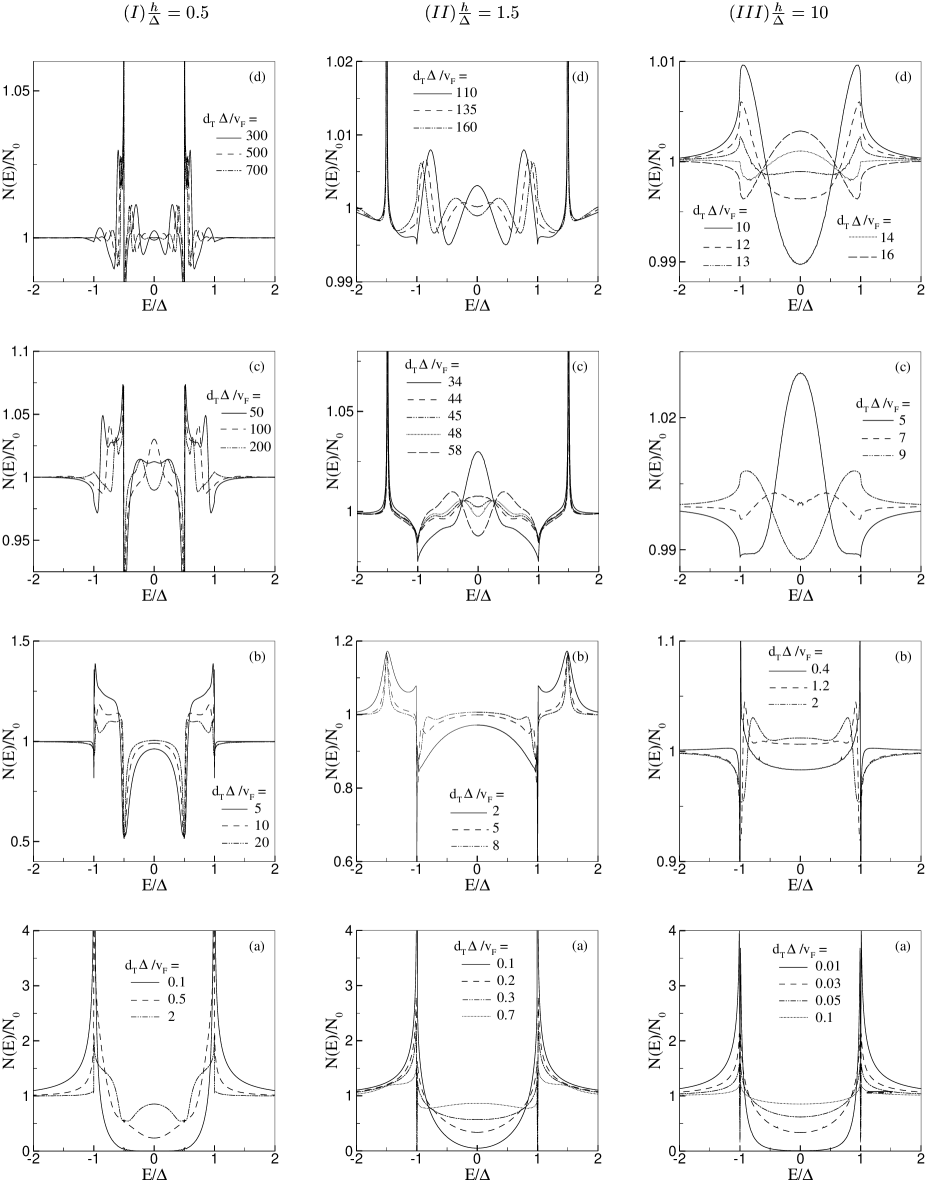
scattered by the potential well whose width is determined by the length of the quasi-particle trajectory inside F. The phase gained by the quasi-particle of spin inside the potential well is given by . At the incident and transmitted quasi-particles interfere constructively, which leads to a reflection-less transmission. Similar effect were found before in normal metal-superconductor hetrostructures [33]. For the subgap DOS shows an oscillatory behavior around the normal state value as a function of (see Figs.4-IIc and 4-IId). The period of the oscillation is and the amplitude is of order . The amplitude is damped in the limit of . Note that the phase of the oscillation depends on the energy.
D Ferromagnetic film
Now let us consider rather strong exchange fields . In column III of Fig. 4 we plotted for at different . As shown in Fig. 4-IIIa the suppression of the superconducting features from DOS by increasing is faster than in the weak ferromagnetic cases. In fact the DOS reaches almost to the normal state value for . As long as , mainly long trajectories of contribute to the zero energy DOS, which are well approximated by an exponential distribution of the form . Replacing this approximation form of into the general expression of DOS Eq. (9) we find, that the zero energy DOS increases with roughly as
| (19) |
This results is also applicable for the weak ferromagnetic case discussed above. As before, the shifting of the AP to lower energies (see Fig. 4-IIIb) leads to the formation of ZEAP at the Fermi level as is seen from Fig. 4-IIIc/d. Then the DOS develops coherent oscillation as a function of with the period . The amplitude and the sign of the oscillation depend on energy. Maximal amplitudes of opposite sign always occur at zero energy or at the gap energy (see Fig. 4-IIId). This results in an inverted energy dependence of the DOS by changing , which has been observed in the experiment [14]. We have shown in [27] that our results is in a quantitative agreement with the experimental data.
E Maps of the proximity DOS
Summarizing the above analysis we present a map showing the dependence of DOS on and for small FS-interface transparency. This map is shown in Fig. 5. Various regions in the map are distinguished by different ranges of and (or equivalently ). Along the diagonal lines is equal to and moving upwards (and consequently ) increases. The quarter circles are curves with constant , along which the ratio is varying. In the following we discuss different regions according to this classification. The normal film corresponds to the vertical axis (), which consists of three parts. The first part is limited by . Here the superconducting features are dominant at lower and suppressed for , showing a minigap at the Fermi level. The second part is limited by , where the main feature is the first AP at energies and a minigap of order . Close to the boundary the second AP appears in the DOS. Finally, the third part is the region , where the DOS contains many AP, appearing as small deviations (proportional to ) from the normal state DOS.
In the case of a ferromagnetic film we distinguish the following regions:
-
i)
The strongly superconducting region is limited by the smallest quarter circle, in which the superconducting features are dominate the DOS. At non-zero the zero energy DOS appears at larger and the DOS increases to the value of the normal state in the domain close to the second quarter circle boundary. For the part , there is a smooth maximum at between two minima at . For we have only a smooth peak at .
-
ii)
The intermediate regions limited by two quarter circles. In part the main features in DOS is the existence of two dips at and the first AP. Close to the second boundary we observe a separation between two energy domains and . While the second AP peaks appears at energies above , the first AP peaks move to energies below domain. In the part the DOS has a smooth peak at . In the domain close to the diagonal line , there are also two resonance sharp peaks at which disappear in regions. In both cases of and , shifting of the APs leads to the formation of a ZEAP. This happens at regions close to the third quarter circle.
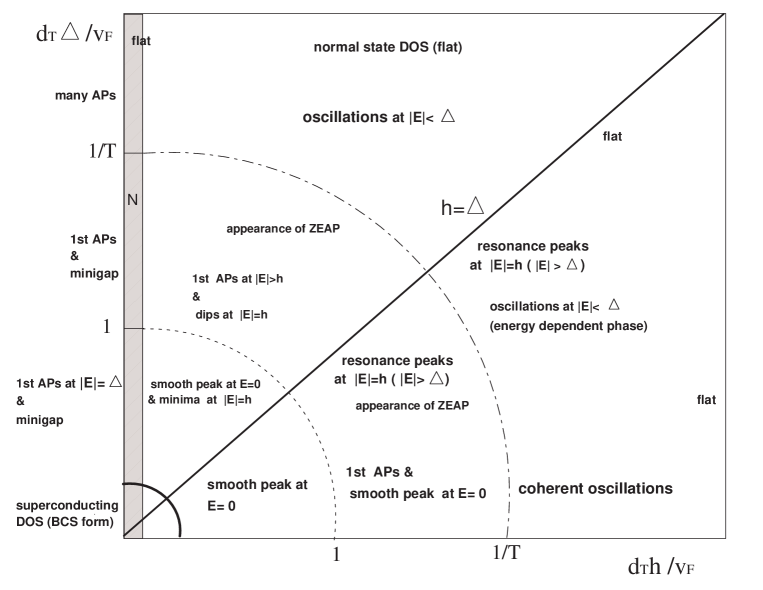
FIG. 5.: Map of the proximity DOS in a ferromagnetic layer showing the dependence on and for a small FS-interface transparency . In the case of high transparency the region between and is absent. -
iii)
In the region above the third quarter circle the DOS is close to the normal state value (flat). There are, however, small deviations proportional to , which have different origins in the different domains. In the limiting domains of and (close to the respective axis’) they consist of many AP and the oscillations, respectively. In the part there are many AP above and an oscillatory variation below . In the part and for weak exchange fields in subgap part we have oscillatory variations with an energy dependent sign and amplitude, which result from a collective shift of many AP. As the intermediate region the resonance peaks are present at . In the strong exchange field part these peaks are disappear. Here the oscillations of subgap DOS are produced by the first AP only.
The DOS map for the case of high transparency is similar to Fig. 5. The difference is the absence of the region between and on both axis. In the remaining regions we have features similar to the case. The value of the minigap and the energy of first AP are the same order. All features and variations including AP and oscillations are more pronounced than the case.
V Conclusion
In summary, we have studied theoretically superconducting proximity effect in ballistic ferromagnetic layers. Within the quasi-classical formalism, we have obtained expressions for the density of states at all energies in a ferromagnetic metal in contact with a superconductor which are completely specified by Fourier transform of the length distribution of classical trajectories in the ferromagnet. The length distribution of trajectories depends only on the geometrical properties of the attached ferromagnet and the connected interfaces. Thus, the obtained expressions are applicable for ballistic FS structures of arbitrary geometry. We have calculated the length distribution for the film geometry in a quasi-ballistic model taking into account finite transparency of the FS interface, roughness at the film boundaries and weak bulk disorders. The density of states exhibits variety of structures depending on the values of the superconducting energy gap , the ferromagnet exchange field , the thickness of F film and the FS interface transparency . We have observed many interesting features, like splitting of the subgap density of states for spin up and spin down quasi-particles, a zero energy Andreev peak, resonant transmission peaks above the gap at and oscillations of the DOS as a function of the film thickness. These effects have been explained in terms of the phase shift of Andreev bound states, caused by the exchange field. We have analyzed the density of states in the full parameter range and summarized the results in a map, shown in Fig. 5.
Acknowledgements.
One of the authors (M. Z.) would like to thank the group of Prof. Bauer at Delft University of Technology for their hospitality and support during his visit.REFERENCES
- [1] W. L. McMillan and J. R. Rowell, in Superconductivity, edited by R. D. Parks (1969, Marcel Dekker, New York).
- [2] W. L. McMillan, Phys. Rev. 175, 537 (1968).
- [3] A. F. Andreev, Sov. Phys. JETP 19, 1228 (1964).
- [4] S. Guéron, H. Pothier, N. O. Birge, D. Esteve, and M. H. Devoret, Phys. Rev. Lett. 77, 3025 (1996).
- [5] W. Belzig, C. Bruder, and G. Schön, Phys. Rev. B 54, 9443 (1996).
- [6] S. H. Tessmer, M. B. Tarlie, D. J. Van Harlingen, D. L. Maslov, and P. M. Goldbart, Phys. Rev. Lett. 77, 924 (1996).
- [7] Y. Levi, O. Millo, N. D. Rizzo, D. E. Prober, and L. R. Motowidlo, Phys. Rev. B 58, 15128 (1999).
- [8] N. Moussy, H. Courtois, and B. Pannetier, Rev. Sci. Instrum. 72, 128 (2001).
- [9] M. Vinet, C. Chapelier, and F. Lefloch, Phys. Rev. B 63, 165420 (2001).
- [10] V. I. Fal’ko, C. J. Lambert, A. F. Volkov, JETP Lett. 69, 532-538 (1999);
- [11] F. J. Jedema, B. J. van Wees, B. H. Hoving, A. T. Filip, and T. M. Klapwijk, Phys. Rev. B 60, 16549 (1999).
- [12] W. Belzig, A. Brataas, Yu. V. Nazarov, and G. E. W. Bauer, Phys. Rev. B 62, 9726 (2000).
- [13] W. J. Gallagher, D. E. Paraskevopoulos, P. M. Tedrow, S. Frota-Pessoa, and B. B. Schwartz, Phys. Rev. B 21, 962 (1980); see also R. Meservey and P. M. Tedrow, Phys. Rep. 238, 173 (1994).
- [14] T. Kontos, M. Aprili, J. Lesueur and X. Grison, Phys. Rev. Lett. 86, 304(2001).
- [15] L. B. Ioffe, V. B. Geshkenbein, M. V. Feigel’man, A. L. Fauchere, and G. Blatter, Nature 398, 679 (1999).
- [16] J. E. Mooij, T. P. Orlando, L. Levitov, L. Tain, C. H. van der Wal, and S. Lioyd, Science 285, 1036 (1999).
- [17] E. Scheer, P. Joyez, D. Esteve, C. Urbina, and M. H. Devoret, Phys. Rev. Lett. 78, 3535 (1997).
- [18] E. Scheer, N. Agrait, J. C. Cuevas, A. Levy Yeyati, B. Ludoph, A. Martin-Rodero, G. R. Bollinger, J. M. Van Ruitenbeek, and C. Urbina, Nature 394, 154 (1998).
- [19] E. Scheer, W. Belzig, Y. Naveh, C. Urbina, D. Esteve, and M. H. Devoret, Phys. Rev. Lett. 86, 296 (2001).
- [20] A. I. Larkin, and Yu. N. Ovchinnikov, Sov. Phys. JETP 20, 762 (1995).
- [21] P. Fulde, and R. A. Ferrel, Phys. Rev. 135, A550 (1964).
- [22] Z. Radovic, M. Ledvij, L. Dobrosavljevic-Grujic, A. I. Buzdin, and J.R. Clem , Phys. Rev. B 44, 759 (1991).
- [23] J. S. Jiang , D. Davidovic, Daniel H. Reich, and C. L. Chien , Phys. Rev. Lett. 74, 314 (1995); Th. Mühge, N. N. Garif’yanov, Yu. V. Goryunov, G. G. Khaliullin, L. R. Tagirov, K. Westerholt, I. A. Garifullin, and H. Zabel, ibid. 77, 1857 (1996).
- [24] J. Aarts et al., Phys. Rev. B 56, 2779 (1997); L. Lazar et al., ibid., 61, 3711 (2000); M. Schöck, C. Sürgers, and H. v. Löhneysen, Eur. Phys. J. B 14, 1 (2000).
- [25] V. V. Ryazanov, A. V. Veretennikov, V. A. Oboznov, A. Yu. Rusanov, V. A. Larkin, A. A. Golubov, and J. Aarts, Physica B 284-288,495 (2000); V. V. Ryazanov, V. A. Oboznov, A. Yu. Rusanov, A. V. Veretennikov, A. A. Golubov, and J. Aarts, Phys. Rev. Lett. 86, 2427 (2001).
- [26] L. N. Bulaevskii, V. V. Kuzii, and A. A. Sobyanin, Pis’ma Zh. Eksp. Teor. Fiz. 25, 314 (1977)[JETP Lett. 25, 290 (1997)].
- [27] M. Zareyan, W. Belzig, and Yu. V. Nazarov, Phys. Rev. Lett. 86, 308 (2001).
- [28] S. Pilgram, W. Belzig, and C. Bruder, Phys. Rev. B 62, 12462 (2000).
- [29] G. Eilenberger, Z. Phys. 214, 195 (1968); A. I. Larkin and Yu. N. Ovchinnikov, Sov. Phys. JETP 26, 1200 (1968).
- [30] I. O. Kulik, A. N. Omelyanchouk, Sov. J. Low Temp. Phys. 4, 142 (1978).
- [31] A. A. Golubov and M. Yu. Kupriyanov, J. Low Temp. Phys. 70, 83 (1988); A. A. Golubov and M. Yu. Kupriyanov, Sov. Phys. JETP 69, 805 (1989).
- [32] W. Belzig , PhD thesis, Karlsruhe university (1999).
- [33] A. Kastalsky, A. W. Kleinsasser, L. H. Greene, R. Bhat, and J. P. Harbison, Phys. Rev. Lett. 67, 3026 (1991); C. Nguyen, H. Kroemer, and E. L. Hu, Phys. Rev. Lett. 69, 2847 (1992); see also M. Schechter, Y. Imry, Y. Levinson, cond-mat/0104343(unpublished).