Mean-field analysis of collapsing and exploding Bose-Einstein condensates
Abstract
The dynamics of collapsing and exploding trapped Bose-Einstein condensates caused by a sudden switch of interactions from repulsive to attractive are studied by numerically integrating the Gross-Pitaevskii equation with atomic loss for an axially symmetric trap. We investigate the decay rate of condensates and the phenomena of bursts and jets of atoms, and compare our results with those of the experiments performed by E. A. Donley et al. [Nature 412, 295 (2001)]. Our study suggests that the condensate decay and the burst production is due to local intermittent implosions in the condensate, and that atomic clouds of bursts and jets are coherent. We also predict nonlinear pattern formation caused by the density instability of attractive condensates.
pacs:
03.75.Fi, 05.30.Jp, 32.80.Pj, 82.20.MjI Introduction
Bose-Einstein condensates (BECs) of trapped atomic vapor have been realized in several atomic species Anderson ; Davis ; Bradley ; Fried ; Robert ; Modugno . One of the remarkable features of these systems is that both strength Inouye and sign Cornish ; Roberts01 ; Donley of interactions between atoms can be tuned by adjusting an external magnetic field near a Feshbach resonance Feshbach . This has opened up the possibility to study collapsing and exploding BECs in a controllable manner, thereby offering a stringent test of the Gross-Pitaevskii mean-field theory GP .
A trapped BEC with attractive interactions may be formed Ruprecht when quantum pressure arising from Heisenberg’s uncertain principle counterbalances the attractive force between atoms. This is possible when the parameter defined by is below a critical value , where is the number of BEC atoms, the s-wave scattering length, and the size of the ground-state wave function of a harmonic trap. When the parameter exceeds , attractive force dominates quantum pressure, causing BEC to collapse. In the experiments performed by a Rice group Sackett ; Sackett99 ; Gerton01 , BEC atoms are continuously supplied from a supercooled thermal gas, and collapse and growth cycles of BEC have been observed Gerton01 . In the experiments performed at JILA Cornish ; Roberts01 ; Donley , in contrast, is fixed and is decreased by using the Feshbach resonance so as to meet the condition . This technique enabled them to determine the value of Roberts01 , and to observe exploding atomic ejection from collapsing BEC Cornish ; Donley , a phenomenon called “Bosenova” whose origin is currently under controversy Kagan98 ; SaitoL ; SaitoA ; Duine .
The Gross-Pitaevskii (GP) equation GP has widely been used to study mean-field properties of BECs, offering fairly good quantitative account of a rich variety of experiments for repulsive BECs Dalfovo . In the case of the attractive BECs, however, it is by no means clear to what extent mean-field theory is valid, for the attractive interaction might enhance many-body quantum correlations. In fact, a measured value of Roberts01 is significantly smaller than that predicted by a mean-field theory Ruprecht ; Gammal , the origin of the discrepancy being not yet understood.
The recent quantitative measurements on collapsing and exploding BEC reported in Ref. Donley have motivated us to investigate to what extent mean-field theory can explain the experimental observations. This is the main purpose of this paper. By numerically integrating the GP equation with atomic loss, we show that the phenomena reported in Ref. Donley , such as decay of condensates, ejection and refocus of atomic bursts, and jet formation, are reproduced by our numerical simulations. In addition, we predict that various patterns in atomic density are formed in the course of collapse.
This paper is organized as follows. Section II briefly reviews the GP equation with atomic loss due to inelastic collisions and describes the method of analysis of our simulations. Section III reports our results of numerical simulations using the GP equation, and compares them with the experimental data of Ref. Donley . Section IV provides the summary of this paper.
II The Gross-Pitaevskii equation with atomic loss and methods of analysis
The GP equation describes unitary time evolution of a macroscopic “wave function” , and conserves the total number of atoms . In reality, however, atoms are lost from the trap due to the two-body dipolar and three-body recombination losses. These effects may be taken into account by incorporating in the GP equation the imaginary terms describing these inelastic processes Kagan98 :
| (1) | |||||
where is the trapping potential, and and denote two-body dipolar and three-body recombination loss-rate coefficients, respectively. The imaginary terms in Eq. (1) are phenomenologically introduced in order to take account of the fact that the two-body and three-body losses are proportional to the square and cube of the atomic density:
| (2) |
We assume that the atoms and molecules produced by inelastic collisions escape from the trap without affecting the condensate. The constants and include Bose statistical factors and , respectively, which are needed for BEC factor , and describe the loss rate per atom.
In the situations we consider the two-body loss can be ignored. The two-body and three-body loss rates are given by and , and their ratio by . They have the relation , which is always for Roberts00 and Gerton . When the density is low and , . Then both two-body and three-body losses can be ignored since we shall consider the time scale of ms. When the density is high, the three-body loss dominates the two-body loss, and thus the two-body loss becomes unimportant. In our numerical simulations we shall therefore ignore the two-body loss term in Eq. (1). All results presented below are not affected if the two-body loss is taken into account.
The three-body loss, in contrast, plays a crucial role in determining the collapsing dynamics of BEC. When implosion occurs, the atomic density becomes extremely high, and so does the three-body recombination rate, until it stops the growth of the density. The maximum density in the process of implosion is determined by and Kagan98 ; SaitoL ; SaitoA . The values of far from the Feshbach resonance have been measured for Burt , Kurn , and Gerton , and they agree with theoretical predictions Moer ; Fedichev ; Esry within a factor of ten. Near the Feshbach resonance, however, complicated behaviors of are predicted Braaten , with no precise experimental data available Roberts00 .
We performed numerical integration of the GP equation (1) using a finite-difference method with the Crank-Nicholson scheme Ruprecht . Since the peak density changes drastically during implosion SaitoL ; SaitoA , we very carefully controlled the time step to avoid error propagation. Initially we prepared the ground-state wave function by the method in Ref. Edwards for an initial s-wave scattering length and an initial number of BEC atoms . At the interaction is suddenly switched from to , inducing collapse of the condensate. We use the parameters of and assume the same trap geometry (i.e. radial frequency Hz and axial frequency Hz) as that used in Ref. Donley .
In Ref. Donley , atoms after the collapse are classified into three parts: remnant, burst, and missing atoms. The remnant BEC is a dense atomic cloud peaking around the center of the trap, and the burst is a dilute one that spreads broadly around the remnant BEC. In our simulations, we identify the remnant, burst, and missing atoms as follows. The one-dimensional density distributions defined by and show bimodal structures, one peaking at the center and the other spreading around it (an example is shown in Fig. 5b). We identify the former as the remnant and the latter as the burst, and determine the axial and radial coordinates, and , of the boundaries between the remnant BEC and the burst. We then calculate the number of atoms in the remnant BEC as
| (3) |
The burst atoms are defined by the ones outside the boundary. Because of ambiguities in defining the coordinates of the boundaries, and defined this way have uncertainties of about , while the total number of atoms in the trap is well defined. We define the number of missing atoms as .
III Results of numerical simulations
III.1 Decay of the condensate and local intermittent implosions
We first study the situation in which the scattering length is switched from to at , where is the Bohr radius. Figure 1 shows time evolutions of the peak height of the wave function, the total number of atoms in the trap , and the number of remnant BEC atoms , where we assume .

Our numerical simulations show that the condensate first contracts slowly with its peak height gradually increasing. The total number of atoms remains constant during this process, since the recombination loss is negligible at such low densities. At ms, implosion suddenly occurs in a very localized region (the size of the density spike is while the size of the BEC cloud is several micrometers) for a very short period of time ( ms). Furthermore the implosion occurs not just once but many times intermittently for about 10 ms SaitoL ; SaitoA . The three-body recombination loss prominently occurs during the implosion, since the atomic density becomes extremely high. Several tens of atoms are lost in each intermittent implosion, resulting in a step-wise decrease of . The decay of is due to both three-body recombination and atomic burst ejection. We note that the behavior of , shown as the plots in Fig. 1, is very similar to the experimental result (Fig. 1b of Ref. Donley ).
The implosions occur not only at the center of the trap but also at other locations on the trap axis, and more than one density spike is often seen simultaneously. A snapshot of the imploding process with , , and is displayed in Fig. 2, where the image is taken 2.5 ms after the switch of interactions.
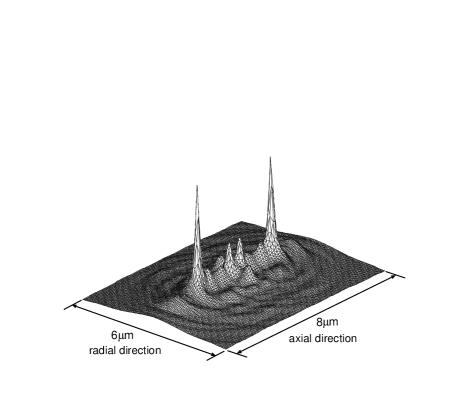
Two large spikes are seen on the trap axis. In an isotropic trap, on the other hand, implosions always occur one by one at the center of the trap.
III.2 Collapse and decay times
The total number of atoms of the system remains constant for some time after the switch of interactions, and suddenly it begins to decay. We call the time at which the sudden decay begins ‘collapse time’ (see Fig. 1). Since the collapse time is determined mainly by slow accumulation of atoms towards the center of the trap, only weakly depends on the value of . In Fig. 1, ms, which agrees with the experimental result of 3.7 ms Donley . Figure 3 shows the dependence of on , where and Elef .

The plots are in good agreement with the experimental ones (Fig. 2 of Ref. Donley ). For another set of parameters and , we obtain ms, which is also consistent with the experimental finding Donley . The collapse time increases for larger values of , since the atomic cloud spreads more widely and therefore it takes longer time for the cloud to get to the center of the trap.
III.3 Remnant, burst, and missing atoms
Figure 4a shows the fractions of remnant, burst, and missing atoms after the implosion has finished for and .

We note that is much larger than when is large, as observed experimentally Donley . To put it differently, once the condensate expands following the collapse, the critical density will not be reached even when . This is because the ratio is irrational and therefore the axial and radial refocuses of the burst atoms do not occur simultaneously, with no further implosions occurring.
This result presents a sharp contrast with that for an isotropic case shown in Fig. 4b, where the trap frequency is chosen to be the geometric mean . The numbers of remnant atoms are always below . This is because all collapsing atoms go to the center of the trap simultaneously, and therefore more implosions occur in an isotropic trap, which increases and decreases . Moreover, the implosions occur also when the burst atoms refocus, since they concentrate at the center of the trap. The data in Fig. 4b are taken before the first refocus. Nevertheless, we note that is already below .
We also note that in the axi-symmetric trap the fractions , , and are almost independent of , particularly for , which is consistent with the experiments Donley . This is a consequence of the fact that the number of implosions occurring in the collapse is roughly proportional to and that the numbers of the burst and missing atoms in each implosion are almost constant.
III.4 Atomic bursts and “jets”
A burst atom cloud is usually too broadly spread and hence too dilute to be seen. However, at every (or ) the cloud refocuses along the axial (or radial) direction and can be observed. Figure 5a shows the column density seen from the direction perpendicular to the trap axis and Fig. 5b shows the one-dimensional distribution , when the burst atoms focus along the trap axis (corresponding to Fig. 3 of Ref. Donley ).
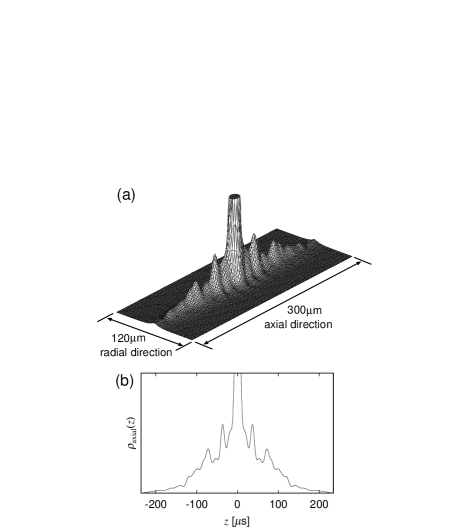
The s-wave scattering length is switched from to at and the image is taken at ms . There are small peaks in the ridge of focus, which appear to correspond to the shoulders of the central peak in Fig. 3c of Ref. Donley . According to our theory the origin of the atomic burst is a release of kinetic energy of local spikes in the atomic density Kagan98 ; SaitoL ; SaitoA .
As regards the burst energy, it is at present difficult to compare our results with the experimental ones. One reason is that although the burst energy depends not only on but also on SaitoA , experimental values of as a function of are not available. The uncertainty in the boundaries between the remnant BEC and the burst and that in Gaussian fitting of the burst profile (see Fig. 5b) give rise to large errors in numerically determining the burst “temperature”, which also make quantitative comparison between theory and experiment difficult. More work (both theoretical and experimental) needs to be done in order to clarify the situation.
In the experiments Donley , prolonged atomic clouds called “jets” are observed in the radial direction when the collapse is interrupted by switching the interaction from attractive to repulsive. The jets are distinguished from the bursts in that the energy of the former is much lower than the latter and that the direction of the jets is purely radial. In Ref. Donley , the origin of the jets is considered to be the highly anisotropic spikes in the atomic density.
We performed numerical simulations under situations similar to the experimental ones. The s-wave scattering length is switched from to at , and changed to at ms (a snapshot before expansion is shown in Fig. 2). Figure 6 shows the gray-scale images of the integrated column density after a ms expansion in (a) and (b), and ms in (c).
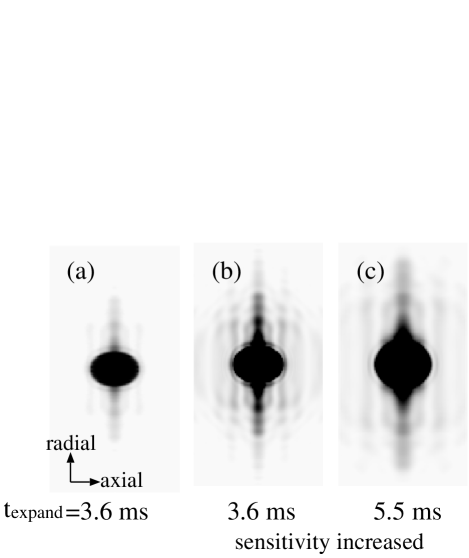
In the image (a), prolonged atomic clouds similar to the jets reported in Fig. 5 of Ref. Donley appear in the radial direction (the main jet at the center and two tiny jets on either side of it). The images (b) and (c), where the sensitivity of the imaging is increased, show that the jets are interference fringes. The parallel fringe pattern is characteristic of the interference between waves emanating from two point sources Andrews . In fact, there are two spikes in the atomic density that play the role of two point sources of matter waves in Fig. 2. We find that the spacing between the fringes is proportional to . This supports our interpretation, since the spacing between the fringes from two point sources is known to be given by Andrews , where is the distance between two point sources. In the experimental images in Ref. Donley (particularly in Figs. 5d-f), the jets seem to be ejected from the edge of the remnant condensate, where the density is too low to form the spikes, which also supports our interpretation that the jets are the consequence of interference. Thus, the experimental observations of jets indicate that atoms expanding from spikes are coherent, suggesting that the burst atoms are also coherent.
III.5 Pattern formation
We found in Ref. SaitoL that various patterns in the atomic density are formed in the collapse processes caused by a sudden switch of interactions from repulsive to attractive, the origin of the pattern formation being attributed to the self-focusing effect of the attractive systems.
Here we predict that a similar pattern formation does occur in BEC for experimentally available parameters.
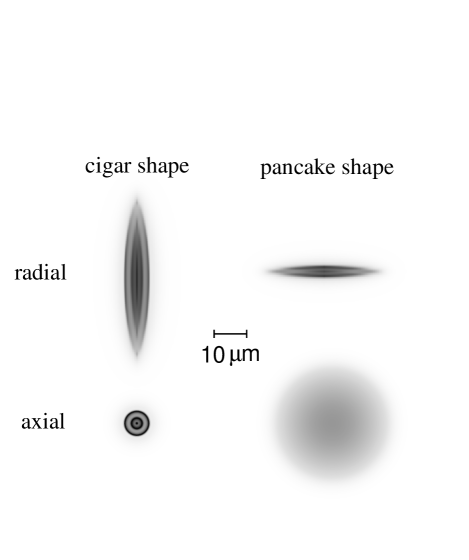
Figure 7 shows pattern formation in axi-symmetric traps, where , and the s-wave scattering length is switched from to . The pancake-shape trap has the ratio with the same geometric mean frequencies as the cigar-shape trap. In the cigar-shape trap the cylindrical shell structure is formed, and in the pancake-shape trap the layered structure is formed.
Figure 8 shows time evolution of the integrated column density for an isotropic trap, where , , and are the same as in Fig. 7.
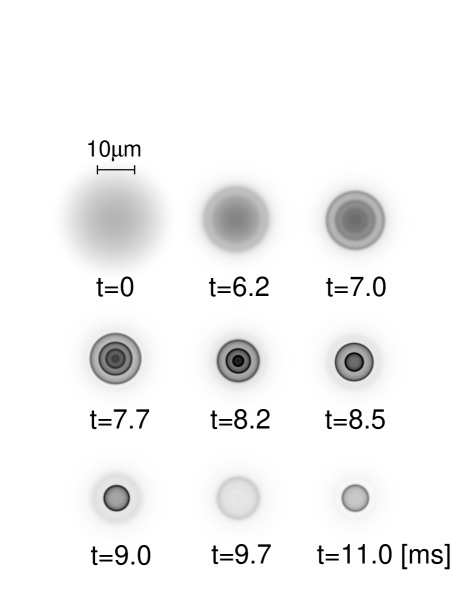
We see that the density fluctuations grow to form four concentric spherical shells at ms, which move inwards and collapse one by one; then at ms we see that a new shell is being formed
The resolution of the imaging system in Ref. Donley (7 FWHM) is inadequate for observing the patterns in Figs. 7 and 8 (the spacing between the shells is ). Expansion of BEC before imaging will blur out the pattern. In order to observe the pattern formation, therefore, we need to improve the in situ imaging method, or to use larger and to enlarge the pattern.
IV Summary
We have studied the dynamics of collapsing and exploding BECs by numerically solving the time-dependent GP equation with atomic loss (1), and compared our results with those of the experiments of Ref. Donley . We find that mean-field theory with atomic loss can account for the following experimental findings: (i) It takes the system a certain time to undergo a sudden decrease in the number of atoms after the jump of . (ii) The number of atoms in the condensate decays exponentially with a decay time constant of a few milliseconds. (iii) The burst atoms are ejected in the collapse process, and refocus after every half trap period. (iv) The fractions of remnant, burst, and missing atoms are almost independent of , and the number of remnant atoms is much larger than the critical number for large . (v) The jets are observed when the collapse is interrupted by jumping to a positive value.
We have found that these phenomena are attributed to a rapid sequence of local intermittent implosions, and provided a new interpretation of the jets, i.e., the highly anisotropy of the jets is due to the interference fringes. This suggests that the burst atom cloud is coherent.
The validity of the mean-field GP equation is determined by the gas parameter , and the depletion is given by . When the implosion occurs, becomes at the peak density in our simulations, which indicates that the mean-field approximation is still valid at least qualitatively.
Our results presented here suggest that the mean-field approximation can be used to describe the collapsing and exploding dynamics at least qualitatively. A more quantitative comparison between experiments and numerical simulations might reveal effects beyond mean-field approximation. This possibility merits further experimental and theoretical study.
ACKNOWLEDGMENTS
We thank E. A. Donley for valuable comments. This work was supported by a Grant-in-Aid for Scientific Research (Grant No. 11216204) by the Ministry of Education, Science, Sports, and Culture of Japan, and by the Toray Science Foundation.
References
- (1) M. H. Anderson, J. R. Ensher, M. R. Matthews, C. E. Wieman, and E. A. Cornell, Science 269, 198 (1995).
- (2) K. B. Davis, M. -O. Mewes, M. R. Andrews, N. J. van Druten, D. S. Durfee, D. M. Kurn, and W. Ketterle, Phys. Rev. Lett. 75, 3969 (1995).
- (3) C. C. Bradley, C. A. Sackett, J. J. Tollett, and R. G. Hulet, Phys. Rev. Lett. 75, 1687 (1995); 79, 1170(E) (1997); C. C. Bradley, C. A. Sackett, and R. G. Hulet, ibid. 78, 985 (1997).
- (4) D. G. Fried, T. C. Killian, L. Willmann, D. Landhuis, S. C. Moss, D. Kleppner, and T. J. Greytak, Phys. Rev. Lett. 81, 3811 (1998).
- (5) A. Robert, O. Sirjean, A. Browaeys, J. Poupard, S. Nowak, D. Boiron, C. I. Westbrook, and A. Aspect, Science 292, 461 (2001); F. P. D. Santos, J. Léonard, J. Wang, C. J. Barrelet, F. Perales, E. Rasel, C. S. Unnikrishnan, M. Leduc, and C. Cohen-Tannoudji, Phys. Rev. Lett. 86, 3459 (2001).
- (6) G. Modugno, G. Ferrari, G. Roati, R. J. Brecha, A. Simoni, and M. Inguscio, Science 294, 1320 (2001).
- (7) S. Inouye, M. R. Andrews, J. Stenger, H. -J. Miesner, D. M. Stamper-Kurn, and W. Ketterle, Nature 392, 151 (1998).
- (8) S. L. Cornish, N. R. Claussen, J. L. Roberts, E. A. Cornell, and C. E. Wieman, Phys. Rev. Lett. 85, 1795 (2000).
- (9) J. L. Roberts, N. R. Claussen, S. L. Cornish, E. A. Donley, E. A. Cornell, and C. E. Wieman, Phys. Rev. Lett. 86, 4211 (2001).
- (10) E. A. Donley, N. R. Claussen, S. L. Cornish, J. L. Roberts, E. A. Cornell, and C. E. Wieman, Nature 412, 295 (2001).
- (11) E. Tiesinga, A. J. Moerdijk, B. J. Verhaar, and H. T. C. Stoof, Phys. Rev. A 46, R1167 (1992); E. Tiesinga, B. J. Verhaar, and H. T. C. Stoof, ibid. 47, 4114 (1993).
- (12) E. P. Gross, Nuovo Cimento 20, 454 (1961); J. Math. Phys. 4, 195 (1963); L. P. Pitaevskii, Zh. Eksp. Teor. Fiz. 40, 646 (1961) [Sov. Phys. JETP 13, 451 (1961)]. See also A. J. Leggett, Rev. Mod. Phys. 73, 307 (2001).
- (13) P. A. Ruprecht, M. J. Holland, K. Burnett, and M. Edwards, Phys. Rev. A 51, 4704 (1995).
- (14) C. A. Sackett, C. C. Bradley, M. Welling, and R. G. Hulet, Appl. Phys. B 65, 433 (1997).
- (15) C. A. Sackett, J. M. Gerton, M. Welling, and R. G. Hulet, Phys. Rev. Lett. 82, 876 (1999).
- (16) J. M. Gerton, D. Strekalov, I. Prodan, and R. G. Hulet, Nature 408, 692 (2000).
- (17) Yu. Kagan, A. E. Muryshev, and G. V. Shlyapnikov, Phys. Rev. Lett. 81, 933 (1998).
- (18) H. Saito and M. Ueda, Phys. Rev. Lett. 86, 1406 (2001).
- (19) H. Saito and M. Ueda, Phys. Rev. A 63, 043601 (2001).
- (20) R. A. Duine and H. T. C. Stoof, Phys. Rev. Lett. 86, 2204 (2001).
- (21) F. Dalfovo, S. Giorgini, L. P. Pitaevskii, and S. Stringari, Rev. Mod. Phys. 71, 463 (1999).
- (22) A. Gammal, T. Frederico, and L. Tomio, Phys. Rev. A 64, 055602 (2001).
- (23) Yu. Kagan et al., JETP Lett. 42, 209 (1985); H. T. C. Stoof, A. M. L. Janssen, J. M. V. A. Koelman, and B. J. Verhaar, Phys. Rev. A 39, 3157 (1989).
- (24) J. L. Roberts, N. R. Claussen, S. L. Cornish, and C. E. Wieman, Phys. Rev. Lett. 85, 728 (2000).
- (25) J. M. Gerton, C. A. Sackett, B. J. Frew, and R. G. Hulet, Phys. Rev. A 59, 1514 (1999).
- (26) E. A. Burt, R. W. Ghrist, C. J. Myatt, M. J. Holland, E. A. Cornell, and C. E. Wieman, Phys. Rev. Lett. 79, 337 (1997).
- (27) D. M. Stamper-Kurn, M. R. Andrews, A. P. Chikkatur, S. Inouye, H. -J. Miesner, J. Stenger, and W. Ketterle, Phys. Rev. Lett. 80, 2027 (1998).
- (28) A. J. Moerdijk, H. M. J. M. Boesten, and B. J. Verhaar, Phys. Rev. A 53, 916 (1996).
- (29) P. O. Fedichev, M. W. Reynolds, and G. V. Shlyapnikov, Phys. Rev. Lett. 77, 2921 (1996).
- (30) B. D. Esry, C. H. Greene, and J. P. Burke, Jr., Phys. Rev. Lett. 83, 1751 (1999).
- (31) E. Braaten and H. -W. Hammer, Phys. Rev. Lett. 87, 160407 (2001).
- (32) M. Edwards, R. J. Dodd, C. W. Clark, and K. Burnett, J. Res. Natl. Inst. Stand. Technol. 101, 553 (1996).
- (33) The similar results are obtained for a spherically symmetric trap and with different parameters in A. Eleftheriou and K. Huang, Phys. Rev. A 61, 043601 (2000).
- (34) M. R. Andrews, C. G. Townsend, H. -J. Miesner, D. S. Durfee, D. M. Kurn, and W. Ketterle, Science 275, 637 (1997).