Anomalous electronic structure and pseudogap effects in Nd1.85Ce0.15CuO4
Abstract
We report a high-resolution angle-resolved photoemission spectroscopic (ARPES) study of the electron-doped (-type) cuprate superconductor Nd1.85Ce0.15CuO4. We observe regions along the Fermi surface where the near- intensity is suppressed and the spectral features are broad in a manner reminiscent of the high-energy “pseudogap” in the underdoped -type (hole doped) cuprates. However, instead of occurring near the () region, as in the -type materials, this pseudogap falls near the intersection of the underlying Fermi surface with the antiferromagnetic Brillouin zone boundary.
pacs:
PACS numbers: 79.60.Bm, 73.20.Dx, 74.72.-hThe electron-doped cuprate superconductors provide a unique opportunity to study the physics of doped Mott insulators and high-Tc superconductors. In addition to possessing interesting physics in their own right, the -type materials, with their different normal state properties and phase diagram, offer an alternative venue to test various theories of high-Tc superconductivity.
Nd2-xCexCuO4±δ is a member of the small family of cuprate superconductors that can be doped with electrons[1]. Only an approximate symmetry in the phase diagram exists about the zero doping line between - and -type, as the antiferromagnetic phase is much more robust in the electron-doped material and persists to much higher doping levels. Superconductivity occurs in a doping range that is almost five times narrower. In addition, these two ground states occur in much closer proximity to each other. Experiments show other contrasting behavior between -type superconductors and their -type counterparts, for instance a T2 dependence of the in-plane resistivity[2], the lack of incommensurate neutron scattering peaks [3] and a temperature induced sign reversal of the Hall coefficient[4]. Although they appear to share a superconducting -wave pairing symmetry [5, 6], the ratio of the n-type materials is much smaller than that of its optimally doped -type counterparts [7].
Here we report a detailed angle resolved photoemission spectroscopic (ARPES) study of the electronic structure of this electron-doped cuprate superconductor. Significant differences are found between it and the -type materials that shed light on a number of important topics in the high-Tc superconductors. We find that the Luttinger volumed Fermi surface is truncated into several pieces with a high-energy “pseudogap”-like suppression that forms, not at the maximum of the -wave functional form as in the underdoped p-type materials, but near the intersections of the Fermi surface with the antiferromagnetic Brillouin zone (AFBZ) boundary.
Single crystals of Nd1.85Ce0.15CuO4 (NCCO) were grown by the traveling solvent floating zone method in 4 ATM of O2. Details of this growth can be found elsewhere[8]. The resulting crystals show an onset of superconductivity at 25K and a superconducting volume (Meissner shielding) of almost 100 at 20K. A second batch of crystals, grown at Stanford University under similar conditions, showed an onset at 24K with similarly narrow transition widths. The photoemission data obtained between the two batches are identical.
As it is imperative to determine which characteristics of the data are intrinsic and which are possible artifacts due to, for instance, the matrix elements for photoexcitation, data were collected on two different photoemission systems. On beamline 5-4 at the Stanford Synchrotron Radiation Lab (SSRL), data were taken at 16.5 eV photon energy () with an incident angle of approximately 45 degrees and the in-plane polarization along the Cu-O bonds (Energy resolution 10 meV and angular resolution ). At beamline 10.0.1 at the Advanced Light Source (ALS) an incident energy of 55eV was used in a glancing incidence geometry with in-plane polarization at 45 degrees to the Cu-O bonds ( 20meV, ). All displayed spectra were taken at low temperature () in the superconducting state; this does not change the conclusions we make regarding the normal state electronic structure as the changes in spectra with the onset of superconductivity are very subtle in NCCO[6]. The chamber pressure was lower than 4 x 10-11 torr. Cleaving the samples at low temperature in situ results in shiny flat surfaces which low-energy electron diffraction (LEED) [Fig. 2(c)] reveal clean and well ordered with a symmetry commensurate with the bulk. No signs of surface aging were seen for the duration of the experiment( hours).
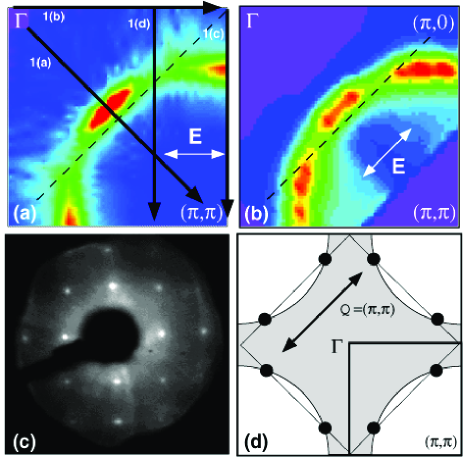
In Fig.’s 1(a) - (c) we display energy distribution curves (EDCs) from high symmetry lines in the Brillouin zone (BZ) taken on the SSRL apparatus. In Fig. 1(a), one sees a dispersion along the to () direction which is ubiquitous among the cuprates. A broad feature disperses quickly towards the Fermi energy (), sharpens to a sharp peak at (), and then disappears. Along the to () direction, the -type spectra are quite different from their -type counterparts. While the low-energy feature in the optimally doped -type compounds disperses quite close to and forms a flat band region with a correspondingly high density of states close to , in NCCO this flat band region is at about 300 meV higher energy[9]. Along () to () [Fig. 1(c)] the peak disperses to and gives a small peak at . The spectra also possess a large background contribution that has a weak maximum at 300 meV, as seen in the 100 curves in Figs. 1(a) and 1(c).
In addition to the spectra from the high-symmetry directions, more comprehensive intensity maps were obtained over a large region in momentum space at both photon energies. In Fig. 2(a) and 2(b) we have plotted the integrated spectral weight of the EDCs ( = 16.5 and 55eV respectively) from within a 30 meV window about as a function of . This gives a measure of the regions in momentum space that dominate the low-energy properties of the material i.e. the Fermi surface. The expected large Fermi surface [as depicted in Fig. 2(d)]has a volume greater than 1/2 (measured filling level ) and has a shape that is consistent with the LDA band calculations[11]. Interestingly however, it shows two regions of suppressed spectral weight near () and (). Although there is obviously some modulation of the intensity due to matrix elements, as some of the details of the intensity pattern are different between the two excitation energies, the gross features are the same. In addition, data from SSRL at 16.5eV with the sample turned so that the polarization is at to the Cu-O bond reveals a similar pattern (not shown). The fact that the same systematics are seen in different configurations gives us confidence that we are measuring intrinsic properties, a fact which will be substantiated by lineshape analysis below.
A detailed look at = 16.5eV EDCs through the suppressed region of the Fermi surface [Fig. 1(d)] reveals that the peak initially approaches and then monotonically loses weight despite the fact that its maximum never comes closer than 100 meV to . This results in features which are quite broad, even at . Such behavior is similar to the high-energy pseudogap seen in the extreme underdoped -type materials although in the present case it is observed near () and not at () the maximum of the -wave functional form. An additional important difference is that a true clean gap at the very lowest energies cannot be defined, because the continually decreasing slope of the EDCs at gives a leading edge midpoint that is within a few meVs of . We need to make the distinction between high-energy pseudogap behavior [the conversion of an expected sharp peak at to a broad feature over a large energy range (100 meV) and the suppression of low-energy spectral weight] and low-energy pseudogap behavior which is the clean leading edge gap seen in the normal state of underdoped and optimally doped -types near () that has been posited to be reflective of pairing fluctuations in the normal state. The low-energy pseudogap in the p-type materials appears to evolve somewhat continuously with underdoping into the high-energy pseudogap of the underdoped superconductor and AF insulator. Both gaps can be distinguished in moderately doped samples. The fact that they share the same -wave functional form has lead to proposals that the pairing in the superconductor is an inherited property of the insulating state[12]. These distinctions are important ones that we will return to later.
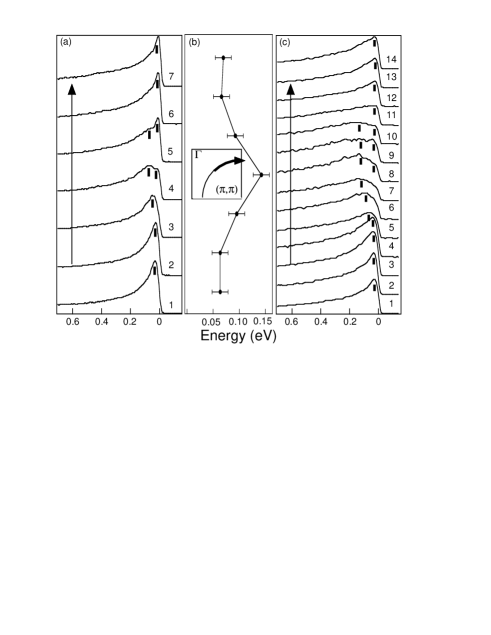
In Fig. 3a and 3b we plot =55 and 16.5eV EDCs from around from () to () as shown in the inset. Consistent with the intensity maps in Fig 2(a) and 2(b) the data show a well defined and intense peak at in momentum space regions close to the to () Fermi surface crossing and the () to () Fermi surface crossing. In between these regions, corresponding to where the maps in Figs. 2(a) and 2(b) show suppressed intensity, the spectra are rather different [see curves 4 of Fig. 3(a) and 7-9 of Fig. 3(c)] with no well defined peaks. These qualitatively different spectral lineshapes prove that the major effects seen in the intensity plots are not due to matrix elements which will not change the shape of the spectra drastically. These assertions receive further support from the measurement of EDC widths in Fig. 3(b). Here we plot the width in energy of the EDCs (defined as the FWHM/2 of the actual features and not the output of a fitting parameter) in Fig. 3(a). This quantity, which can be viewed as an average over the low energy scattering rate (Im) is largest in the momentum region of interest along where the near- spectral weight is suppressed maximally as shown in Fig.’s 2(a) and 2(b). This analysis reveals those regions along the FS that show the anomalous low-energy spectral weight suppression are subject to the strongest scattering effects.
We take the view that this anomalous electronic structure in the suppressed region is reflective of the transfer of spectral weight from a near- peak to a large broader incoherent maximum at higher energy. As one moves along the Fermi surface from () to (), this high-energy part at first gains intensity and shifts the global maxima to higher energy. In the intermediate region along the contour, the near weight is suppressed maximally with a plurality of spectral weight at higher energy. Moving towards () the high-energy part still forms a maximum at 100 meV but the low-energy peak begins to recover at and the two features can be seen simultaneously in a single spectrum. The low-energy peak continues to gain weight until the zone edge at (), while the high-energy part loses intensity and disappears. The point of view that the two features are part of a single spectral function is supported by the fact that we observe only a single Fermi surface with the expected Luttinger volume.
We note here that the regions of momentum space with the unusual low-energy behavior fall intriguingly close to the intersection of the underlying FS with the AFBZ boundary as shown by the dashed lines in Fig. 2(a) and 2(b). This suppression of low-energy spectral weight and large scattering rate in certain regions on the FS bears resemblance to various theories that emphasize a coupling of charge carriers to a low-energy collective mode. Central to these schemes is the supposition that there exists anomalous low energy scattering channels with typically () momentum transfer. A simple phase space argument such as that shown in Fig. 2(d) shows that those charge carriers which lie at the intersection of the FS with the AFBZ boundary will suffer the largest effect of anomalous () scatterings as these are the only FS locations that can have low-energy coupling with Q = (). These heavily scattered regions of the FS have been referred to in the literature as “hot spots”. It has been suggested that the large back-scattering felt by charge carriers in the hot spots is the origin of the pseudogap in the underdoped hole-type materials[13].
A few candidates for such a scattering channel have been proposed. One realization would be a strong coupling of the charge carriers to () magnetic fluctuations. Indeed, strong AF fluctuations have been found at (), as may have been expected in a material that is as close to the antiferromagnetic phase as this one[3]. In this context the pseudogap is seen as a precursor to the formation of the antiferromagnetic phase. Other possibilities include coupling to short range fluctuations of the CDW, DDW, or phononic type. A great deal of theoretical effort has been devoted to schemes based on the above general considerations.[13, 14, 15]. Of course we cannot rule out a combination of effects. Alternatively, large effective () scatterings can be caused by umklapp (U) processes which are only allowed for charge carriers on the AFBZ boundary. It has been suggested that these U processes create anomalously large effective backward scattering that leads to hot-spot phenomena and the creation of a non-Fermi liquid without an additional broken symmetry.[16]
In the underdoped -type materials, due to band filling considerations, the underlying Fermi surface’s area is smaller and hence its intersection with the AFBZ boundary is closer to (). This, along with the existence of the near () extended saddle points, would cause these regions of the Brillouin zone to feel the largest effect of () couplings if such processes exist. As alluded to earlier, this may lead to the formation of a pseudogap whose momentum dependence closely mimics and can be confused with the functional form of the -wave superconducting gap. In the present case of NCCO, the underlying Fermi surface is more distant from the () regions and the band there is flat 300 meV below . In this scenario, the pseudogap regions would move away from () on the FS and along towards (), as observed.
The class of theories that predict pseudogap formation at the intersection of the AFBZ boundary with the FS contrast with those that explain high-energy pseudogap and hot spot effects to result from fluctuations of a very large energy superconducting pairing scale that has been inherited from the AF insulator. The latter class of theories predict that the momentum dependence of the pseudogap will follow the general trend of the -wave superconducting gap i.e. attaining a maximum value at (). The advantage of the present experiments on the electron-doped material is that the two different origins for pseudogaps give different functional forms, whereas they will give similar ones in the -type materials as detailed above. In the very underdoped regime in the -type materials, ARPES measures a high-energy -wave like pseudogap on the order of 100 meV near the () region[17]. As we observe a high energy pseudogap in NCCO of a similar energy scale, but with a very different momentum dependence, our results demonstrate the possibility that this very large -wave-like pseudogap in the extreme underdoped -type materials may not be related to preformed pairs, but instead may be due to pre-emergent magnetic order or other similar phenomena. Our observation still allows for the existence of a normal state low-energy pseudogap (defined by the leading edge) that may be related to the existence of pairing fluctuations above Tc. In this regard it appears that one must carefully discriminate between high-energy pseudogap behavior, which may be caused by the effects discussed above and is tied to the intersection of the FS with the AFBZ boundary, and pairing fluctuations that may cause pseudogap behavior on a lower energy scale and should follow the -wave functional form. If one wishes to interpret the physics of the - and -type cuprates in a comprehensive fashion then our results suggest that some of the confusing pseudogap phenomenology regarding energy scales and doping dependencies may be reconciled by distinguishing effects of these kinds.
We thank X.J. Zhou and Z. Hussain for beamline support. The Stanford Synchrotron Radiation Laboratory and the Advanced Light Source are both operated by the DOE Office of Basic Energy Science, Division of Chemical Sciences and Material Sciences. Additional support comes from the Office of Naval Research: ONR Grants N00014-95-1-0760/N00014-98-1-0195. The Tokyo crystal growth work was supported in part by Grant-in-Aids for Scientific Research from the Ministry of Education, Science, Sports, and Culture, Japan, and the New Energy and Industrial Technology Development Organization of Japan (NEDO). The crystal growth at Stanford was supported by the U.S. Department of Energy under Contract Nos. DE-FG03-99ER45773-A001 and DE-AC03-76SF00515 and by a NSF CAREER Award. M.G. is also supported by the A.P. Sloan Foundation.
REFERENCES
- [1] Y. Tokura, H. Takagi, and S. Uchida, Nature 337, 345-347 (1989)
- [2] F. Gollnik and M. Naito, Phys. Rev. B 58, 11734-11752 (1998)
- [3] T.R. Thurston et. al., Phys. Rev. Lett. 65, 263-266 (1990); K. Yamada et. al., Journal of Physics and Chemistry of Solids 60, 1025-1029 (1999)
- [4] Z. Wang et. al. Phys. Rev. B, 43 3020-3025 (1991); S. Kubo, and M. Suzuki, Physica C, 185-189 1251-1252 (1991); W. Jiang et. al., Phys. Rev. Lett. 73, 1291-1293 (1994)
- [5] C.C. Tsuei and J.R. Kirtley, Phys. Rev. Lett.85, 182-185 (2000); R. Prozorov et. al., Phys. Rev. Lett.85, 3700 (2000); J. D. Kokales et. al., Phys. Rev. Lett.,85, 3696 (2000)
- [6] N.P. Armitage et. al., Phys. Rev. Lett. 86, 1126 (2001)
- [7] Q. Huang et. al., Nature, 347 369-372 (1990)
- [8] Y. Onose et. al., Phys. Rev. Lett. 82 5120 (1999)
- [9] D. King et. al., Phys. Rev. Lett. 70, 3159-3162 (1993); R.O. Anderson et. al. Phys. Rev. Lett., 70, 3163-3166 (1993)
- [10] A line of symmetrized data points was used immediately below and parallel to the zone diagonal as these points were missing from our initial data set.
- [11] S. Massida, N. Hamada, J. Yu, and A. Freeman, Physica C 157, 571-574 (1989)
- [12] G. Kotliar and J. Liu, Phys. Rev. B 38, 5142 (1988); H. Fukuyama, Prog. Theor. Phys. Suppl. 108, 287 (1992); P. A. Lee and X. G. Wen, Phys. Rev. Lett. 76, 503 (1996)
- [13] D. Pines, Z. Phys. B 103, 129 (1997); J. Schmalian, D. Pines and B. Stojkovic, Phys. Rev. Lett. 80, 3839 (1998); A.P. Kampf and J.R. Schrieffer, Phys. Rev. B 42, 7967 (1990)
- [14] R. Hlubina and T.M. Rice, Phys. Rev. B 51, 9253 (1995)
- [15] S. Chakravarty et. al., Phys. Rev. B 63, 094503 (2001)
- [16] N. Furukawa, T.M. Rice, and M. Salmhofer, Phys. Rev. Lett. 81, 3195 (1998); C. Honerkamp et. al., Phys. Rev. B 63, 035109 (2001)
- [17] D.S. Marshall et. al., Phys. Rev. Lett. 76, 4841 (1996)