[
Influence of oxygen isotope exchange on the ground state of manganites
Abstract
We report a study of oxygen isotope effects on low temperature specific heat, magnetization, and resistivity of La1-xCaxMnO3 and (La1-yPry)0.67Ca0.33MnO3. For the metallic compositions of La1-xCaxMnO3 and for charge-ordered La0.5Ca0.5MnO3 no change in low temperature specific heat has been detected with 16O - 18O exchange, while compounds of (La1-yPry)0.67Ca0.33MnO3 () show a significant change in low temperature properties. The low temperature specific heat indicates a presence of the charge-ordered phase even in compositions of (La1-yPry)0.67Ca0.33MnO3 which are metallic at low temperatures. We suggest that the changes induced by the oxygen isotope exchange are caused by an increase of the charge-ordered phase in 18O samples.
PACS number(s): 75.40.Cx, 75.30.Vn, 71.30.+h, 75.50.Cc
]
I INTRODUCTION
Manganese oxides of general formula R1-xAxMnO3 (where R is a rare-earth ion and A is an alkaline-earth ion) have attracted considerable interest due to their various fascinating properties. They exhibit a rich phase diagram, which includes ferromagnetic (FM) metallic, antiferromagnetic (AFM) insulating, charge and orbitally ordered phases depending on doping , average ionic radius on R and A sites, magnetic field, and temperature. In manganites, charge, spin, orbital, and lattice degrees of freedom are interconnected, and their balance determines the electronic and magnetic state of these materials. In some compositions a competition of opposing interactions associated with these different degrees of freedom induces an electronic phase separation, which is considered to be an intrinsic properties of these manganites [1, 2]. Another prominent manifestation of the spin-charge-lattice interplay in manganites is the unusual and large oxygen isotope effect [3, 4, 5]. Substitution of 16O by 18O lowers significantly the Curie temperature of the ferromagnetic compositions of La1-xCaxMnO3 [3, 6], increases the charge ordering (CO) transition temperature for the transitions from FM metallic to AFM charge-ordered state [4] and even induces a metal-insulator transition [5]. Many models have been proposed to explain the isotope effect in manganites: a small polaron model [3, 7], a bipolaron model [8], change of interatomic distance by lattice vibrations [9], nonadiabatic behavior of the oxygen ions [10], isotope dependence of the nonstoichiometry in manganites [11]. In spite of significant experimental and theoretical effort, a physical picture that would consistently explain the influence of oxygen isotope substitution on different states (FM and CO) is presently lacking. To better understand the nature of the oxygen isotope effect in manganites, it is important to know how it affects the ground state. Studies of low temperature specific heat can address this issue, since the specific heat carries information about principal excitations.
In this paper we report a systematic study of specific heat, magnetization and resistivity in FM metallic composition of La1-xCaxMnO3 (, 0.3, and 0.375), charge-ordered La0.5Ca0.5MnO3, as well as (La1-yPry)0.67Ca0.33MnO3 (). The latter compound changes from FM metal for to CO AFM insulator for [12]. For the compositions the (La1-yPry)0.67Ca0.33MnO3 exhibits a percolative transition from a higher temperature CO insulator to a metal with decreasing temperature [1, 12, 13]. Analysis of low temperature magnetization, resistivity [12, 14], and synchrotron x-ray diffraction data [15] indicates metallic and CO phase coexistence in the compositions of these materials. One goal of this paper is to compare the low temperature behavior of these various samples in order to investigate the influence of oxygen isotope exchange on the properties of both single phase and phase separated manganites. We have found that the most prominent isotope effect is observed in the phase separated systems, which might be the key to understanding the origin of the giant oxygen isotope effect in manganites.
II EXPERIMENTAL DETAILS
Ceramic samples of La1-xCaxMnO3 (, 0.3, 0.375, and 0.5) and (La1-yPry)0.67Ca0.33MnO3 () were prepared by a standard solid state reaction technique. X-ray powder diffraction showed that all samples are single phase and good quality. For oxygen isotope exchange we used a standard procedure [3]: the 16O and 18O samples were prepared from the same pellet of the starting material, and were simultaneously treated at T = 1000∘ C and pressure 1 atm in different closed quartz tubes, one filled with 16O and the other with 18O. We estimate the extent of the exchange of 16O by 18O to be at least 85 %, as determined by weight change.
The specific heat was measured in the temperature range 2-20 K and magnetic field range 0-8.5 T by relaxation calorimetry. In the temperature range 20-300 K the specific heat was measured by a Quantum Design PPMS. The specific heat measurements have an absolute accuracy of %. The magnetization was measured with a commercial SQUID magnetometer in magnetic field range 0-5.5 T and with a Quantum Design PPMS in fields up to 9 T. Resistivity was measured by a standard four-probe technique.
III RESULTS
A Low temperature specific heat of La1-xCaxMnO3 with 16O and 18O
In our samples, substitution of 16O by 18O decreases the Curie temperature (determined from the temperature dependence of the magnetization in a magnetic field of 50 G) of La1-xCaxMnO3 significantly: TC(16O) - TC(18O) = 17.7 K, 11 K, 6 K for , 0.3, and 0.375 respectively. The dependence of the oxygen isotope effect and its values are consistent with prior work [3, 6, 16]. Our low temperature specific heat measurement of the 16O and 18O samples of these compositions is the same within the experimental error (%) in the temperature range from 2 K to 10 K, as shown in Fig. 1a,b for and 0.3. Since these materials are in the FM metallic state at low temperatures we fit the and 0.3 data to a form for K, where is the charge carrier contribution, the phonon contribution, and the ferromagnetic spin-wave contribution. This fitting range was chosen, because for K the hyperfine contribution from the nuclear magnetic levels of Mn ions may appear, and for , where is the Debye temperature, the higher terms of the lattice expansion (, etc.) could be present. We found that values of the respective fitting parameters for 16O and 18O samples ( mJ/mole K2, mJ/mole K2, mJ/mole K4, and mJ/mole K4 for samples and mJ/mole K2, mJ/mole K2, mJ/mole K4, and mJ/mole K2 for samples) coincide within experimental error. The best fit requires . As was noted in previous work [17, 18], it is difficult to resolve the ferromagnetic spin-wave contribution to the specific heat in FM metallic manganites due to its small value and the presence of the contribution.

Although we cannot resolve the spin-wave contribution from our data, it should not affect our conclusions, since inelastic neutron scattering [19] shows that the spin dynamics remains the same for 16O and 18O La1-xCaxMnO3 in this composition range at low temperatures. The values of the charge carrier () and lattice contribution () are close to that found in other FM metallic manganites [17, 18].
Although we did not observe a change in the lattice contribution to the specific heat in the temperature range K, the 18O samples should have a larger lattice contribution, since the frequencies of the lattice vibrations should be smaller for the heavier oxygen. We do not expect any measurable contribution from optical modes in this temperature range. For estimates of the changes in the lattice contribution with oxygen isotope substitution we consider , and therefore . This change in corresponds to only a 2% (below our resolution limit) increase of total specific heat for K, since the specific heat at low temperatures is dominated by the charge carrier contribution. However, at higher temperatures, where the specific heat is dominated by the lattice contribution, the specific heat of the 18O sample is larger, than that of the 16O sample (Fig. 1a, inset), which corresponds to a larger lattice contribution. The magnitude of this increase is consistent with estimates for the change in the lattice specific heat described above. After oxygen back-exchange (16O 18O; 18O 16O) the 16O -18O pairs of samples showed the same results: a significant change in and no change in the low temperature specific heat within experimental error.
In the charge-ordered compound La0.5Ca0.5MnO3 oxygen isotope substitution strongly increases the charge ordering temperature [4], which coincides for this compound with the temperature of the transition from FM to AFM state: TCO(16O) - TCO(18O) = 11.7 K (determined from the temperature dependence of the magnetization measured in G and the temperature dependence of the resistivity), but the low temperature specific heat remains unchanged (Fig. 1c). Thus, for single phase metallic and CO compositions the specific heat does not show any change in principal excitations (except for the expected increase of the lattice contribution for 18O samples which we observed for K, as mentioned above), which indicates that the ground state of these materials remains unchanged after oxygen isotope substitution.
B Low temperature specific heat of (La1-yPry)0.67Ca0.33MnO3 ()
To study the influence of oxygen isotope substitution on the materials with metallic and CO phase coexistence we chose (La1-yPry)0.67Ca0.33MnO3 (). Before presenting the experimental results for 16O - 18O samples, it is important to understand how compositional () variations affect the low temperature properties. Fig. 2 shows the temperature dependence of the resistivity, , of our (La1-yPry)0.67Ca0.33MnO3 () samples. The magnetization values at T and K (after zero field cooling (ZFC)) for different is shown in the inset of Fig. 2. For the , 0.5, and 0.6 compositions the temperature dependence of the resistivity changes from insulating at higher temperatures to metallic at low temperatures. The magnetization values at T (slightly above saturation field, but below the field where the CO is affected by the magnetic field) decreases with increase of indicating that the fraction of the FM phase decreases for compositions richer in Pr (Fig. 2, inset). This behavior of the resistivity and magnetization is consistent with previous work [12].

The low temperature specific heat of (La1-yPry)0.67Ca0.33MnO3 () is shown in Fig. 3. The specific heat of La0.7Ca0.3MnO3 in the temperature range from 4 K to 19 K is given by
| (1) |
where the higher term of the lattice contribution ( J/mole-K6) is required to fit the data in this temperature range. We express the specific heat of Pr0.65Ca0.35MnO3 in the temperature range from 4 K to 12 K in the following form [21]:
| (2) |
The first term in this electrically insulating sample originates from spin and charge disorder [21]. The second term represents the lattice and the AFM spin-wave contribution to the specific heat. The third term, , is an anomalous contribution present only in the CO state [21, 22], which manifests itself as upward curvature in the vs. plot. All the samples at intermediate compositions (, 0.5, and 0.6) exhibit the term even though the low temperature resistivity of
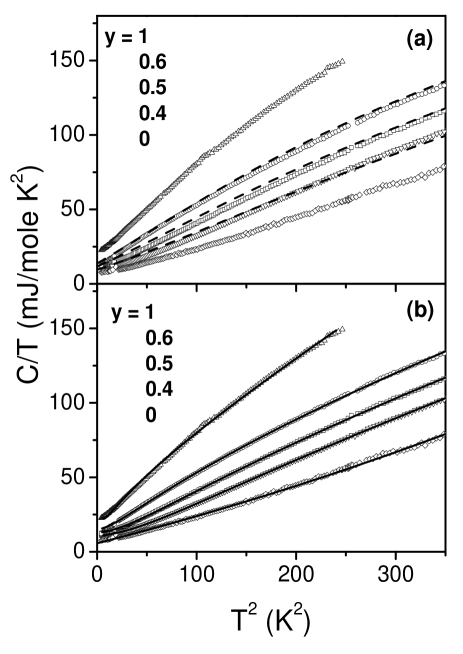
and 0.5 samples is similar to metallic La0.7Ca0.3MnO3. This indicates a presence of CO for metallic (at low T) compositions of (La1-yPry)0.67Ca0.33MnO3 (, 0.5, and 0.6) and, therefore, coexistence of CO insulating and
| y | ||||
| ((La1-yPry)0.67Ca0.33MnO3) | ||||
| 1 | 15.7 | 0.39 | 1.15 | 20.7 |
| 0.6 | 14.8 | 0.159 | 1.65 | 10.6 |
| 0.5 | 12.5 | 0.117 | 2.21 | 8.28 |
| 0.4 | 10.4 | 0.103 | 2.67 | 7.31 |
| 0 | 5.8 | 0.18 | ||
| 0.5 (18O) | 14.9 | 0.183 | 1.51 | 10.8 |
| 0.4 (18O) | 12 | 0.166 | 2.23 | 11.1 |
| 0.5 (18O T) | 9.6 | 0.13 | 2.31 | 7.79 |
| 0.5 (16O T) | 7.0 | 0.108 | 2.72 | 6.59 |
metallic phases. The presence of charge ordering below the metal-insulator transition was also observed by synchrotron x-ray diffraction in [15].
The specific heat of (La1-yPry)0.67Ca0.33MnO3 increases consistently with increase of the Pr content , suggesting the increase of the volume fraction of the CO phase. To test this assumption we consider the fraction of the metallic phase in (La1-yPry)0.67Ca0.33MnO3 to be proportional to the saturation magnetization value [12]. Since the magnetization is almost temperature independent in the temperature range from 2 K to 20 K, the fractions of the FM metallic phase in this temperature region are , , and for , 0.5, and 0.6 respectively (Fig. 2, inset). If we suppose that the FM fraction has the specific heat of La0.7Ca0.3MnO3 () and the CO fraction has the specific heat of Pr0.65Ca0.35MnO3 (), then the specific heat of such a two phase system can be expressed as . These calculated curves for , 0.5, and 0.6 samples are shown in Fig. 3a as dashed lines. These curves show a reasonable quantitative agreement with the experimental data, which argues strongly for the coexistence of CO and metallic phases at low temperatures in these materials. However, this approach does not give an exact agreement with the experimentally observed specific heat. A fit of the data to the form of Eq. (2) gives much better agreement with the data as shown by the solid lines in Fig. 3b. The values of the fitting parameters are shown in Table I, where we consider to be a contribution from nonmagnetic excitations with dispersion relation ( is an energy gap and is a wave vector) [21, 22]. These results show that the specific heat of , 0.5, and 0.6 samples is not just the linear combination of and . Since the phase separation in (La1-yPry)0.67Ca0.33MnO3 is electronic (not chemical), the presence of both La and Pr ions could modify the metallic and CO phase in these materials, and CO and metallic phases in phase separated regions of (La1-yPry)0.67Ca0.33MnO3 differ from CO and metallic phases of Pr0.65Ca0.35MnO3 and La0.7Ca0.3MnO3 respectively. The following analysis of the specific heat of (La1-yPry)0.67Ca0.33MnO3 samples will be done using Eq.(2), since the volume fraction approach gives less close agreement with the data.
C Specific heat, resistivity, and magnetization of (La1-yPry)0.67Ca0.33MnO3 with 16O and 18O
1 Low temperature specific heat and resistivity
The low temperature specific heat and resistivity of and 0.5 samples with 16O and 18O is shown in Fig. 4. The resistivity of these compositions is affected significantly by the oxygen isotope substitution (Fig. 4, insets): the onset of metallic behavior (the peak temperature for cooling run) decreases by 50 K for the sample and by 28 K for the sample; the low temperature value of the resistivity increases approximately by one order in magnitude for both compositions. The
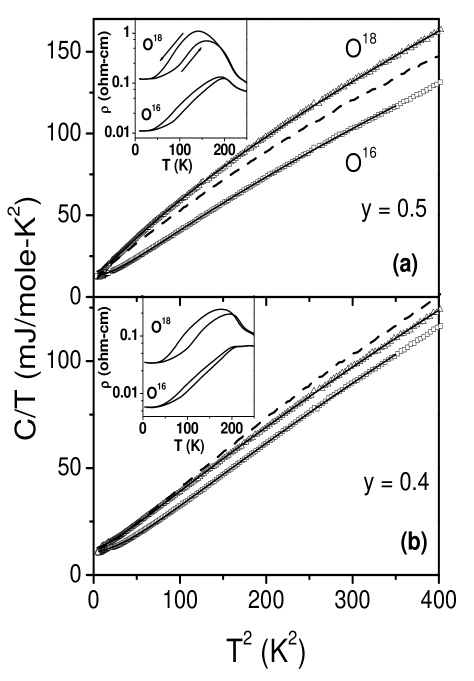
low temperature resistivity of metallic La1-xCaxMnO3 did not show such dramatic effects [23]. This behavior is consistent with previous work: substitution of 16O by 18O favors the insulating state [4, 5].
Unlike in the single phase metallic and CO compositions of La1-xCaxMnO3 (Fig. 1), in phase separated (La1-yPry)0.67Ca0.33MnO3 the substitution of 16O by 18O induces substantial changes in the low temperature specific heat (Fig. 4). The specific heat, dominated by the contribution in most of the temperature range, is larger for the 18O samples. This increase of the specific heat for the 18O sample is similar to the increase of the specific heat with an increase of the Pr content . The specific heat of the sample is shown in Fig. 4a for comparison. A result of the fits of our data to Eq. (2) is given in Table I. All fitting parameters are close to those of the higher value samples. These results indicate that the amount of the CO phase is larger in 18O samples.
2 High temperature specific heat and magnetization
The specific heat of 16O and 18O samples in the temperature range from 2 K to 270 K is shown in Fig. 5a. The room temperature value of the specific heat, 110 J/mole K, is in agreement with the room temperature values reported previously in manganites [18]. For both samples we observed a broad anomaly associated with transition to a magnetically and charge ordered state at K. Similar behavior was reported for an 16O sample of similar composition [15], where the anomaly in C(T) was attributed to the CO detected by x-ray diffraction. The temperature dependence of the magnetization measured in G and the inverse susceptibility is shown in the inset of Fig. 5a. The onset of the magnetic transition at K in both samples is best seen from the temperature dependence of the inverse susceptibility. The high temperature inverse susceptibility of both samples (which extrapolates to intersect the x-axis at positive value) indicates a FM interaction. However, for the 18O sample, the value of the inverse susceptibility increases (the magnetization drops) just below the transition at 220 K, which is indicative of a transition to the AFM state. This suggests a presence of competing FM and AFM interactions leading to a two phase coexistence in these materials. Ferromagnetic ordering in the 18O sample is established below K. The 16O sample exhibits a higher value of the magnetization below 220 K than expected for the AFM state, perhaps due to the presence of a fraction of the FM phase. The magnetization of the 16O sample increases further below 120 K indicating that a larger volume fraction becomes FM. These magnetization data of the 16O sample are consistent with [12], where the transition to a FM state from the CO AFM state and corresponding insulator to metal transition was shown to be of a percolative nature. The substitution of 16O by 18O does not change the temperature of the magnetic and CO transitions in this material but decreases the volume fraction of the FM phase. The specific heat does not show an anomaly associated with the metal-insulator transition for both samples, which is consistent with percolative nature of the transition occurring gradually over a wide temperature range.

The low temperature specific heat (2 K19 K) of the 18O sample is higher than that of 16O sample (Fig. 4a). This tendency persists also at higher temperatures (see Fig. 5a,b). This difference in specific heat of 18O and 16O samples is not primarily caused by an enhanced lattice contribution from the heavier atom: the difference in the lattice contributions at K, estimated from the Debye function, should be %, while the observed difference is %. A similar behavior is found for La0.5Ca0.5MnO3, which has an excess specific heat compared with metallic La0.7Ca0.3MnO3 (see Fig. 5c). This implies that the excitations responsible for the excess specific heat in the CO state [21] are also contributing at higher temperatures. In the case of (La1-yPry)0.67Ca0.33MnO3 () samples, the larger specific heat of the 18O sample (which comes from the excitations in the CO states) indicates a larger volume fraction of the CO phase over a wide temperature range.
3 Effect of a magnetic field
The field dependence of the magnetization for and 0.4 16O and 18O samples at K is shown in Fig. 6. Samples were cooled in zero magnetic field (ZFC) and the hysteresis loops in a magnetic field up to 9 T were taken. After ZFC the samples appear to be in a state with smaller than full spin alignment magnetization value. This indicates the FM and AFM phase coexistence in these materials. The values of the ZFC magnetization at T (where the saturation for the FM phase is reached) are smaller for the materials with 18O which corresponds to the larger fraction of the AFM phase in the 18O samples. At T the magnetic field starts to affect the CO (and associated AFM ordering) which causes an increase of the magnetization. In the 18O samples the transition is completed in magnetic fields higher than in 16O samples. Even when the transition is completed ( T), the magnetization value of the 18O samples is somewhat smaller than that of the 16O samples. These magnetization measurements show that substitution of 16O by 18O not only increases the fraction of the AFM CO phase, as shown by specific heat, but also lowers its energy, since it requires a higher magnetic field to stabilize the FM state than for the 16O samples. As in other CO compositions, once the FM phase is stabilized, the material remains in FM state even though the magnetic field is removed, and only heating the sample above the CO transition temperature can return it to the state with lower magnetization value.

Application of magnetic field of 8.5 T reduces the resistivity of the (La1-yPry)0.67Ca0.33MnO3 16O and 18O samples (Fig. 7, insets). The resistivity of both samples in T has a metallic temperature dependence (for K) with values essentially the same for 16O and 18O and close to the resistivity of the metallic La0.7Ca0.3MnO3.
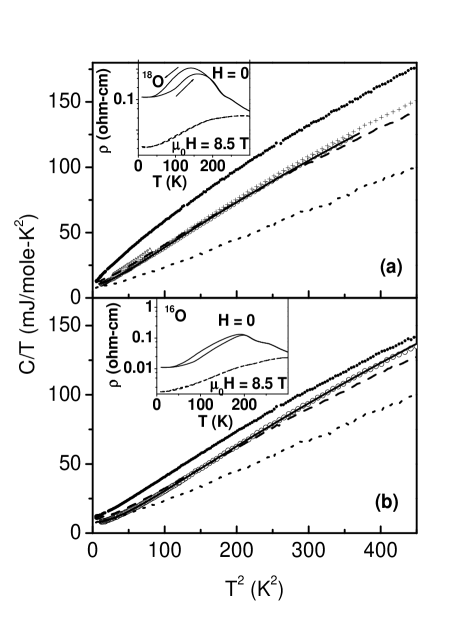
In T the specific heat of both samples drops significantly (Fig. 7, open circles), and tends to retain this low value when the magnetic field is reduced to 4 T (Fig.7a, crosses) and 0 T (triangles). This irreversible behavior is clearly demonstrated in the plot (Fig. 8). This is similar to the behavior of the magnetization - only by heating the sample above the CO transition temperature does the specific heat return to its higher value. We reported similar magnetic and thermal history dependencies associated with “melting” of the CO in magnetic field for Pr0.65Ca0.35MnO3 [22]. As in Pr0.65Ca0.35MnO3, the specific heat at T (magnetic field sufficient to induce a transition to the FM state (Fig. 6)) is significantly larger than of metallic La0.7Ca0.3MnO3 (dotted line in Figs. 7a and b) and exhibits the characteristic upward curvature of the CO state in the vs. plot. The specific heat in 8.5 T is similar to the specific heat of samples with a smaller fraction of the CO: for the 18O sample, is close to the zero field of 16O (dashed line in Fig. 7a), and for the 16O sample is close to the zero field of (dashed line in Fig. 7a). The results of fitting the 8.5 T data to Eq. 2 (see Table I) gives values close to the fitting parameters of the samples with the smaller fraction of the CO.

Unlike the magnetization, the (when the field is applied to a ZFC sample) at K and 10 K shows no saturation in a magnetic field of 8 T (Fig.8). If we attempt to relate the value of the magnetization to the fraction of the metallic phase and the rest to the fraction of the CO phase, as we did above for different , we can calculate the field dependence of the specific heat as . This calculated specific heat of the two phase mixture is not in agreement with the experimental data (Fig. 8): the ZFC calculated (dotted lines in Fig. 8) decreases rapidly in the field interval from 4 T to 6 T and saturates at T, while the ZFC experimental data have approximately the same slope up to T without a sign of saturation. As we noted before, the magnetization does not recover its full FM value even in magnetic field of 9 T, which probably means that some fraction of the AFM phase still remains at this field. These results indicate that the CO is not completely destroyed by the magnetic field sufficient to induce the FM transition. This phenomenon appears to be common for all CO manganites.
The magnetic field has a different effect on the samples with different oxygen isotopes. is higher for the 18O sample due to larger fraction of the CO phase remaining in this magnetic field, since (Fig. 7a) is close to to the zero field of the 16O with , while the of the 16O sample in 8.5 T is close to of the sample which has smaller fraction of the CO phase. This has qualitative agreement with the magnetization: larger magnetic field is needed to be applied to the 18O samples to induce the same effect on the charge ordering as for the 16O samples.
IV DISCUSSION
Our study shows that the principal excitations of single phase systems such as metallic compositions of La1-xCaxMnO3 and insulating charge-ordered La0.5Ca0.5MnO3 are not affected by oxygen isotope exchange. A recent theoretical model [20], which suggests that the ground state of metallic manganites is a polaronic Fermi-liquid, predicts an increase of the effective mass (and hence ) by about 3-6 % for the 18O material. Other authors point out that a large oxygen isotope effect on the effective mass of the charge carriers can only be expected for systems close to a local structural instability [24]. Recent neutron scattering experiments have shown that the spin-wave dynamics and therefore the exchange interaction is the same for ferromagnetic La1-xCaxMnO3 with 16O and 18O [19]. Also, Mossbauer effect measurements have shown that the exchange interaction does not change with oxygen isotope substitution [25]. These results also show that the metallic ground state of these materials is not affected by the oxygen isotope exchange, which is in agreement with our specific heat data because of the following reasons. Within the double exchange model, the exchange interaction is determined by the an effective transfer integral for an electron hopping between Mn ions. In the tight-binding approximation, the density of states at the Fermi level, , is inversely proportional to . Since the is directly proportional to , materials with the same exchange interaction should have the same . In contrast, drastic changes in the low temperature properties are observed for the phase separated (La1-yPry)0.67Ca0.33MnO3, associated, as we have shown, with an increase of the CO phase fraction in the 18O materials.
A large isotope effect was observed for the ferromagnetic transition in metallic compositions of La1-xCaxMnO3, but only a negligible effect was found for La1-xSrxMnO3 [3]. The charge ordering temperature changes significantly with isotope exchange for La0.5Ca0.5MnO3 and Nd0.5Sr0.5MnO3, but not for Pr0.5Ca0.5MnO3 [4]. So what is in common for the large isotope effect materials? We believe it is the fact that the phase transition is first order and a phase separation is observed in the temperature region where the transition occurs. The FM transition in La1-xCaxMnO3 is believed to be the first order because the heat capacity peak associated with FM transition shifts significantly with application of magnetic field [26] and the spin dynamics observed in the vicinity of the FM transition is not consistent with a second order transition [29]. Moreover, there is strong evidence for phase separation in the vicinity of the Curie temperatures for La1-xCaxMnO3 [2, 27]. In contrast, La1-xSrxMnO3 does not exhibit a phase separation near the FM transition and the phase transition in this material is second order [28]. The charge ordering transition for La0.5Ca0.5MnO3 and Nd0.5Sr0.5MnO3 is a first order transition from a FM metal phase to a AFM CO phase accompanied by a hysteresis, showing the presence of both phases in the transition region. But Pr0.5Ca0.5MnO3 has a transition from a charge disordered to a charge ordered phase without signs of phase separation [30] and this transition is probably second order.
As was pointed out by some authors [24, 31], the polaron effect alone [3] is too small to induce the observed changes associated with oxygen isotope exchange. Perhaps the polaron bandnarrowing effect produced by 18O induces localization effects in the phase separated region, which stabilizes the CO phase and leads to the increase of the volume fraction of the CO phase, as we observe for (La1-yPry)0.67Ca0.33MnO3. This leads to a decrease of the Curie temperature and an increase of the CO temperature in the phase separated system. In this picture, the largest effects should be observed near the percolation threshold, which is consistent with our observation that (La1-yPry)0.67Ca0.33MnO3 with exhibit larger changes with oxygen isotope exchange than , and with the fact that for the oxygen isotope exchange induces a metal to insulator transition [5].
The experimental facts discussed above suggest: 1) the free energy of the CO phase is lower for 18O than for 16O, 2) the free energy of the metallic phase does not change much with oxygen isotope exchange, and 3) the large isotope effect on the transition temperature occurs when the transition is of first order (phase separation occurs). Fig. 9a shows a schematic free energy diagram in the vicinity of the FM - CO transition which occurs for La0.5Ca0.5MnO3 and Nd0.5Sr0.5MnO3 compositions. Since the transition is first order, the free energy curve of the CO state crosses the of the FM state at and the CO state has a lower value of at . The of the CO phase of 18O material is lower than the 16O material. Therefore, the of the CO phase of 18O material intersects the of the FM phase at higher temperature, (18O) (16O). Using this picture, the change in the CO temperature = (18O) - (16O) can be approximated as = , where is the difference between the free energy of the 16O and 18O CO phases, and is the difference in entropy (d/d) of the CO and FM phases at the transition temperature.
The entropy change associated with this transition was found to be 5 J/mole K for La0.5Ca0.5MnO3 [32]. To estimate , we use the experimental fact that the magnetic field sufficient to destroy the CO state and induce a transition to the FM state is higher for 18O than for 16O (see, for example, Fig. 6). The gain in magnetic energy associated with the transition to the FM state is , where is the magnetization of the FM state. The difference between the values for 18O and 16O materials should correspond to the difference in free energy of the CO state of the 18O and 16O materials. The transition to the FM state for La0.5Ca0.5MnO3 occurs at magnetic fields higher than 9 T [33], beyond our experimental field limit. Therefore, we approximate the difference in free energy of the CO state of the 18O and 16O materials from our data for (La1-yPry)0.67Ca0.33MnO3 (Fig. 6). Although the transition to the FM state is very broad for both 18O and 16O samples, a saturation occurs for the 18O sample at a magnetic field 2 T higher than for the 16O sample. Thus, (18O) - (16O) J/mole, and estimated increase in the CO transition temperature K, which is the same order as the observed K. This agreement suggests that the proposed free energy diagram (Fig. 9a) is valid.
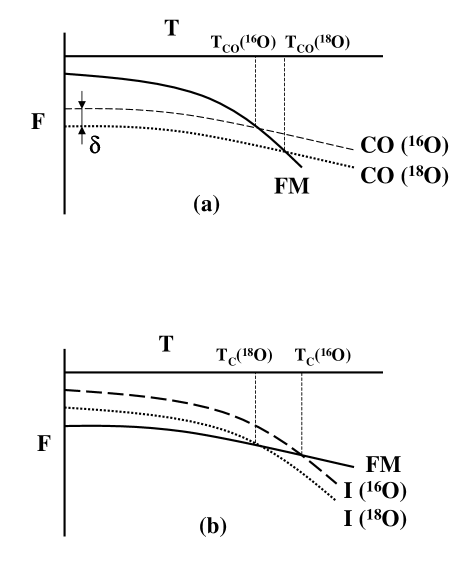
In the case of the FM transition in La1-xCaxMnO3 () in the vicinity of the FM transition the free energy curve of the insulating state crosses the of the FM state at and the FM state has a lower value of at (Fig.9b). The insulating state of La1-xCaxMnO3 () shows a signature of short range charge ordering [27] in the vicinity of the FM transition. We argue that the substitution of 18O for 16O increases the volume fraction of the CO phase in the vicinity of the FM transition, which lowers the free energy of the insulating state. This shifts the crossing of of the insulating state with of the FM state to lower temperature (Fig. 9b), in agreement with the lowering of observed when 18O replaces 16O in these materials.
V CONCLUSIONS
We have studied the influence of oxygen isotope exchange on the resistivity, magnetization, and specific heat of single phase and phase separated manganites. We have found that the principal excitations in single phase metallic and CO materials do not change with oxygen isotope substitution, while isotope exchange induces large changes in the low temperature properties of phase separated (La1-yPry)0.67Ca0.33MnO3. The variation of the specific heat with Pr content in (La1-yPry)0.67Ca0.33MnO3 samples is consistent with the larger volume fraction of the CO phase for higher . Oxygen isotope exchange in these materials induced changes similar to the increase of the Pr content which suggests an increase of the volume fraction of the CO phase in 18O samples.
Similar to other CO materials (Pr1-yCayMnO3, La0.5Ca0.5MnO3) all studied composition of (La1-yPry)0.67Ca0.33MnO3 () have shown the presence of the anomalous contribution to the low temperature specific heat due to the presence of the CO phase. The excess specific heat is also present at higher temperatures () for the CO materials, or materials containing larger fraction of the CO phase. Specific heat measurements indicate that the charge ordering is not destroyed completely by the application of a magnetic field of 8.5 T in contrast to the resistivity which shows a compleat “melting” of the CO. The nature of the excitations responsible for the term in the specific heat of the CO materials, and the presence of this term in rather strong magnetic field, has yet to be explained.
We suggest that the giant isotope effect on the Curie temperature and the CO temperature in manganites occurs in materials where these transitions are first order and hence, where the CO phase is present in the vicinity of the phase transition. 18O lowers the energy of the CO phase, which leads to an increase in the volume fraction of the CO phase in the phase separated regions. This leads to a decrease of the Curie temperature and increase of the CO temperature. A detailed understanding of the mechanism lowering the energy of the CO phase in the 18O materials still needs to be developed.
Acknowledgment: We thank A. J. Millis for helpful discussions, S-W. Cheong for providing us with as-grown La0.625Ca0.375MnO3 sample and helpful discussion, Z. Li for the sample preparation. The work at Maryland is supported in part by the NSF-MRSEC, DMR #00-80008. The work in Sherbrooke is supported by the Canadian Institute of Advanced Research (CIAR), the Canadian Foundation for Innovation (CFI), the Natural Sciences and Engineering Research Council of Canada (NSERC) and the Fondation FORCE of the Universite de Sherbrooke.
REFERENCES
- [1] M. Uehara, S. Mori, C. H. Chen, and S-W. Cheong, Nature 399, 560 (1999).
- [2] M. Fäth, S. Freisem, A. A. Menovsky, Y. Tomioka, J. Aarts, and J. A. Mydosh, Science 285, 1540 (1999).
- [3] Guo-meng Zhao, K. Conder, H. Keller, and K. A. Muller, Nature 381, 676 (1996).
- [4] I. Isaac and J. P. Franck, Phys. Rev. B 57, R5602 (1998); Guo-meng Zhao, K. Ghosh, and R. L. Greene, J. Phys.: Condens. Matter 10, L737 (1998); Guo-meng Zhao, K. Ghosh, H. Keller, and R. L. Greene, Phys. Rev. B 59, 81 (1999); R. Mahesh and M. Itoh, J. Solid State Chemistry 144, 232 (1999).
- [5] Guo-meng Zhao, H. Keller, J. Hofer, et al., Solid State Commun. 104, 57 (1997); N. A. Babushkina, L. M. Belova, O. Yu. Gorbenko, A. R. Kaul, A. A. Bosak, V. I. Ozhogin, and K. I. Kugel, Nature 391, 159 (1998).
- [6] J. P. Franck, I. Isaac, Weimin Chen, J. Chrzanowski, and J. C. Irwin, Phys. Rev. B 58, 5189 (1998).
- [7] Unjong Yu, Yu. V. Skrypnyk, and B. I. Min, Phys. Rev. B 61, 8936 (2000).
- [8] Guo-meng Zhao et al., Phys. Rev. B 62, R11949 (2000).
- [9] N. A. Babushkina, L. M. Belova, V. I. Ozhogin, O. Yu. Gorbenko, A. R. Kaul, A. A. Bozak, D. I. Khomskii, and K. I. Kugel, J. Appl. Phys. 83, 7369 (1998).
- [10] V. Z. Kresin and S. A. Wolf, J. Appl. Phys. 83, 7357 (1998).
- [11] E. L. Nagaev, Phys. Rev. B 58, 12 242 (1998).
- [12] K. H. Kim, M. Uehara, C. Hess, P. A. Sharma, and S-W. Cheong, Phys. Rev. Lett. 84, 2961 (2000).
- [13] V. Podzorov, M. Uehara, M. E. Gershenson, T. Y. Koo, and S-W. Cheong, Phys. Rev. B 61, R3784 (2000).
- [14] N. A. Babushkina, L. M. Belova, D. I. Khomskii, K. I. Kugel, O. Yu. Gorbenko, A. R. Kaul, Phys. Rev. B 59, 6994 (1999).
- [15] V. Kiryukhin, B. G. Kim, V. Podzorov, S-W. Cheong, T. Y. Koo, J. P. Hill, I. Moon, and Y. H. Jeong, Phys. Rev. B 63, 024420 (2001).
- [16] Gou-meng Zhao, K. Conder, H. Keller, and K. A. Muller, Phys. Rev. B 60, 11 914 (1999).
- [17] J. J. Hamilton, E. L. Keatley, H. L. Ju, A. K. Raychaudhuri, V. N. Smolyaninova, and R. L. Greene, Phys. Rev. B 54, 14 926 (1996).
- [18] L. Ghivelder, I. Abrego Castillo, N. McN. Alford, G. J. Tomka, P. C. Riedi, J. MacManus-Driscoll, A. K. M. Akther Hossain, L. F. Cohen, J. Magn. Magn. Mater. 189, 274 (1998); M. R. Lees, O. A. Petrenko, G. Balakrishnan, and D. M. Paul, Phys. Rev. B 59, 1298 (1999).
- [19] J. Lynn et al. to be published.
- [20] A. S. Alexandrov, Guo-meng Zhao, H. Keller, B. Lorentz, Y. S. Wang, and C. W. Chu, cond-mat/0011436 v2 (2000).
- [21] V. N. Smolyaninova, Amlan Biswas, X. Zhang, K. H. Kim, Bog-Gi Kim, S.-W. Cheong, and R. L. Greene, Phys. Rev. B 62, R6093 (2000).
- [22] V. N. Smolyaninova, K. Ghosh, and R. L. Greene, Phys. Rev. B 58, R14725 (1998).
- [23] Guo-meng Zhao, D. J. Kang, W. Prellier, M. Rajeswari, H. Keller, T. Venkatesan, and R. L. Greene, Phys. Rev. B 63, 060402 (2001).
- [24] Andreas Deppeler and Andrew J. Millis, cond/mat/0004200 (2000).
- [25] V. Chechersky, Amar Nath, I. Isaac, J. P. Franck, K. Ghosh, and R. L. Greene, Phys. Rev. B. 60, 3005 (1999).
- [26] P. Lin, S. H. Chun, M. B. Salamon, Y. Tomioka, and Y. Tokura, J. Appl. Phys. 87, 5825 (2000).
- [27] C. P. Adams, J. W. Lynn, Y. M. Mukovskii, A. A. Arsenov, and D. A. Shulyatev, Phys. Rev. Lett. 85, 3954 (2000); J. M. Zuo and J. Tao, Phys. Rev. B 63, 060407-R (2001); S. J. L. Billinge, Th. Proffen, V. Petkov, J. L. Sarrao, and S. Kycia, Phys. Rev. B 62, 1203 (2000); C. S. Nelson et al., cond-mat/0011502.
- [28] K. Ghosh, C. J. Lobb, R. L. Greene, S. G. Karabashev, D. A. Shulyatev, A. A. Arsenov, and Y. Mukovskii, Phys. Rev. Lett. 81, 4740 (1998).
- [29] J. W. Lynn, R. W. Erwin, J. A. Borchers, Q. Huang, A. Santoro, J-L. Peng, and Z. Y. Li Phys. Rev. Lett. 76, 4046-4049 (1996).
- [30] S. Mori, T. Katsufuji, N. Yamamoto, C. H. Chen, and S-W. Cheong, Phys. Rev. B 59, 13 573 (1999).
- [31] D. Khomskii, Physica B 280,325 (2000).
- [32] A. P. Ramirez, P. Schiffer, S-W. Cheong, C. H. Chen, W. Bao, T. T. M. Palstra, P. L. Gammel, D. J. Bishop, and B. Zegarski, Phys. Rev. Lett. 76, 3188 (1996).
- [33] Gang Xiao, G. Q. Gong, C. L. Canedy, E. J. McNiff, Jr., A. Gupta, J. Appl. Phys. 81, 5324 (1997).