Time-dependent energy absorption changes during ultrafast lattice deformation
Abstract
The ultrafast time-dependence of the energy absorption of covalent solids upon excitation with femtosecond laser pulses is theoretically analyzed. We use a microscopic theory to describe laser induced structural changes and their influence on the electronic properties. We show that from the time evolution of the energy absorbed by the system important information on the electronic and atomic structure during ultrafast phase transitions can be gained. Our results reflect how structural changes affect the capability of the system to absorb external energy.
I Introduction.
For systems in thermodynamical equilibrium the occurrence of phase transitions can be inferred from a change in the behavior of the thermodynamic potentials (or its derivatives) as a function of an intensive variable. For instance, divergences or abrupt changes in the heat capacity are indicators for most first-order phase transitions. In systems subject to extreme nonequilibrium conditions like excitation with an intense femtosecond laser, neither thermodynamic functions nor intensive variables are well defined. However, a large variety of nonequilibrium phase transitions can be induced by femtosecond laser pulses, as has been demonstrated both experimentally and theoretically [1, 2, 3]. Such ultrafast phase transitions are detected indirectly by time-dependent changes of the optical properties [4, 5, 6] or directly by post mortem analysis [7] and recently through more direct measurements using ultrashort X-ray pulses [8, 9]. In a recent experimental study, Musella et al. reported results on the excitation of graphite with very long pulses (in the millisecond range). The thermogram recorded during the heating of the sample shows a sharp increase of the temperature slope at the melting point, which corresponds to changes in the energy absorption and heat conductivity upon melting. Note that in these experiments, thermal equilibrium is reached during the excitation. Note that in the case of femtosecond excitation is a physical quantity, whereas and are no longer well defined. The question which immediately arises from this analysis is: Does show similar changes as in the case of thermal equilibrium when the system is illuminated by a femtosecond laser pulse?
In this paper we show that this is the case, and that exhibits dramatic changes as a function of laser intensity when the system undergoes an ultrafast phase transition. This leads to a natural generalization of “heat capacity” for laser induced nonequilibrium processes as .
In Sec. II we briefly review our method of calculating the structural response of covalent materials during and after intense laser excitation. In Sec. III we present results for diamond and graphite, concentrating on the efficiency with which energy is absorbed from the laser pulse. We show that the structural changes during the action of the pulse are particularly important for the understanding of the nonlinear dependence of the absorbed energy on the intensity of the pulse. As these structural changes occur on a time scale of approximately 100 fs the pulse duration is responsible for very different absorption behavior in the fs to fs pulse duration range. Finally, in Sec. IV we summarize our results.
II Theory.
The calculation of the energy absorption of covalent solids is based upon a theory for the analysis of laser induced ultrafast processes in solids. The theory employs a molecular dynamics method on the basis of an electronic tight-binding Hamiltonian. This real-space calculation takes into account all atomic degrees of freedom. Special attention is paid to the strong nonequilibrium created in the electronic system by the ultrashort laser pulse. A method of calculating nonequilibrium occupation numbers for the energy levels of the system leads to a molecular dynamics calculation on time-dependent potential energy surfaces. This approach provides a theoretical framework for the treatment of strong nonequilibrium situations in materials where atomic and electronic degrees of freedom play an equally important role.
In this theory trajectories for laser induced structural changes are determined by molecular dynamics simulations for which we calculate forces from the Hamiltonian
| (1) |
The second term contains a repulsive potential that takes care of the repulsion between the ionic cores, and the first term is a tight-binding Hamiltonian
| (2) |
Here, the first term is the on-site contribution. In the second term, the are the hopping integrals, and and are creation and annihilation operators for an electron at site or in orbitals or , respectively.
From the Hamiltonian, Eq. (1), we calculate forces using the Hellman-Feynman theorem:
| (3) |
Here, stands for the eigenvector of the Hamiltonian that corresponds to the eigenvalue . The special feature of the theory which makes it applicable to optically excited materials is contained in the time dependent occupation numbers for the energy levels of the system. While in thermal equilibrium these occupation numbers are calculated from a Fermi-Dirac distribution function at a given electronic temperature , electronic nonequilibrium is accounted for by solving equations of motion for the occupation of electronic states:
| (4) |
Thus, the electronic distribution is at each time step folded with the pulse intensity function . This means that at each time step, the occupation of an energy level changes in proportion to the occupation difference with respect to levels at and at . In Eq. (4), constant optical matrix elements are assumed. The second term of Eq. (4) describes the electron-electron collisions that lead to an equilibration of the electronic system with a rate equation of the Boltzmann type for the distribution . Hence, with a time constant , the distribution approaches a Fermi-Dirac distribution .
The electron temperature that results from the electron thermalization will not remain constant over time, but will decrease due to electron-phonon coupling and to diffusion of hot electrons out of the laser excited region of the solid into colder areas. In the regime of an excitation of typically 10 % of the valence electrons into the conduction band for which this theory is intended no precise knowledge about thermal conductivity of the electrons and electron-phonon coupling constants is available. Thus, a relaxation time which characterizes the time scale of the total decrease of the electron temperature by both the electron-phonon and by the hot electron diffusion processes is assumed:
| (5) |
This simple relaxation time approach has the advantage that the time scale on which the electron-lattice equilibration takes place can be taken from experiment.
The forces given by Eq. (3) can now be used to solve the equations of motion for the atoms numerically. In the case of a bulk system, a constant pressure molecular dynamics (MD) scheme is used. This is based on a Lagrangian which contains the shape and size of the molecular dynamics supercell as additional degrees of freedom [10]:
| (6) |
The first term is the kinetic energy of the atoms, with the coordinates of the atoms written in terms of the relative coordinates and the -matrix that contains the vectors spanning the MD supercell; are the relative velocity vectors, and T denotes transposition. is the potential which is calculated from a tight-binding formalism as explained above. The terms in the Lagrangian of Eq. (6) which are responsible for the simulation of constant pressure are an additional kinetic energy term for which the simplest form is [10], and is an additional potential term which describes the effect of an isotropic external pressure ; is the volume of the MD supercell. The equations of motion are derived from Eq. (6) by the Euler-Lagrange formalism, and they are integrated numerically with the velocity form of the Verlet algorithm [11, 12].
III Results.
The dependence of the absorption of energy on the laser pulse intensity and duration shows an interesting behaviour. The following results have been calculated in the bulk and for constant pressure. Diamond and graphite samples of atoms per MD supercell were thermalized to a temperature of K by simulated annealing before absorbing laser pulses of a wide range of intensities and durations.
Results for absorption of carbon in its diamond structure are shown in Fig. 1. Every square () corresponds to a calculated trajectory. Note, the lines connecting the dots are drawn to guide the eye. The graph represents the actual absorbed energy in units of electron volts per atom as a function of the laser intensity for different pulse durations. This quantity is denoted here as the “offered” energy. It is the energy that would have been absorbed by the system, if no structural changes had taken place. Thus, the “offered” energy is determined by performing the calculation of energy absorption for fixed atomic coordinates. Note, structural distortions change the electronic structure of the material and consequently the absorption characteristics.
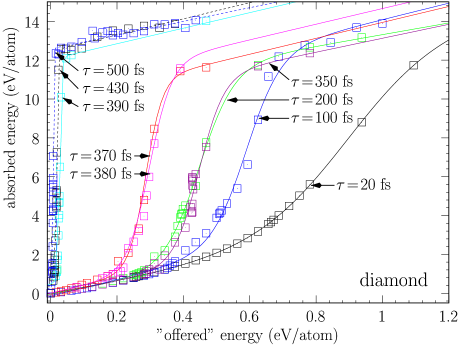
A general trend shared by all but the fs to fs curves in Fig. 1 is a moderate, linear increase of absorption with intensity up to an absorbed energy of roughly eV/atom. Then a sharp increase of absorption until approximately eV/atom occurs. Then we find again a moderate linear increase of absorption with laser intensity. The results show that the absorption increases more sharply with increasing pulse duration. With increasing duration of the laser pulse, the laser intensity for which the sharp increase in absorption occurs decreases significantly. The curves for long pulse durations are even characterized by the absence of an initial weak increase of absorption with intensity.
In Fig. 2 we show the absorbed energy of diamond as a function of time. The laser pulse duration was fs. This figure serves as an example to clarify how the form of the absorbed energy curves of Fig. 1 comes about. Fig. 2 is directly related to the fs curve of Fig. 1: Each final absorbed energy at fs in Fig. 2 corresponds to a result () in the fs curve of Fig. 1.
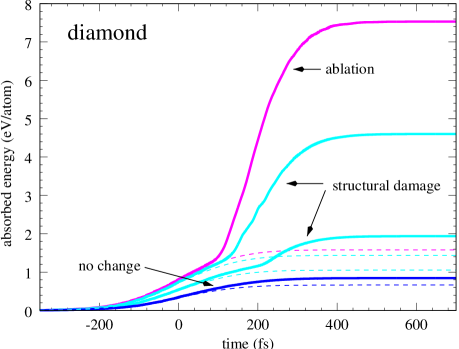
Fig. 2 shows the absorbed energy for four different intensities. The final state of the material is indicated. The lowest pulse intensity does not lead to structure changes, due to the two medium intense pulses, the diamond structure is damaged, and the strongest pulse leads to ablation of the material. In Fig. 2 the absorption that would have been expected if no structural changes had occurred during the action of the laser pulse is indicated by dashed lines. We observe that the deviation of the energy actually absorbed by the material from the expected value increases with increasing pulse intensity. In the case of the trajectory where diamond remains unchanged, the actual absorption is very close to the expected value. However, in trajectories where structural damage or even ablation is observed the actual absorption sharply deviates from the expected absorption.
The cause for this sharp deviation will be explained with the help of the densities of states shown in Fig. 3. They correspond to the curve of Fig. 2 with the second-highest absorbed energy. In Fig. 3 (a) the DOS before the laser pulse at fs is shown; the time is measured with respect to the maximum of the laser pulse of fs duration. The DOS corresponds to diamond at K. The DOS in Fig. 3 (b) is taken at fs which corresponds to the time of the sharp bend in Fig. 2. In the DOS, the emergence of states in the eV gap of diamond can be observed. This explains the strong increase in absorption. Fig. 3 (c) shows the DOS at fs. At this time the intensity of the laser pulse has already decreased significantly from its maximum value, but in the DOS, states have completely filled the diamond gap, and the absorption of the material is far stronger than before the pulse.

An explanation of the overall behaviour of the absorption in the material must be given by the time-dependent changes in the density of states. Note, this is the main material property taken into account in the treatment of the absorption. This time dependency of the DOS is caused by the structural changes induced by the laser pulse. Inspection of the trajectories shows that the sharp bend of the graphs close to an absorbed energy of eV corresponds to the damage threshold of the material. The damage (disorder) causes the eV gap present in diamond to be filled with states until the gap-less DOS is reached. For pulses that are long enough to permit the structural changes to occur before the intensity has fallen off completely, the electronic states that fill the gap of diamond will enormously increase the absorption of the material. Thus, the fs graph shows only a slight increase of the absorption above the damage threshold, because the pulse has already run out before essential changes in the structure have taken place. On the other hand, the fs to fs graphs show an absorption growing sharply with pulse intensity, because all structural changes induced by the laser can take place while the pulse intensity is still high. Thus, the changed DOS has a strong influence on the energy that can finally be absorbed from the pulse.
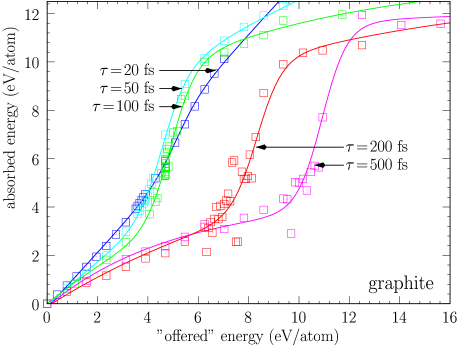
In Fig. 4, the absorption behaviour for a graphite sample is shown. The data are presented in the same way as in Fig. 1. For graphite, the absorption for a given pulse duration depends on the pulse intensity in a fashion similar to that found in diamond. Again, a strong increase of absorption takes place at the damage threshold, which in graphite is found to be at roughly 3 eV. At this threshold, melting of graphite and the destruction of the graphite planes takes place. At lower intensities, absorption shows a moderate, linear increase with laser intensity. However, an important difference can be observed in the ordering of the curves. In the case of graphite, the slope of the absorption curves is lower for higher pulse durations. Interpreting this with the help of the density of states, we find that structural relaxation taking place during the pulse decreases the density of states close to the Fermi level and thus prevents absorption of energy from the laser pulse. A physical picture for this effect can be derived from the bonding character: Vibrational excitation of the graphite planes causes atoms to be displaced perpendicular to the plane, and thus the 3-dimensional distortion of the 2-dimensional graphite structure causes the pure bonding of graphite to be modified with an addition of bonding.
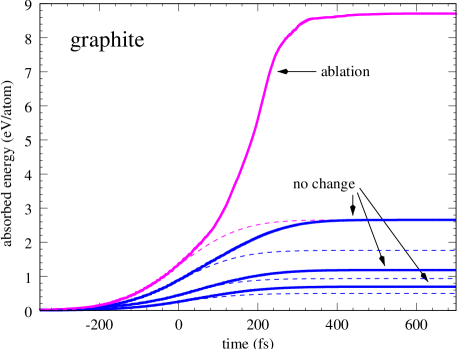
In Fig. 5 we show the absorbed energy of graphite as a function of time. The pulse duration was fs. Three low laser intensities produced no change in the graphite structure, while a fourth pulse leads to ablation of the material. For comparison, the absorbed energy that would be expected if no structural change took place during the action of the pulse is shown with dashed lines. As in the case of diamond (compare Fig. 2) with increasing pulse intensity the deviation of the actual absorbed energy from the expected value becomes more pronounced.
In order to analyze the cause of the increased absorption of energy we show in Fig. 6 selected densities of states during the action of the laser pulse. These densities of states correspond to the trajectory with the highest absorbed energy in Fig. 5. At fs, i. e. 700 fs before the laser pulse maximum, the DOS is that of graphite at K. At fs the overall width of the DOS has decreased while the DOS close to the Fermi level has increased. At fs, a very high DOS around the Fermi level has developed, indicating a metallic liquid phase of the material. This explains the strong increase of absorption during the action of the laser pulse.
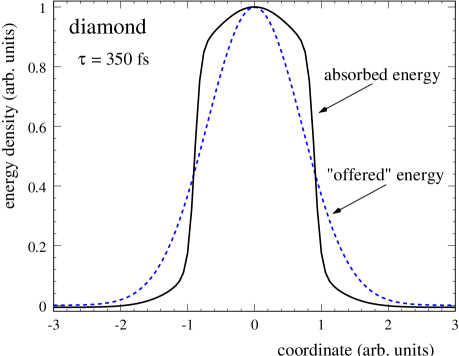
In Fig. 7 we show a consequence of the behaviour of the absorbed energy for the spatial absorption profile of diamond. Typically, a laser pulse has a Gaussian profile in space. The different absorbed energies that result as a consequence of structural changes in the material during the action of the pulse leads to the spatial absorption profile shown in Fig. 7. It is remarkable that the profile of the absorbed energy is much steeper than the profile of the pulse. This may be of importance in the interpretation of ablation experiments.
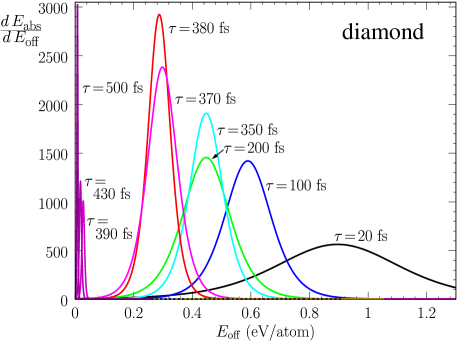
In the introduction we have suggested characterizing the energy absorption behavior of a system in strong nonequilibrium by a generalized “heat capacity” defined as . We illustrate this concept in Fig. 8 in the case of diamond. The derivative of the absorbed energy with respect to “offered” energy is plotted as a function of “offered” energy. As explained above we define the “offered” energy as the energy that would be absorbed by the system if no structural changes occurred during the action of the pulse. Thus, the “offered” energy is proportional to the laser intensity and the quantity shown in Fig. 8 is proportional to . The behavior of this quantity shows a peak which is most pronounced for long pulse durations (see Fig. 8). The peak position corresponds to the laser intensity which induces changes in the structure and in the DOS of the material that are most suitable to enhance the absorption of energy. To the left of the peak, the laser is not strong enough to induce structural changes in the material while the pulse is still active. To the right of the peak, the laser intensity is so high that evaporation of the material sets in during the action of the pulse which leads to decreased absorption of energy.

IV Summary.
We have calculated the absorption of energy from intense laser pulses in diamond and graphite. An interesting nonlinear dependence of the absorbed energy on the laser intensity is observed. Analysis of the density of states of the materials at different times during the action of the laser pulse shows that an enhanced absorption of energy is due to ultrafast changes in the DOS which in turn are caused by the structural relaxation of the excited material setting in during the action of the exciting pulse. As these structural changes occur on a time scale of approximately 100 fs the pulse duration plays an important role in determining the influence of the structural relaxation on the absorption behavior.
In summary, the results show the dependence of absorption on the light pulse form and the occurring structural changes of these materials. These results may also depend on the frequency and polarisation of the laser pulse. Nevertheless, the fact that nonthermal processes may occur during the action of the laser pulse and thus change the absorption of the material is of general validity.
If we compare the theoretical result for the dependence of absorbed energy on pulse intensity for graphite (see Fig. 4) with the experimental result of Ronchi et al. [13] we find a surprising similarity. Although the pulse duration ms in the experiment was far higher than that considered in the calculation, the increase of absorption at the melting point should have a similar explanation as the increase of absorption at the damage threshold in the calculation. It is remarkable that the effect reported by Ronchi et al. is also present for ultrashort laser pulses.
V Acknowledgments.
This work has been supported by the Deutsche Forschungsgemeinschaft through SFB 450. Our simulations were done on the CRAY T3E at Konrad-Zuse-Zentrum für Informationstechnik Berlin.
REFERENCES
- [1] K. Sokolowski-Tinten, J. Bialkowski and D. von der Linde, Phys. Rev. B 51, 14186 (1995).
- [2] K. Sokolowski-Tinten, J. Solis, J. Bialkowski, J. Siegel, C. N. Afonso and D. von der Linde, Phys. Rev. Lett. 81, 3679 (1998).
- [3] H. O. Jeschke, M. E. Garcia and K. H. Bennemann, Phys. Rev. B 60, R3701 (1999).
- [4] D. H. Reitze, H. Ahn and M. C. Downer, Phys. Rev. B 45, 2677 (1992).
- [5] K. Sokolowski-Tinten, J. Bialkowski, A. Cavalleri, D. von der Linde, A. Oparin, J. Meyer-ter-Vehn and S. I. Anisimov, Phys. Rev. Lett. 81, 224 (1998).
- [6] J. P. Callan, A. M.-T. Kim, C. A. D. Roeser, E. Mazur, J. Solis, J. Siegel, C. N. Afonso, and J. C. G. de Sande, Phys. Rev. Lett. 86, 3650 (2001).
- [7] M. Lenzner, J. Krüger, S. Sartania, Z. Cheng, Ch. Spielmann, G. Mourou, W. Kautek, and F. Krausz, Phys. Rev. Lett. 80, 4076 (1998).
- [8] C. Rose-Petruck, R. Jimenez, T. Guo, A. Cavalleri, C. W. Siders, F. Ráksi, J. A. Squier, B. C. Walker, K. R. Wilson and C. P. J. Barty, Nature 398, 310 (1999).
- [9] A. Rousse, C. Rischel, S. Fourmaux, I. Uschmann, S. Sebban, G. Grillon, Ph. Balcou, E. Förster, J. P. Geindre, P. Audebert, J.C. Gauthier and D. Hulin, Nature 410, 65 (2001).
- [10] M. Parrinello and A. Rahman, Crystal structure and pair potentials: A molecular-dynamics study, Phys. Rev. Lett. 45, 1196 (1980).
- [11] L. Verlet, Computer “Experiments” on Classical Fluids. I. Thermodynamical Properties of Lennard-Jones Molecules, Phys. Rev. 159, 98 (1967).
- [12] J. M. Haile, Molecular dynamics simulation: elementary methods, John Wiley & Sons, New York 1975.
- [13] M. Musella, C. Ronchi, M. Brykin and M. Sheindlin, J. App. Phys. 84, 2530 (1998).