Photoemission view of electron fractionalization in quasi-one dimensional metal Li0.9Mo6O17
Abstract
We report Luttinger liquid (LL) line shapes better revealed by new angle resolved photoemission data taken with a much improved angle resolution on a quasi-1-dimensional metal Li0.9Mo6O17. The new data indicate a larger spinon velocity than our previous lower resolution data indicated.
keywords:
Angle resolved photoemission, Luttinger liquid, Charge density waveOf central interest in current condensed matter physics is the fractionalization [1] of an electron into density waves in a quasi one dimensional (quasi-1D) metal, e.g. spinons and holons in the Luttinger liquid (LL), and dimensional crossover [2] in which an electron (or a Landau quasi-electron) re-emerges as the effective dimension is changed to three, e.g. by lowering the temperature (T) through a phase transition. Angle resolved photoemission spectroscopy (ARPES) is an ideal tool to study these phenomena through the view of the single particle spectral function, and we have shown [3, 4, 5] that the quasi-1D metals Li0.9Mo6O17 and K0.3MoO3 are very good materials for such studies. In particluar, the former is suitable for studying the fractionalization phenomenon and the latter for the the dimensional crossover phenomenon. In this paper, due to the space limit, we discuss Li0.9Mo6O17 only.
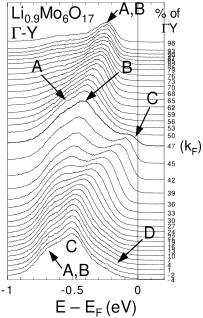
In our previous work [3] on Li0.9Mo6O17, we reported non-Fermi liquid (non-FL) ARPES line shapes which compared favorably with an LL theory. In this paper, we analyze data taken with better angular resolution (0.36o instead of 2o), which give a better view of LL line shapes. Therefore, this paper can be viewed as providing details of our previous work [4, 5] disproving another group’s claim [7] that FL line shapes are revealed by improved angle resolution in Li0.9Mo6O17. Fig. 1 shows ARPES data taken along the -Y line at T = 250 K with 30 eV photons at the 4m NIM beam line equipped with an SES 200 Scienta analyzer at the Synchrotron Radiation Center (SRC). The energy resolution was 49 meV FWHM, practically the same as before [3]. This energy resolution is somewhat worse than what was used for other high resolution data published already [4, 5], but gives a better signal to noise ratio without compromising the line shapes. The bands A,B,C,D found in Fig. 1 correspond very well to the 4 bands predicted by band theory [6], consistent with our more detailed band structure analysis [5]. The band D, observed strongly along a different -path [3], is very weak in Fig. 1, and the band C is observed more clearly due to the improved angular resolution [4]. As a result, we can now study crossing line shapes of a single 1D band.
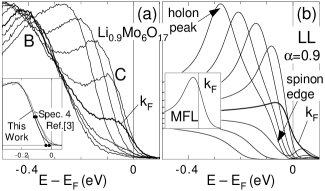
We focus our attention on the line shapes of band C near its crossing in Fig. 2 (a). The band B, while strong in intensity, contributes little weight at energies close to or greater than the peak positions of the band C, according to our test modelling of its line shape. Therefore, the band B distorts only the high binding energy tail region of the band C line shapes. The current data are similar to our lower resolution data [3] in showing the peak and the edge moving at different speeds, a monotonic decrease of the peak height, and intensity retraction from for . However, there are important differences. (1) weight relative to the peak height for is now much larger. (2) As the inset shows, the edge is steeper and in consequence the movement of the zero intensity intercept of the edge, taken as indicative of the spinon velocity, is now only twice, instead of five times, slower than the peak.
As we argued before [4], (1) is a simple consequence of the improved angular resolution. We note that the increased intensity is still much less than that expected for a FL, marginal Fermi liquid (MFL) [8] or a small anomalous dimension () LL, as demonstrated by an MFL simulation with coupling constant = 1 and eV, shown in the inset of Fig. 2 (b). Another reason to reject these ground states is that the peak sharpening expected in their line shapes as is not observed in our data. In fact, the line shape at is very featureless. The line shape is well explained within the LL, as seen in Fig. 2 (b) which shows an LL simulation within a Tomonaga-Luttinger (TL) model [9] with for which , the ratio of the holon velocity to the spinon velocity, is 5. This is the same simulation as that presented by us previously [3] except for using the improved angle resolution of the new data and the unimportant differences of T (for Fermi-Dirac cutoff) and (0.8 eV Å, instead of 0.7 eV Å, describes the peak movement better in this narrow momentum range).
The finding (2) is not explained by our simulation, because the kink between the holon peak and the spinon edge and the slow spinon edge in the simulation are not observed in the data. Nonetheless, the more gap-like line shape produced by the better resolved steeper edge is even more suggestive of the generic LL line shape with its gap around for . Finding (2) implies a value more like 2 instead of the value 5 inferred previously, for which would obtain in the TL model used. However, would imply a spinon peak instead of an edge, and the (, ) weight is strongly dependent on , and so we must take the value to be unchanged. Thus the better resolved spectra show more clearly the essential Non-Fermi liquid character but force us to abandon the - relationship of the model. Because this relationship is known to be highly special to the TL model used and subject to modification due to residual interactions present in other models, the 1D Hubbard model [10] being a pointed example, it is easily given up.
In conclusion, we have reported LL line shapes revealed by new high resolution ARPES data on Li0.9Mo6O17. Currently, Li0.9Mo6O17 remains as the best example to show LL line shapes. We note that the theory of LL line shapes is making a steady progress. For example, a finite T theory [11] is now available. An identification of finite T features in our data set is a work in progress.
The work at U-M was supported by the U.S. NSF under the grant DMR-99-71611) and the U.S. DoE by the grant DE-FG-02-90ER45416. The Ames Lab is supported by the US DOE under Contract No. W-7405-ENG-82 and the SRC is supported by the US NSF Grant No. DMR-00-84402.
References
- [1] D. Orgad, et al., Phys. Rev. Lett. 86 (2001) 4362.
- [2] E. W. Carlson, et al., Phys. Rev. B 62 (2000) 3422.
- [3] J. D. Denlinger, et al., Phys. Rev. Lett. 82 (1999) 2540.
- [4] G.-H. Gweon, et al., Phys. Rev. Lett. 85 (2000) 3985.
- [5] G.-H. Gweon, et al., J. Elec. Spectro. Rel. Phenom. 117-118 (2001) 481.
- [6] M.-H. Whangbo and E. Canadell, J. Am. Chem. Soc. 110 (1988) 358.
- [7] J. Y. Xue, et al., Phys. Rev. Lett. 83 (1999) 1235; K. E. Smith, et al., Phys. Rev. Lett. 85 (2000) 3986.
- [8] C. M. Varma, et al., Phys. Rev. Lett. 63 (1989) 1996.
- [9] V. Meden and K. Schönhammer, Phys. Rev. B 46 (1992) 15753.
- [10] H. J. Schulz, Int. J. Mod. Phys. B 57 (1991) 57.
- [11] D. Orgad, Philos. Mag. B 81 (2001) 377.