.
Phases of Neon, Xenon, and Methane Adsorbed on Nanotube Bundles
Abstract
We explore the behavior of neon, xenon, and methane films adsorbed on the external surface of a bundle of carbon nanotubes. The methods used are classical: a ground state calculation, by grand potential energy minimization, and the grand canonical Monte Carlo (GCMC) method of simulation. Our results are similar to those found recently in a GCMC study of Ar and Kr. At low chemical potential (pressure) the particles form a quasi-one dimensional phase within the groove formed by two contiguous tubes. At higher chemical potential, there occurs a ”three-stripe” phase aligned parallel to the groove (except for xenon). This is followed by monolayer and bilayer phases. The low temperature monolayer phase is striped; the number of stripes per nanotube is a quantized function of the adatom size. In the neon case, the bilayer regime also includes a second layer groove phase. Our results are compared with recent thermal and diffraction experiments. We find no evidence of a zig-zag phase reported recently.
I Introduction
Attention has been drawn in recent years to the problem of adsorption within and outside of carbon nanotubes and bundles of carbon nanotubes (ropes). This interest is directed towards both the possibility of novel one-dimensional (1D) and quasi-1D phases [1], of importance to fundamental research, and to possible applications, such as gas storage, chemical sensing, gas purification and isotope separation [2, 3]. This paper is concerned with the phase transition behavior of gases adsorbed on the outside of a bundle of nanotubes [4]. While one might think of this region as a site for 2D matter (as opposed to 1D), the actual behavior is more varied and interesting. As discussed in a recent study of this problem [5] (henceforth called I), the predicted phases of the adsorbate at low T are a sensitive function of pressure (P) or the related thermodynamic variable, the chemical potential . They range from quasi-1D to 2D to 3D phases as is increased. Recent experiments by Talapatra and Migone [6], Muris et al. [7] have provided some quantitative support for the results of I in the cases of Ar, Xe and CH4.
In I, we studied the adsorption of Ar and Kr atoms within a simplified model, consisting of a planar array of parallel nanotubes, like strands of pasta laid next to one another on a table. That model was intended to represent the outside surface of a perfectly ordered bundle of very large radius (much larger than the radius of the individual tubes). The assumption of a periodic geometry helps to motivate a further approximation, the use of periodic boundary conditions in the grand canonical Monte Carlo method, employed both here and in I. Evidently, these assumptions sacrifice some degree of reality; more accurate predictions would require a specification of the detailed geometry at the surface. Such complete information does not exist, to the best of our knowledge, about any specific bundle of tubes.
This paper extends I by presenting two new calculations. The first is a determination of the equation of state of adsorbed CH4 and Ne at T=0. The second is a set of simulations of Ne and Xe at various temperatures. The resulting phase behavior does not differ qualitatively from that reported in I, except in some respects associated with the varying diameter of the adsorbate.
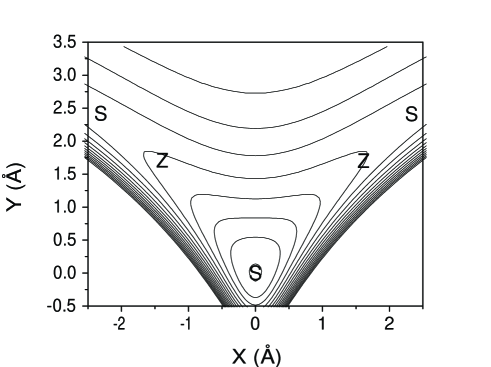
Figure 1 depicts the potential energy V(r) experienced by a CH4 molecule in the vicinity of its equilibrium position above the surface. The x-y plane (shown) is perpendicular to the tubes and the origin is taken to be the position of the potential energy minimum. As in most of our previous studies, including I, V has been computed by summing semiempirical Ne-C interactions. Furthermore, the atomic structure of the tubes is ignored. This assumption eliminates the possibility of commensurate phases, arguably the most significant limitation of our work [8]. In the absence of knowledge about the chirality and relative registry of adjacent tubes, however, it seems prudent to employ this assumption.
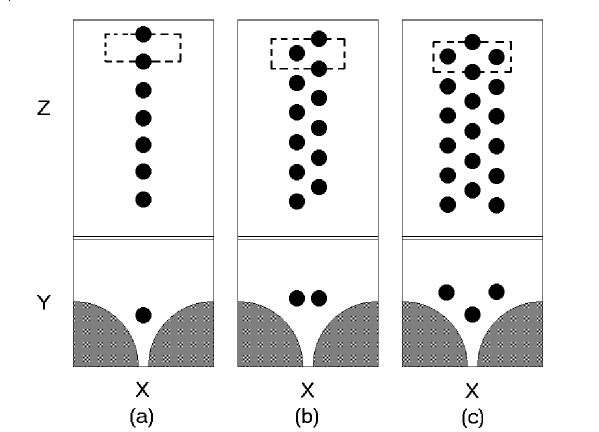
The data in Fig. 1 reveal a very narrow region of strongly attractive potential energy. We refer to this region, oriented parallel to the z axis, as a “groove”. It is not surprising that at low the adsorbate phase is a 1D fluid (or crystal at T=0), in which the molecular motion parallel to the groove is free. In this phase, the density is concentrated very close to the z axis. Fig. 2 depicts two hypothetical phases which might occur at higher values of , after the groove becomes saturated. We refer to these as the “zig-zag” and “3-stripe” phases, respectively. In I, calculations for Ar and Kr yielded evidence of a very small range of chemical potential for which the 3-stripe phase occurs but found no evidence of a zig-zag phase. Recent neutron scattering studies of CD4, however, yielded data which were interpreted as providing evidence of a zig-zag phase [9]. This apparently contradictory situation has provided one motivation for the present study. A second motivation is to extend I to include smaller (Ne) and larger (Xe) atoms in order to discern the effect of size relative to the distance between grooves, measured across the tube’s surface.
In Section 2 of this paper, we describe ground state calculations of the phase behavior of CH4 and Ne. Section 3 presents the results of simulations of Ne and Xe adsorption at finite temperatures. In no case is there found evidence of a stable zig-zag phase.
II Ground State Calculation
We consider three possible submonolayer phases of the adsorbed CH4 gas on the external surface (Fig. 2): A linear phase, a zig-zag phase, and a 3-stripe phase. Our goal in this section is to determine the evolution of structure as a function at . To find out when these phases occur as the number of adsorbed atoms per unit length increases, we minimize the grand potential energy as a function of . is the total energy of the particles
| (1) |
This expression includes the potential energy at the external surface of the bundle plus the mutual interaction energy. is obtained by summing the potential energy contributions of the adjacent nanotubes [10], and is a Lennard-Jones pair potential representing the interaction between molecules. Our tubes are modeled as continuum sheets of carbon, obviating any consideration of commensurate phases. Our neglect of quantum effects is a similar simplification [11], as is the neglect of anisotropy in the gas-carbon and intermolecular potentials [12].
For a given density, the equilibrium configuration is obtained by minimizing the total energy with respect to the position of the particles in the (x,y) plane. At low density, the first term in Eq.(1) is minimized if the molecules reside at the potential energy minimum position (the groove); the ground state corresponds to a 1D spacing = 4.17 Å and a CH4-CH4 interaction energy per particle K. The minimum substrate potential energy for CH4 (-2019 K) is approximately twice the potential energy minimum on a single graphene sheet (-1070 K), the ratio differing from two because of the tube’s curvature. At higher density, a zig-zag phase becomes possible, in principle, in order to minimize the mutual repulsion. Minimizing (1) yields a zig-zag structure with particles at (x,y) values shown in figure 3. These positions lie on the curve provided in figure 4; the points correspond to minima of with respect to for each .
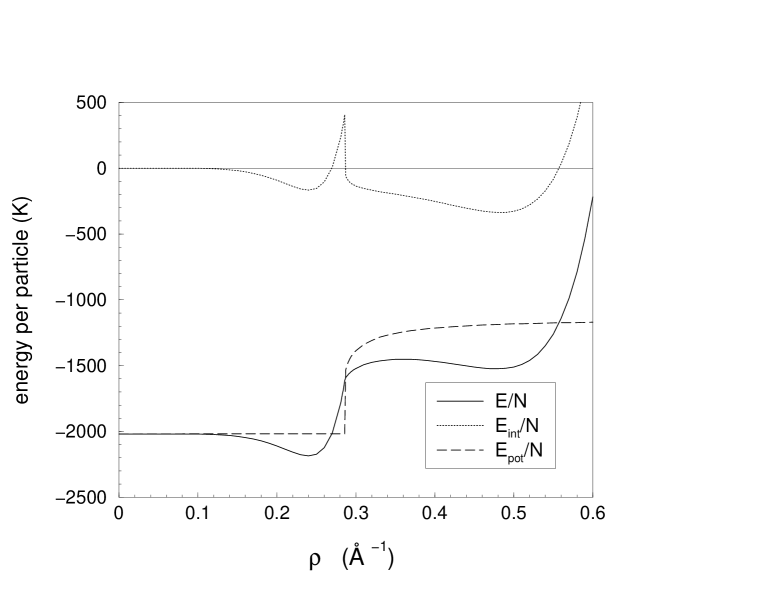
The resulting energies are seen in figures 5 and 6. Note that the mutual interaction in the linear phase is rapidly rising as a function of near Å-1. The hypothetical transition to a zig-zag phase yields a marked reduction in this energy, while increases due to particles’ moving away from the most favored position (0,0). Even though the individual contributions to Eq.(1) change discontinuously at the transition, the total energy is continuous there.
Figure 6 shows the extreme sensitivity of the total energy as a function of the displacement for the zig-zag structure. Note that for Å-1 the most favored structure occurs at (i.e. a linear phase). This energy increases rapidly until Å-1, at which point a transition occurs to the positions (x,y) (0.8 Å, 0.8 Å).
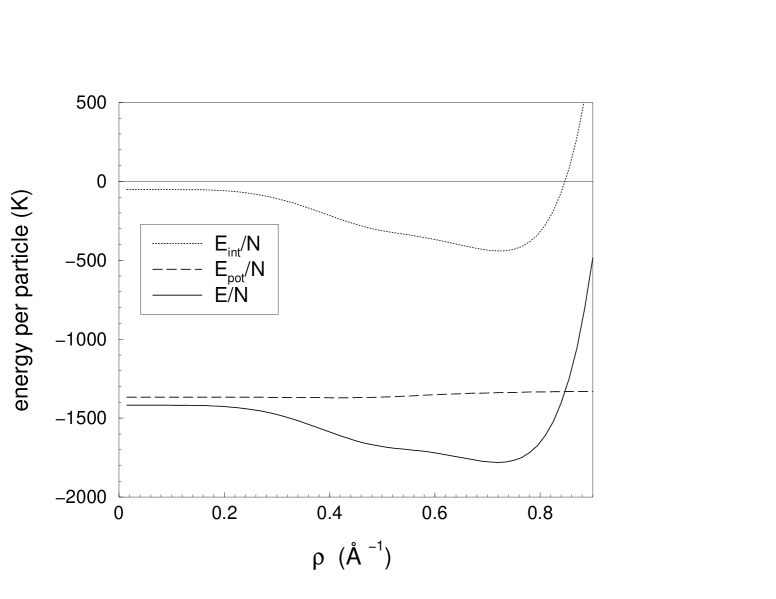
We consider now the other candidate for a submonolayer phase, the 3-stripe phase depicted in figure 2. In contrast to the behavior for the zig-zag transition, the energy and positions of the 3-stripe phase are smooth functions of , as seen in figure 7. In this case, the interaction energy decreases (from a nonzero starting value due to the transverse interaction between the groove molecules and the two outermost lines of particles) while the potential energy per particle remains almost constant; thus the particles self-organize in equilibrium configurations determined mainly by the mutual interaction energy.
In order to determine the ground state energy of the system and the spectrum of transitions between the phases, we minimize the grand potential energy as a function of the density; this is equivalent to a Maxwell construction for . At the transition, the equilibrium conditions are the equality of the chemical potential and the 1D pressure () of the two coexisting phases. Figure 8 presents the resulting adsorption isotherm (T=0). The stable low density phase is linear, with lattice constant between 4.17 Å and 4.00 Å ( to Å-1). When this phase is compressed above 0.25 Å-1, a transition to the 3-stripe phase occurs (which has Å-1). As seen in the figure, the previously discussed transition to the zig-zag phase does not occur because it lies at a much higher chemical potential and grand free energy than the 3-stripe phase.
Analogous calculations for Ne on the external surface of the bundle yield the same qualitative phase behavior. In Table II and III we summarize the results for CH4 and Ne, indicating the interparticle distance between nearest neighbors in each phase. Note that the interparticle distances between the molecules in the unit cell are very similar for every stable configuration. The particles tend to form a close packed structure (1D, 2D and 3D for linear, zig-zag and 3-stripe phases, respectively) driven mainly by just the interparticle interaction because the potential energy per atom remains nearly constant over the density range in which each phase is stable (see Figures 5, 7 and 8). Our finding that the zig-zag phase is not stable appears to disagree with the interpretation of the experimental results of Ref.[9]. This disagreement is discussed in Section IV.
III Monte Carlo calculations
The grand canonical Monte Carlo (GCMC) technique was used to simulate isotherms of Ne and Xe adsorbed on a bundle of nanotubes. As with the ground state study of Section II, a Lennard-Jones potential is used to describe both the atom-atom and the atom-C interactions. A more detailed description of the model and the simulation technique is provided in I. The potential parameters (well depths and diameters) are presented in Table III.
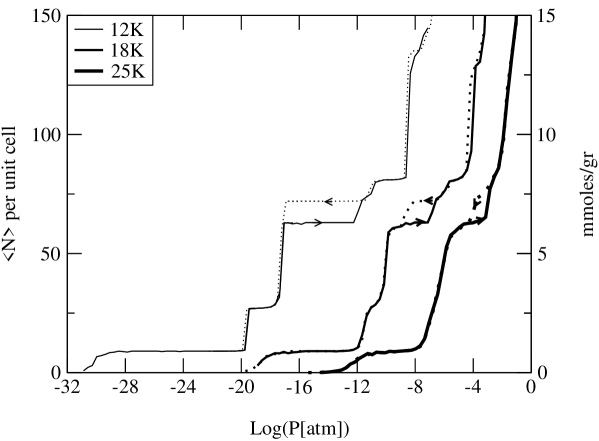
Figure 9 depicts the results of Ne GCMC simulations at three temperatures relevant to typical Ne adsorption experiments, T=12, 18 and 25 K. The left scale in this and subsequent figures is the number of atoms per groove per unit cell, which has a length 10 . To convert this to a commonly reported measure of adsorption (mmoles/g) requires a specification of the number of grooves on the surface of a bundle relative to the mass of the bundle. Following I, we assume the adsorbent to be a hexagonal bundle containing 37 tubes and 18 grooves. In this case, the conversion involves multiplying the left scale by a factor of 0.10 (0.071) mmoles/g for Ne (Xe), the factor varying inversely with . If the geometry were to differ from this, the right scale would require a multiplication by the ratio .
The behavior is similar in some, but not all, respects to that reported in I for gases which have larger diameters (Ar and Kr). At the lowest P, adsorption occurs primarily within the groove formed by the assumed close contact of the tubes. This phase’s behavior is therefore well described by the 1D classical equation of state. After the groove region is filled, there occurs a jump in density by a factor of order three to the 3-stripe phase. Figure 10 shows a top view of the density projected onto the x-y plane. The GCMC data yield no evidence of the hypothetical zig-zag phase. This finding is consistent with both the ground state study of the previous section and the results in I for other gases.
At somewhat higher P, there occurs a second jump to a monolayer film. Note the presence of hysteresis in Figure 9, indicative of two states of similar free energy. One might be called a 7-stripe phase and the other an 8-stripe phase. Such hysteresis was not observed in I. Hysteresis of this kind (often of much larger magnitude) is commonly seen in experiments and simulations involving porous media, arising from capillary condensation. It is rarely seen in thin physisorbed film growth on flat surfaces, except in cases of surface heterogeneity [13].
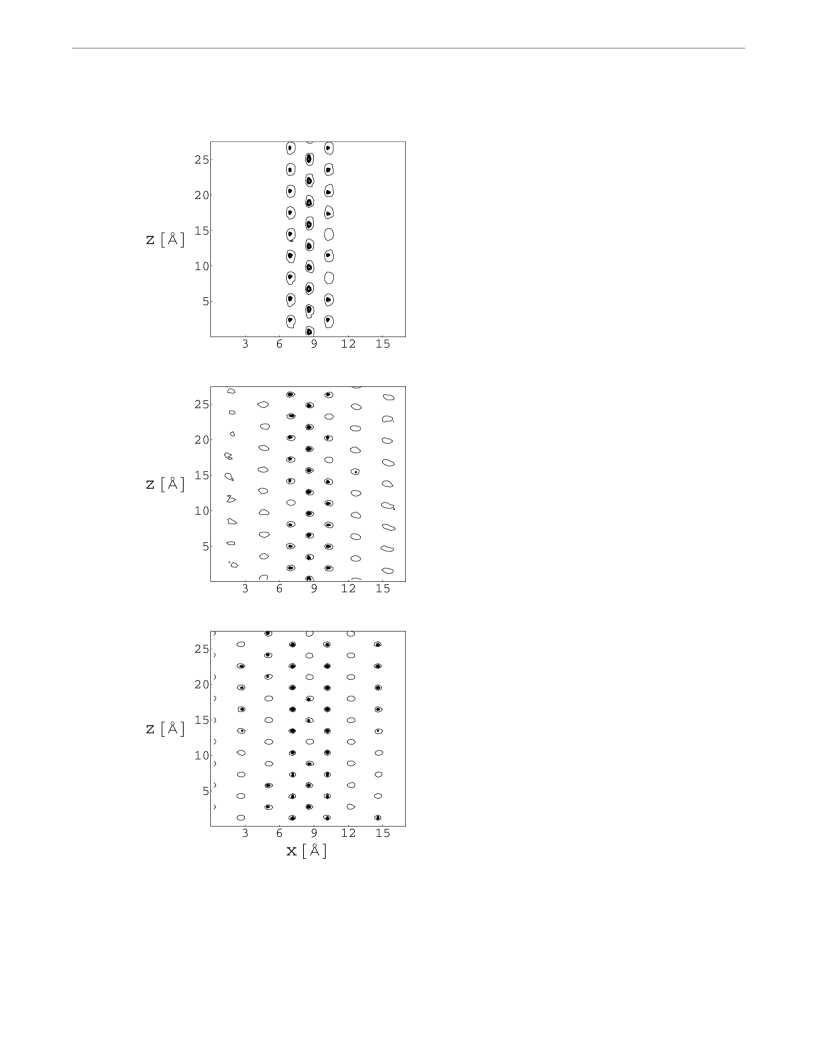
Evidence of the two phases’ stability (or metastability) is their nearly constant coverage over an extended range of chemical potential and temperature, as seen in the isotherms. Figures 10 and 11 present views of these phases’ density configurations in the x-y and x-z planes. Note that the lower density, 7-stripe, phase includes some atoms which are not well defined in position at the low temperature (12 K) of the simulation; these sit at the highest potential energy positions, near the potential energy ridge, at the top of a nanotube. The 8-stripe phase, in contrast, has an extra line of atoms squeezed in there; these last lines to be added involve atoms which are very localized, as are those close to the groove. The 7-stripe phase, whose most weakly bound atoms are very delocalized, has a slightly lower (-659 K vs. -654 K) energy/atom than the higher density phase. However, the equilibrium condition involves the minimum of the grand free energy, which is the product of the coverage and the difference between the Helmholtz free energy/atom F/N and the chemical potential of the system. At very low temperature, the difference between F and E is small; in 2D, it is proportional to times the square of the ratio of the lattice constant to the thermal phonon wavelength [14]. At our lowest temperature, T=12 K, this difference amounts to less than 10 K per atom and is negligible compared to the magnitude of E/N, so we may neglect the difference between F and E in this regime. At T=12 K and P = 10-16 atm, for example, the chemical potential is -530 K. Hence, the grand free energy is equal to the coverage times a negative number, of large magnitude ( K). The 14 % larger coverage of the 8-stripe phase ensures that its grand free energy is lower than that of the (energetically favored) 7-stripe phase. This comparison is consistent with the commonly held belief that the desorption branch of a hysteretic isotherm is the more stable branch. As is commonly seen in simulations and experiment, hysteresis occurs when comparably energetic phases are separated by phase space jumps. Here, the jump involves both a fairly large coverage change and a spatial rearrangement associated with squeezing in the extra line of atoms. It is therefore not surprising to see this phenomenon at this first order transition.
The monolayer coverage in this Ne case (7 or 8-stripe) is consistent with that found in I for both Ar (6 stripe) which has 25 % higher diameter and Xe ( 33 % larger, 5-stripe). At even higher P, for Ne there occurs a 10 % coverage step, observed in Figure 10 to correspond to the appearance of a single line of atoms above the groove. This is interpreted as adsorption of a second linear phase localized within a Ne-coated groove. This second groove phase extends over a much smaller range of chemical potential than does the first groove filling because of the healing out of the deep potential well near the groove, a consequence of the Ne layer’s relatively weak attraction. We note that such a second groove phase is absent from the phase behavior of the larger diameter gases studied in I, as well as that of Xe, discussed below.
This absence is plausible because the monolayer films of such large gases are as thick as their diameters. Second layer adsorption then occurs in the presence of a relatively smooth (laterally) external potential. In the contrasting case of a very small atom, like Ne, the second layer experiences a residual effect of the substrate’s groove attraction, as seen in the potential energy contours of Figure 1. Hence, the second layer groove phase occurs for Ne but not larger gases we have studied.
Finally, the discontinuous feature occurring at the highest P (10-4 atm at 18 K) represents the completion of a bilayer film, manifested as an 80 % jump in coverage close to saturated vapor pressure. Further pressure increase results in wetting film growth, as is expected in the case of the strongly attractive potential provided by the layer of nanotubes.
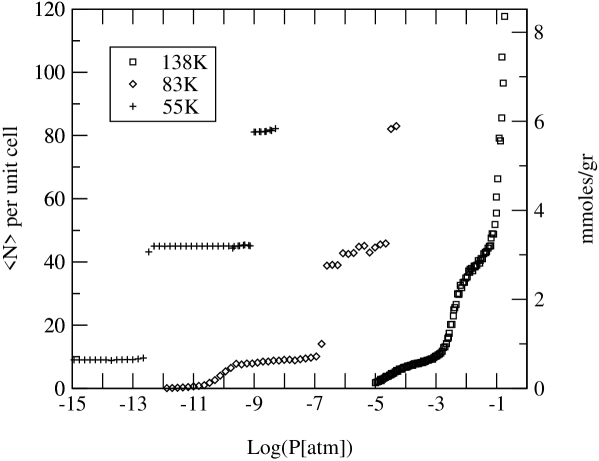
Figure 12 presents results for the simulation of Xe adsorption. The 3-stripe phase is absent, in contrast to the case of the smaller gases. This reflects the relatively large contribution to the energy of the Xe-Xe interaction, on the one hand, and the relatively small variation of the adsorption potential (once the groove is filled) due to the large size of the Xe atoms.
IV Discussion and conclusions
In this study we explored the sequential appearance of phases on the outer surface of a bundle of nanotubes. Ground state calculations for Ne and CH4 found the 1D groove phase to be followed by the 3-stripe phase. The zig-zag phase is not stable relative to either of these at any 1D density. Although we did not simulate methane, we found no evidence of a zig-zag phase for Ne, Ar, Kr (which is very similar to methane) or Xe in any of our simulations. This general finding of no zig-zag phase is in disagreement with the conclusion of Ref.[9], which deduced the presence of a zig-zag phase as part of an interpretation of neutron diffraction data of CD4. The 1D lattice constant reported in the latter study (7.4 Å) is quite inconsistent, incidentally, with that (4 Å) of the metastable zig-zag phase found here, in any case. Indeed, a common feature of all of our results (Table II) is a nearest neighbor spacing near 4 Å, close to that of both 2D and 3D phases of methane. This constancy is somewhat surprising in view of the deep and rapidly varying substrate potential shown in Fig. 1; the computed behavior reflects the stiffness of this quasi-2D lattice. It is difficult to identify the origin of the apparent discrepancy between experiment and theory. The principal sources of our uncertainty are assumptions concerning the form of the interactions and the geometry. We do not see how any plausible change in our model might result in the large change needed for the zig-zag phase to become favored relative to the 3-stripe phase. A study of the effect of substrate disorder on the diffraction seems warranted; it remains our primary hope for a resolution of the 15 % discrepancy between period predicted here for the 3-stripe phase and the period deduced from the very broad diffraction data.
Our simulation studies of Ne between 12, 18 and 25 K are quite consistent with the ground state study of that gas. The 3-stripe phase is present over a more extended range of chemical potential than was found for the larger gases, a consequence of the ability of the Ne to nestle into the groove region in order to lower its potential energy. At somewhat higher chemical potential, other phases appear. The monolayer phase exhibits hysteresis, apparently because there are two energetically similar monolayer densities. At slightly higher density, there appears a second groove phase, in which a line of atoms occupies second layer sites above the groove. This, too, was not seen in I and occurs because of the small size of Ne. At even higher chemical potential, the second layer forms and thick films evolve.
The results for Xe differ from those of the smaller diameter gases. The linear groove phase undergoes a transition to a 5-stripe monolayer phase at low T, followed by a jump to a full bilayer phase. This behavior is a logical concomitant of the larger diameter and relatively stronger adsorbate-adsorbate attraction.
The most logical experiments to propose are thermodynamic and neutron diffraction studies. Indeed, these are already being carried out for methane and the larger gases. Neon, not yet studied experimentally, would be of particular interest because its size makes it a more sensitive probe of the attractive potential. Helium and hydrogen are yet to be studied theoretically; these systems would require quantum calculations, except at high temperatures [11].
Aknowledgments
We are grateful to Victor Bakaev, Michel Bienfait, Renee Diehl, Aldo Migone and Peter Zeppenfeld for discussion and communication of results prior to publication. This research was supported by the Army Research Office, the Petroleum Research Fundation of the American Chemical Society, Fundación Antorchas and CONICET.
REFERENCES
- [1] M.M. Calbi, M.W. Cole, S.M. Gatica, M.J. Bojan, and G. Stan, to be published, cond-mat/0103607.
- [2] M.S. Dresselhaus, Williams K.A., Eklund P.C., MRS Bulletin 24, 45, 1999.
- [3] Q.Y. Wang, S.R. Challa, D.S. Sholl, J.K. Johnson, Phys. Rev. Lett. 82, 956, 1999.
- [4] R.R. Schlittler, J.W. Seo, J.K. Gimzewski, C. Durkan, M.S.M. Saifullah, M.E. Welland, Science 292, 1136, 2001.
- [5] S.M. Gatica, M.J. Bojan, G. Stan, and M.W. Cole, J. Chem. Phys. 114, 3765, 2001.
- [6] S. Talapatra and A.D. Migone; A.J. Zambano, S. Talapatra, and A.D. Migone, to be published. The results of the present study of Xe were made known previously to Talapatra and Migone.
- [7] M. Muris, N. Dupont-Pavlovsky, M. Bienfait, P. Zeppenfeld, to be published.
- [8] Due to the periodic potential associated with the periodic array of tubes, another kind of commensurate phase arises here, manifested as a nonmonotonic dependence of the monolayer film structure on the adsorbate diameter, i.e. whether an integral number of stripes fit in one period.
- [9] P. Zeppenfeld, M. Muris, M. Bienfait, N. Dupont-Pavlovsky, and M. Johnson, to be published.
- [10] G. Stan and M.W. Cole, Surf. Sci. 395, 280, 1998.
- [11] Q.Y. Wang and J.K. Johnson, Fluid Phase Equilibria 132, 93, 1997.
- [12] G.C. Maitland, M. Rigby, E.B. Smith, and W.A. Wakeham, Intermolecular Forces: Their Origin and Determination (Clarendon Press, Oxford, 1987), pp. 508; R. Righini, K.Maki and M.L. Klein, Chem. Phys. Lett. 80, 301, 1981; W.E. Carlos and M.W. Cole, Surf. Sci. 91, 339, 1980.
- [13] L.E. Cascarini de Torre and E.J. Bottani, Langmuir 13, 3499, 1997.
- [14] L.W. Bruch, Milton W. Cole and Eugene Zaremba, Physical Adsorption: Forces and Phenomena (Clarendon Press, Oxford, 1997).
| Phase | lattice constant (Å) | (Å) | (Å) | (Å) | (Å) |
| linear | (4.17-4.00) | (4.17-4.00) | 0 | 0 | (4.17-4.00) |
| zig-zag | 4.024 | 2.012 | 3.54 | 0 | 4.072 |
| 3-stripe | 4.08 | 2.04 | 2.504 | 2.469 | 4.065 |
| (Å) | (Å) | (Å) | (Å) | |
| linear | (3.08-2.92) | 0 | 0 | (3.08-2.92) |
| zig-zag | 1.47 | 2.58 | 0 | 2.97 |
| 3-stripe | 1.5 | 1.63 | 1.99 | 2.98 |
| Gas | (Å) | (K) | (Å) | (K) |
| CH4 | 3.72 | 161.35 | 3.56 | 67.2 |
| Ne | 2.75 | 35.6 | 3.075 | 31.6 |
| Xe | 4.1 | 221 | 3.75 | 78.7 |