[
Manifestation of multiband optical properties of MgB2
Abstract
The optical conductivity of MgB2 has been determined on a dense polycrystalline sample in the spectral range 6 meV - 4.6 eV using a combination of ellipsometric and normal incidence reflectivity measurements. features a narrow Drude peak with anomalously small plasma frequency (1.4 eV) and a very broad ”dome” structure, which comprises the bulk of the low-energy spectral weight. This fact can be reconciled with the results of band structure calculations by assuming that charge carriers from the 2D -bands and the 3D -bands have principally different impurity scattering rates and negligible interband scattering. This also explains a surprisingly small correlation between the defect concentration and , expected for a two-gap superconductor. The large 3D carrier scattering rate suggests their proximity to the localization limit.
pacs:
PACS numbers: 74.70.Ad, 78.20.Ci, 78.30.-j]
The recently discovered copperless superconductor MgB2[1] has attracted substantial attention. Most researchers agree that MgB2 is a conventional -metal, where a combination of strong bonding and sizable density of states produces a high critical temperature within the standard theory [2, 3, 4]. There is an agreement among theorists that there are two qualitatively different systems of bands in MgB2: quasi-2D -bands, and 3D -bands, and that the former strongly couple to optical E2g phonon at 600 cm-1. There is also experimental [6] and theoretical[5] evidence of two different superconducting gaps in this compound.
Optical spectroscopy is a direct probe of the electronic structure, and it has not been supportive of the conventional picture so far: the reported plasma frequency [7, 8] is 1.5 eV, in utter disagreement with LDA calculations of 7 eV [2, 4, 5]. It is tempting to ascribe this to correlation effects, so that the missing spectral weight is shifted to some incoherent excitations. However, there is no reason to expect strong correlations in MgB2, which does not have any d- or f- elements, and is in no proximity to magnetism. Furthermore, recent angle-resolved photoemission data on a single crystal [9] have found a remarkable correspondence of the observed bands to LDA calculations, implying that there is virtually no renormalization of Fermi velocity in this system, as opposed, for instance, to high-Tc cuprates. Different values for the carrier scattering rate at have been reported from transmission spectroscopy on thin films: 150 cm-1 (18.6 meV)[10], 300 cm-1 (37.2 meV) [7] and 700 cm-1 (86.8 meV) [11]. Lacking large single crystals, a study of polycrystalline samples is justified as a first step to understand optical properties of this material. In this Communication we report the optical conductivity of MgB2 obtained from a dense polycrystalline sample from ellipsometry and normal-incidence reflectivity in a range from 6 meV to 4.5 eV, which comprises both intraband and low-energy interband excitations. We also report theoretical calculation of the same quantity, including the electron-phonon interaction (EPI) and the polycrystalline nature of the sample. We suggest that the intraband conductivity consists of two qualitatively different components: a narrow Drude peak (DP) due to the -bands, and an overdamped DP due to the -band electrons. The latter scatter so strongly in our sample that one may expect deviations from the Drude shape due to localization effects, and indeed we find that the feature in question deviates from the Drude formula. This model explains naturally a yet unresolved paradox of the two-band scenario [5, 12]: the absence of a pair-breaking by paramagnetic impurities, predicted for two-gap superconductors [13]. In this Communication we concentrate on the broad-range optical properties keeping the FIR study of the superconducting gap for a separate publication.
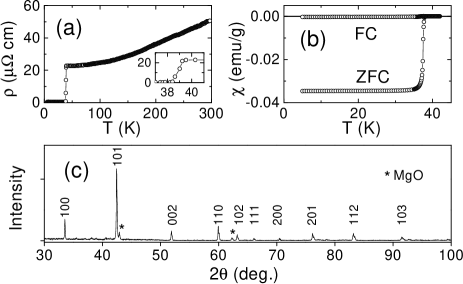
The sample was synthesized from high-purity powdered Mg and B, as described elsewhere [1], and then treated in a high-pressure BN cell at 1623 K and 5.5 GPa for 30 minutes and finally quenched to room temperature. A very dense metallic-like sample was obtained. The is about 39 K with transition width of less than 1 K both from the DC resistivity and the magnetic susceptibility (Fig.1 (a, b)). The estimated superconducting volume fraction is about 60 %. The X-ray diffractometry (Fig.1(c)) revealed presence of impurity phases which is difficult to avoid in a bulk polycrystalline sample. One can estimate that the sample contains some 5 - 7 % of MgO and about 1 % of other phases. The R(300K)/R(50K) ratio is 2.2.
The sample was cut and dry-polished with a 0.1 m diamond micropolisher. The surface was black and shiny with an area of about 8 mm2. Because of ellipsometrically detected changes of the optical properties in air, probably due to surface oxidation, the sample was inserted into the cryostat within minutes after polishing to make sure that the near-surface region corresponds to the bulk properties. Normal-incidence reflectivity measurements in polarized light did not reveal any optical anisotropy implying no preferential grain orientation.
We combined ellipsometry and reflection spectroscopy to determine the optical constants for 15 K 300 K. The dielectric function was measured directly using a commercial optical ellipsometer with a UHV cryostat in the range 6000 - 37000 cm-1 (0.45 - 4.6 eV) at the angle of incidence = 80∘. The measurements at = 60∘ gave almost the same dielectric function, which is also an indication of isotropic properties of our sample. The normal incidence reflectivity spectra were measured from 20 to 6000 cm-1 (2.5 meV - 0.45 eV) utilizing Bruker 113v FT-IR spectrometer, equipped with a home-design ultra-stable optical cryostat. Absolute reflectivities for each temperature were calibrated with the aid of a gold film, deposited in situ on the sample. In this range the complex reflectivity phase was obtained with Kramers-Kronig (KK) transformation, allowing us to calculate and . The phase spectrum was anchored using ellipsometric data at higher frequencies (see Ref.[14]).
An important issue is the effect of impurity phases on the optical spectra. The main impurity component is MgO, which has almost zero optical conductivity in the studied frequency range except for a few sharp phonon peaks in the FIR range. Using the Maxwell-Garnett theory of the two-component media [15] one can show that the role of impurity in this case is to reduce the observed conductivity uniformly by 7 - 10 % compared to the impurity-free sample. As impurity concentration is not precisely known, we do not correct the conductivity for this effect, but keep it in mind in the discussion.
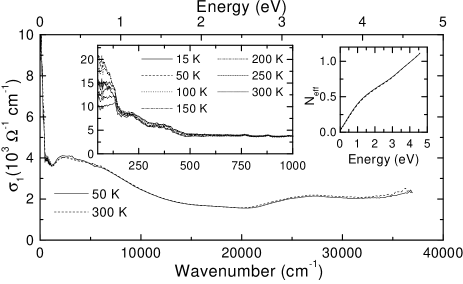
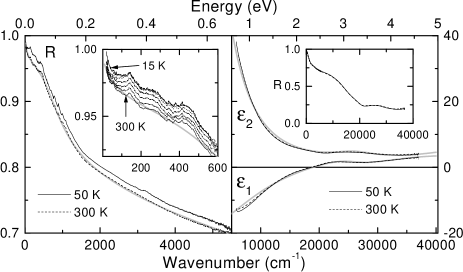
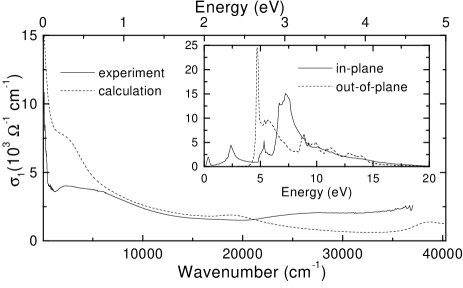
The experimental spectra are shown in Fig.2. At high energies the spectra demonstrate very little dependence. In the IR range the reflectivity steadily increases with cooling down. An additional small superconductivity-related increase of is observed below for 12 meV, in agreement with earlier data [16]. The main low-frequency features of the optical conductivity (Fig.3) are a narrow DP with a small spectral weight, and a broad ”dome” structure extending up to 1 - 1.5 eV. There is a minimum at 0.15 eV and a broad maximum at 0.3 eV. The structure itself looks like a strongly damped second DP. Another broad peak is centered at about 3.3 - 3.4 eV. One can note some phonon-like structures in the FIR reflectivity and, correspondingly, conductivity curves. Those structures are not reproducible from sample to sample, therefore we relate most of them to impurity phases [17].
The standard procedure of quantifying optical spectra is the Drude-Lorentz data fitting: , where and are the plasma frequency and the scattering rate for the DP, and , and are the frequency, the ”plasma” frequency, and the scattering rate of the -th Lorentz oscillator (LO), is the high-frequency dielectric constant. We fitted simultaneously at low frequencies and both and at high frequencies (see Fig. 2) with one set of parameters listed in the Table for 300 K.
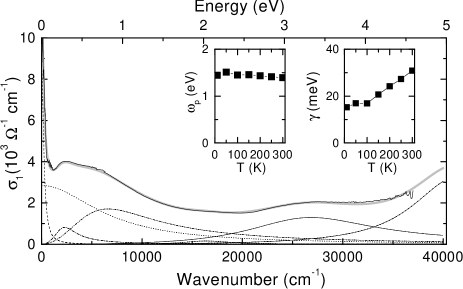
A good fit can be obtained by introducing two DPs with very different properties (Fig.4). The narrow DP has an almost temperature-independent plasma frequency 1.4 eV; the temperature dependence of the scattering rate (see inset in Fig.4) scales well with the curve (Fig.1(a)). The second DP is anomalously broad ( 1.1 - 1.2 eV). Although its plasma frequency ( 4.9 eV) is much larger than that of the narrow peak, the latter determines the major part of the static conductivity. The ”dome” structure can be fitted with a combination of a broad DP and two LO at 0.3 and 0.8 eV. Finally, there is another broad peak centered at 3.4 eV and a peak at 5.1 eV.
Let us now compare the data with the first-principles calculations [5, 2]. To account for the polycrystalline sample texture we averaged the in-plane and out-of-plane contributions to the optical conductivity using the effective medium approximation (EMA) [15] assuming spherical randomly oriented grains. This approach is more accurate at low frequencies, where the wavelength is larger than the typical grain size (in our case of the order of 1-5 m). For the limit the reflectivity should be averaged directly rather than conductivity. For highly anisotropic compounds, e.g. cuprates, it was shown that some artificial structures may show up due to reflectivity-averaging effect [18]. Although we take such a possibility very seriously, the fact that the complex dielectric functions obtained by ellipsometry measurements at incidence angles 60∘ and 80∘ match very well is an argument that the concept of effective medium conductivity works sufficiently well even in the high-energy part of our measured spectral range.
The interband optical conductivity (Fig.5) was calculated by the WIEN97 LAPW code [19] using the band structure of Ref.[2]. The experimental peak at 0.3 eV clearly corresponds to the in-plane interband transition between the two -bands at 0.35 eV. The broad 3.4 eV peak finds no counterpart in the theory: the closest peak (2.4 eV, in-plane polarization) stems from the van Hove singularity at the M point. The reason for this discrepancy is not clear at the moment, although it might be related to the disorder effects discussed below. The increase of the conductivity above 4 eV, which is simulated by the LO at 5.1 eV, one can probably associate with the intensive out-of-plane maximum at 4.7 eV due to charge excitations between the B and Mg planes [20].
The intraband conductivity is particularly interesting. The calculated in-plane (out-of-plane) plasma frequencies of the 2D -band are 4.1 (0.7) eV, which in the EMA gives 3.0 eV for the effective plasma frequency of the -band. Similarly, for the -band, we obtain = 6.2 eV. The total plasma frequency is thus expected to be about 6.9 eV.
The observed of the narrow Drude peak alone (1.4 eV), in agreement with Refs. [7, 8], is much smaller than the calculated total . It can account for only a small part of the expected total spectral weight. However, about 80% of the missing spectral weight can be found in the features forming the broad ”dome” structure. We suggest therefore that the narrow DP is due to the 2D -band carriers, while the broad ”dome” is mainly formed by the intraband excitations within the 3D -band with some contribution from the low-energy interband transitions between -bands. The two orders of magnitude difference in the elastic scattering rates for the - and -bands can be explained by the principally different nature of the two band systems. The -bands have hardly any weight on Mg, while the -bands hybridize with Mg orbitals. On the other hand, the strong covalent bonding in the B planes makes any defect in this plane energetically very unfavorable, while the loosely bound Mg planes should be prone to all kinds of defects. This implies that electrons in the -bands may experience much less defect scattering than those in the -bands.
Even this model cannot fully explain the small plasma frequency (1.4 eV) of the narrow DP, since the calculated -band effective plasma frequency is 3 eV. However, an important piece of physics is the mass renormalization due to strong EPI. This effect is negligible if , which is usually the case in metal optics. In MgB2, however, the EPI is believed to come mainly from the E2g phonon with cm larger than the -band scattering rate. In this case, the mass renormalization still does not change the DC resistivity, but the peak gets narrower, and fitting by the standard Drude formula produces an , which is, compared to the bare plasma frequency, reduced by a factor , where is the EPI constant [21]. The remaining spectral weight is transferred to higher energies, . The calculated coupling constants[5] for different bands are: = 1.2 and = 0.45. This renormalizes the plasma frequency of the -band DP to eV.
Given such a large scattering rate, is the Drude model applicable at all to the -bands? The calculated Fermi velocity is about 4.9 107 cm/s [2] so that the =1.1 eV =2.7 1014 s-1, results in a mean free path = 18 Å, comparable with the lattice constant. This signals approaching weak localization of charge carriers by defects, as opposed to Boltzmann transport. The grain boundaries might introduce additional scattering, however, such a short mean free path is difficult to explain by the grain effects only. Localization effects should lead to deviations from the pure Drude formula: an additional suppression of conductivity at and a characteristic maximum on curve at frequencies of the order of the inelastic scattering rate. This might explain the broad peak at 0.8 eV, which has almost the same as the broad DP, and comparable spectral weight (see the Table). The combination of these two terms might mimic the deformation of the conventional DP due to localization effects.
Fig.5 shows the effective conductivity (including both interband and intraband components), obtained from first-principle calculations. We calculated the intraband absorption separately for the and bands, and included the frequency-dependent mass renormalizations and scattering rates due to EPI, as described in Ref.[21]. The EPI Eliashberg function was taken in the Einstein form: . The values for the = 0 scattering rates were taken from the experiment: = 15 meV, = 1.1 eV.
There is a qualitative agreement between the first-principles calculations and the experiment, despite a 50 % difference in plasma frequencies. However, without the two-band scenario the discrepancy would be an order of magnitude bigger. The remaining error may be due to one or more of the following: above mentioned 7 - 10 % scaling of the conductivity due to finite impurity concentration; surface quality issues; grain boundary and localization effects; possible underestimation of in the calculations because of nonlinear EPI.
Let us now make a link to superconductivity. Various experiments indicate that MgB2 cannot be described by the standard BCS theory[6]. The popular two-gap theory [12, 5] seems to be able to explain the majority of the experiments. However, it is known [13] that in this case the interband impurity scattering must rapidly suppress by isotropization of the order parameter. Such a suppression has not been observed[6], which can be interpreted as a serious argument against the two-gap model. Our two-Drude picture of the low-energy optical conductivity helps to resolve this paradox. Indeed, the existence of two distinguishable Drude peaks would only be possible provided that the charge scattering is small. In this case impurity scattering, albeit reducing the DC conductivity, does not isotropize the gap, therefore the Anderson theorem holds and no pairbreaking occurs [13].
It is worth noting that one cannot, based just on the fit quality, choose between our “two-DP” model and a DL fit with the second DP replaced by a broad low-energy ( 0.25 eV) LO. Although the latter interpretation is consistent with the data, we favor the two DP model for the following reasons: (i) the plasma frequency, unlike some other electronic properties, is known to be reproducible by LDA calculations within errors hardly ever larger than 100 %, as opposed to a factor of five discrepancy we would have for MgB2. (ii) With one DP the total is less than 2 eV; in this case the application of the standard high- limit of the Bloch-Grüneisen formula, would give the EPI transport constant [8], an unphysically small value for an covalent-ionic metal with a sizeable density of states. Finally, (iii) the two-DP model resolves naturally the main problem of the two-gap superconductivity model, supported by a variety of experiments.
In summary, the optical conductivity of MgB2 in a wide frequency range was obtained using a combination of ellipsometry and normal incidence reflectometry methods. The drastic suppression of the low-energy spectral weight finds a natural explanation in the multiband model: a narrow Drude peak corresponds to the 2D -bands (additionally renormalized by the EPI), while the intraband absorption of the 3D -bands is spread over a large frequency range up to 1 - 1.5 eV. Optical measurements on high-quality single crystals of MgB2 are necessary to get more reliable data on the optical conductivity and its anisotropy.
This investigation was supported by the Netherlands Foundation for Fundamental Research on Matter (FOM) with financial aid from the Nederlandse Organisatie voor Wetenschappelijk Onderzoek (NWO). We thank R. K. Kremer for performing the succeptibility measurements.
REFERENCES
- [1] J. Nagamatsu et al, Nature, 410, 63 (2001).
- [2] J. Kortus et al, Phys. Rev. Lett. 86, 4656 (2001).
- [3] J. M. An, and W. E. Pickett, Phys. Rev. Lett. 86, 4366 (2001).
- [4] Y. Kong et al, Phys. Rev. B 64, 20501 (2001).
- [5] A. Y. Liu, I. I. Mazin, and J. Kortus, Phys. Rev. Lett. 87, 087005 (2001).
- [6] C. Buzea and T. Yamashita, cond-mat/0108265 (2001).
- [7] R. A. Kaindl, cond-mat/0106342.
- [8] J. J. Tu et al., cond-mat/0107349.
- [9] H. Uchiyama et al., cond-mat/0111152.
- [10] A. V. Pronin et al, Phys. Rev. Lett. 87, 097003 (2001).
- [11] J. H. Jung et al, cond-mat/0105180.
- [12] S. V. Shulga et al, cond-mat/0103154.
- [13] A. A. Golubov and I. I. Mazin, Phys. Rev. B55, 15146 (1997).
- [14] J. W. van der Eb, A. B. Kuz’menko, and D. van der Marel, Phys. Rev. Lett. 86, 3407 (2001).
- [15] D. Stroud, Phys. Rev. B 12, 3368 (1975).
- [16] B. Gorshunov et al, Euro. J. Phys. B. 21, 159 (2001).
- [17] The measured extrapolated to zero frequency is about twice smaller than that from direct DC measurements. It can be explained by the well-known uncertainty of the KK method at very low frequencies, where reflectivity approaches unity. For instance, shifting our spectra by 1% up, which reflects a typical systematic error of this kind of measurement, would make the static limit agree well to the DC conductivity, with only minor changes at high frequencies.
- [18] I.I. Mazin et al, JETP Letters 47, 113 (1988); J.Orenstein, and D.H.Rapkine, Phys. Rev. Lett. 60, 968 (1988).
- [19] OPTIC codes (part of the WIEN97 package) by R. Abt and C. Ambrosch-Draxl.
- [20] W. Ku et al., cond-mat/0105389.
- [21] O. V. Dolgov, and S. V. Shulga, J. of Supercond. 8, 611 (1995).
| No. | No. | ||||||
|---|---|---|---|---|---|---|---|
| 1 | - | 1.39 | 0.03 | 4 | 0.79 | 3.35 | 1.21 |
| 2 | - | 4.94 | 1.16 | 5 | 3.40 | 4.85 | 2.40 |
| 3 | 0.29 | 1.46 | 0.34 | 6 | 5.23 | 5.80 | 1.23 |