[
Nature of the Electronic Excitations near the Brillouin Zone Boundary of Bi2Sr2CaCu2O8+δ
Abstract
Based on angle resolved photoemission spectra measured on different systems at different dopings, momenta and photon energies, we show that the anomalously large spectral linewidth in the region of optimal doped and underdoped Bi2Sr2CaCu2O8+δ has significant contributions from the bilayer splitting, and that the scattering rate in this region is considerably smaller than previously estimated. This new picture of the electronic excitation near puts additional experimental constraints on various microscopic theories and data analysis.
pacs:
PACS numbers: 71.18.+y, 74.72.Hs, 79.60.Bm]
Angle resolved photoemission spectroscopy (ARPES) data from the region of Bi2Sr2CaCu2O8+δ (Bi2212) have been one of the most important sources of information about the electronic structure of the high temperature superconductors (HTSC)[1]. The normal state spectra are very broad, with widths much larger than those from the nodal region (near ), indicating a large anisotropy in the scattering rate along the Fermi surface[2, 3]. This anisotropy has been considered in various theories that describe the anomalous transport and optical properties in the cuprates[4]. In addition, the information gathered from these spectra have helped to put additional important parameters into microscopic models[5]. On the other hand, the superconducting state spectra contains the well known peak-dip-hump structure[6]. The position of the dip was suggested to be related to the neutron resonance mode[7], resulting in modelling of the tunnelling and ARPES data [8]. The peak intensity in the peak-dip-hump structure has been interpreted as being related to the condensate fraction[9], as discussed by various theories[10, 11]. These studies constitute a significant part of the HTSC literature.
Bi2212 has two coupled CuO2 planes in the unit cell and therefore bilayer splitting is naturally expected. However, it has been largely ignored in the studies mentioned above, partly because of earlier reports of its absence in the ARPES spectra[12, 13]. Recently, this long-sought bilayer splitting was finally observed in overdoped Bi2212[14, 15, 16]. The two originally degenerate bands (one for each CuO2 layer) are split into bonding and antibonding bands due to the intra-bilayer coupling. In the region, the amplitude of the bilayer splitting is found to be about 100 meV, comparable to the size of the superconducting gap and the normal state band dispersion. As a result, the bilayer splitting causes a peak-dip-hump structure even in the normal state of heavily overdoped Bi2212[14, 17, 18], demonstrating that the intra-bilayer coupling plays an important role in the electronic structure of the overdoped regime and should be seriously considered in relevant theories. These results naturally raise the question of whether bilayer splitting exists in the optimal and under-doped regimes where most experiments and analyses were conducted, and if it does, how it affects our understanding of the nature of the electronic excitations near .
In this letter, we report ARPES spectra from Bi2212 and Bi2Sr2CuO6+δ (Bi2201) for various dopings and photon energies (). The lineshapes of Bi2201 and Bi2212 are similar in the nodal region, but very different near . In addition, Bi2212 spectra from the region are strongly modified by , in contrast to the weak photon energy dependence of the Bi2201 spectra. We show that these results can be well explained by the underlying bilayer splitting effects in under and optimally doped Bi2212 and that the broad linewidth near is, in large part, due to the bilayer splitting. These results are very different from the current, commonly-accepted picture of the electronic excitations near , and therefore requires the reexamination of many existing theories, and puts strong constraints on future theoretical models and data analysis.
High quality Bi2212 and Bi2201 single crystals were grown by the floating zone technique. Bi2212 samples are labeled by the superconducting phase transition temperature of the sample with the prefix UD for underdoped, OP for optimally doped, and OD for overdoped. Bi2201 samples are labeled in the same way but in lowercase. For example, UD83 represents a =83 K underdoped Bi2212 sample, while od17 represents a =17 K overdoped Bi2201 sample. Samples with Pb doping are labeled with the prefix “Pb”, except od33, which is doped with both Pb and La. The superconducting transition widths, , were less than K for all the samples used. Angle resolved photoemission experiments were performed at a normal incidence monochromator (NIM) beamline of the Stanford Synchrotron Radiation Laboratory, where the intensity of the second order light is extremely weak. Data were taken with a Scienta SES200 electron analyzer with the angular resolution of degrees unless specified otherwise. The overall energy resolution varied from 10 meV to 18 meV at different ’s. This variation of the energy resolution does not affect any of our conclusions since the energy scales of the discussed features are much larger. The chamber pressure was better than , and sample aging effects were negligible during the measurements. Unless otherwise specified, normal state data were taken 1020K above .
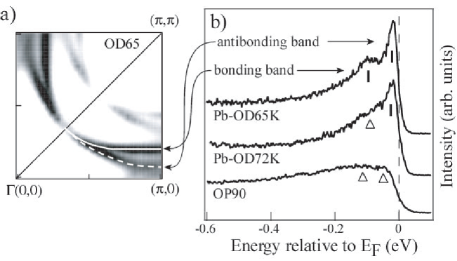
The most obvious signature of the bilayer splitting is double features in the Fermi surface and energy distribution curves (EDC), as shown in Fig. 1 for heavily overdoped Bi2212 [14]. Due to the anisotropic nature of the intrabilayer coupling, the amplitude of the bilayer splitting is also anisotropic with zero splitting in the nodal region and maximum splitting at [Fig. 1(a)]. The normal state EDC of heavily overdoped Pb-OD65 [Fig. 1(b)] clearly shows two features that exhibit a normal state peak-dip-hump structure, and are assigned to the two bilayer split bands[14, 15, 16]. This was not observed in previous measurements on overdoped samples, mainly due to extrinsic factors such as energy and angular resolution. With a slight decrease of the doping (Pb-OD72), the two components of the spectrum are barely distinguishable. Compared with Pb-OD65, the two features become broader and their intensities smaller. For OP90, the spectrum is intrinsically too broad to distinguish the two split features, which makes the identification of the bilayer splitting very difficult in this manner.
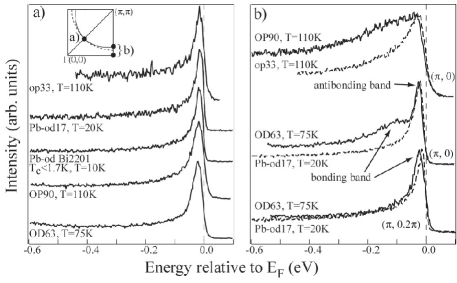
To clarify this further, we looked for other signs of bilayer splitting by comparing the spectra of Bi2212 with those of single layer Bi2201 at similar doping levels. We chose two pairs of samples: OP90 and op33, and OD63 and od17. Based on the empirical vs. doping formula[19], they have doping levels of 0.16, 0.16, 0.22, and 0.24, respectively. For the spectra taken in the nodal region shown in Fig. 2a, Bi2201 and Bi2212 have similar lineshapes, and the linewidth varies only slightly for different systems and experimental conditions. This holds true even for the heavily overdoped Bi2201 sample with a (doping level 0.28). The situation is very different for the spectra taken in the region (Fig. 2b). For OD63, the spectrum consists of both the bonding and antibonding bands, while the spectrum at mostly consists of the bonding band, because the antibonding band is above [14]. We find that the Bi2212 and Bi2201 spectra match at almost perfectly, while those at at do not because of the presence of the bonding band at higher energies. As far as the near- features are concerned, the spectra from both od17 and OD63 have very similar linewidths at similar binding energies and momenta. This similarity between the OD63/od17 low energy spectra can be attributed to their similar doping levels in each CuO2 plane. The OP90/op33 spectra show a large mismatch similar to the OD63/od17 case, which can be naturally attributed to the additional spectral weight from the bonding band of OP90. On the other hand, without bilayer splitting (or intra-bilayer coupling) in OP90, properties of the CuO2 planes of OP90 and op33 should be similar. It is then difficult to explain why the linewidths of OP90 and op33 are so dramatically different in the region, considering that Bi2201 and Bi2212 are very similar in many other aspects such as the phase diagram, Fermi surface shapes, dispersion energy scales[20, 21], and particularly, residual resistivity, which indicates the scattering caused by defects and impurities. The larger linewidth of op33, compared to od17, may be attributed to enhanced correlation effects with decreased doping, presumably scattering due to increased antiferromagnetic fluctuations[2, 4]. We note that these normal state spectra were taken at different temperatures. However, the thermal broadening is negligible compared to the peak widths, within the experimental temperature range.
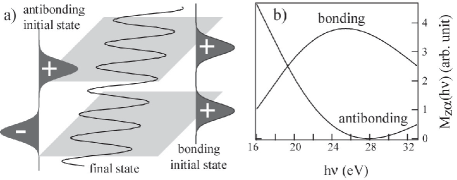
The above comparison between spectra from Bi2201 and Bi2212 suggests the possible presence of bilayer splitting in optimally doped samples. This is further supported by photon energy dependence studies. As depicted in Fig. 3(a), the antibonding and bonding states have opposite symmetry along the c-axis with respect to the midpoint between the two planes. As a consequence, their photoemission matrix elements respond differently to various experimental parameters, including the photon energy. Upon tuning , the spectral weight from the bonding and antibonding states will vary differently, thus changing the overall spectral lineshapes. This can be further illustrated by an analysis of the photoemission matrix elements. Although comprehensive calculations of the photoemission matrix element are still not feasible because of the complexity in the crystal structure and the photoemission process, as well as the electron-electron correlations, with reasonable assumptions and simplifications one can still study its behaviors on a qualitative level, which turns out to be very helpful for the interpretation of the data on various occasions[22].
We consider two 2D systems coupled via a certain bilayer interaction. The photoemission intensity for such a system with non-interacting electrons is where , and are the momentum, energy for the final state, and the spectral function respectively, while and represent antibonding and bonding bands. In the one-electron matrix element , and are the final state and initial state single electron wave functions, A is the vector potential of the photon field, and . Assuming and a free electron final state , the matrix element can be separated into the in-plane contribution and the out-of-plane contribution . Under the dipole approximation,
| (1) | |||||
| (2) |
where and are fixed to be for both the initial and final states. The first term contributes equally to both bonding and antibonding states, and the ratio of polarization, , is approximately constant in the experiment. Therefore, we can focus on as a function of . To further simplify, we assume
where “-” and “+” signs are for and , respectively. is the intrabilayer distance, and is an adjustable parameter reflecting how the electron wavefunction is localized within a layer and is assumed to be in the calculation. For the final state, the free electron approximation gives , where we choose the photoelectron effective mass to be the free electron mass, the work function , and inner potential in the calculation[23]. calculated with these parameters and simplifications is shown for both antibonding and bonding states in Fig. 3(b). The ’s for the bonding and antibonding state have almost opposite behaviors with , and changes quite dramatically in the studied range. This causes the overall lineshape of the Bi2212 spectrum to alter significantly with as the relative weight of bonding/antibonding states oscillates. In the case of optimally doped and underdoped systems, the centroid of the broad feature will shift.
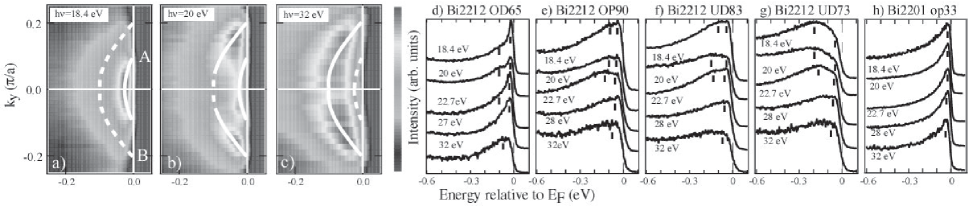
This is indeed observed in OD65, where the bilayer splitting has been clearly identified[14]. Fig. 4(a-c) show ARPES intensity taken in the region at different ’s as a function of momentum and binding energy. Because the NIM gives extremely weak second-order light, it is possible to directly compare spectra taken at different ’s. One can see that the relative intensities of the antibonding band (A) and bonding band (B) change with . At some photon energies, only one feature is prominent, while in others, both features are clearly visible. EDC’s of OD65 at are plotted in Fig. 4(d)[24]. While some dispersion may exist, the data show strong bilayer matrix element effects. One clearly sees that the relative intensities of the bonding and antibonding features vary drastically with . For optimally doped [Fig. 4(e)] and underdoped Bi2212 [Fig. 4(f-g)], one does not see two clearly separated features. However, one can see the strong variation of the lineshape, and changes in the centroid of the feature. Although there are some detailed variations from sample to sample, the spectra of underdoped and optimally doped Bi2212 change with a similar trend as the OD65. On the other hand, for the optimally doped single layer system Bi2201 [Fig. 4(h)], the peak position and the overall lineshape show virtually no photon energy dependence. The high binding energy background of op33 is a smooth function of binding energy and photon energy. These indicate that the strong photon energy dependence of the Bi2212 spectra is due to the bilayer splitting.
Because of the previous lack of evidence for bilayer splitting in optimally doped and underdoped Bi2212 [12, 13], many analyses and calculations assumed its absence. For example, the momentum distribution curves in this region were usually fitted by one Lorentzian[3, 25], when in fact it consisted of two Lorentzians separated by the bilayer splitting in momentum space. Bi2212 spectra were discussed [2, 7], and particularly, fitted with a one-component formula[26]. We show that even with a two-component model, there are various uncertainties involved in fitting the spectra, because the bonding and antibonding features are weighted by unknown factors at certain ’s, and generally too broad to be reliably separated. For overdoped Bi2212, the dip position will be shifted by the overlapping of the two humps and the the superconducting peaks.
Intra-bilayer coupling was assumed in some theories to explain the different temperature dependence behavior of c-axis and in-plane transport and optical properties of bilayer systems [27]. Our results reinforce the assumptions of these theories. On the other hand, we find that the quasiparticle in the region of optimally doped Bi2212 should be similar to that of Bi2201, and thus much better defined than previously believed from earlier Bi2212 data. The quasiparticle lifetime is more than 100% longer than obtained from previous EDC analyses, i.e., the scattering rate in this “hot spot” is not as large as previously believed, although an anisotropy of the scattering rate still exists in the optimally doped and underdoped regime, as is observed in Bi2201[2, 4].
SSRL is operated by the DOE Office of Basic Energy Science Divisions of Chemical Sciences and Material Sciences. The Material Sciences Division also provided support for the work. The Stanford experiments are also supported by the NSF grant DMR0071897 and ONR grant N00014-98-1-0195-A00002. The crystal growth of op33, Pb-od17, and Pb-OD65 at Stanford was supported by DOE under Contract Nos. DE-FG03-99ER45773-A001 and DE-AC03-76SF00515. M.G. is also supported by the A. P. Sloan Foundation.
REFERENCES
- [1] Z.-X. Shen and D.S. Dessau, Phys. Rep. 253, 1 (1995); A. Damascelli, D.H. Lu, and Z.-X. Shen, J. Electron Spectr. Relat. Phenom. 117-118, 165 (2001), and references therein.
- [2] Z.-X. Shen and J. R. Schrieffer, Phys. Rev. Lett. 78, 1771 (1997).
- [3] T. Valla et al., Phys. Rev. Lett. 85, 828 (2000).
- [4] R. Hlubina and T. M. Rice, Phys. Rev. B 51, 9253 (1995); B. P. Stojkovi and D. Pines, Phys. Rev. Lett. 76, 811 (1996).
- [5] C. Kim et al., Phys. Rev. Lett. 80, 4245 (1998).
- [6] D. S. Dessau et al., Phys. Rev. Lett. 66, 2160 (1991).
- [7] J. C. Campuzano et al., Phys. Rev. Lett. 83, 3709 (1999).
- [8] M. Eschrig, and M. R. Norman, ibid. 85, 3261 (2000).
- [9] D. L. Feng et al., Science 289, 277 (2000); H. Ding et al., preprint, cond-matt/0006143.
- [10] X.-G. Wen and P. A. Lee, Phys. Rev. Lett. 76, 503 (1996); D.-H. Lee, Phys. Rev. Lett. 84, 2694 (2000).
- [11] E. W. Carlsonet al., Phys. Rev. B 62, 3422 (2000).
- [12] H. Ding et al., Phys. Rev. Lett. 76, 1533 (1996).
- [13] J. Mesot et al., cond-mat/0102339 (2001).
- [14] D. L. Feng et al., Phys. Rev. Lett. 86, 5550, (2001).
- [15] Y.-D. Chung et al., cond-matt/0102386.
- [16] P. Bogdanov et al., unpublished.
- [17] S. Rast et al. Europhys. Lett. 51 (1), 103 (2000).
- [18] Z. Yusof et al. cond-matt/0104367.
- [19] M.R. Presland, et al., Physica C 176, 95 (1991). , , and for Bi2201 and Bi2212 respectively.
- [20] J. M. Harris et al., Phys. Rev. Lett. 79, 143 (1997).
- [21] T. Sato, et al., Phys. Rev. B 63, 132502 (2001).
- [22] A. Bansil et al., Phys. Rev. Lett. 83, 5154 (1999).
- [23] We note that the qualitative results discussed here are independent of the chosen parameters, and only the qualitative results shall be compared with the data.
- [24] Data in Fig.4 (d-h) were taken in the momentum window of centered around . Due to the weak dispersion of the electronic states near in Bi2212 and Bi2201, small variations in the momentum window do not affect the spectral lineshape.
- [25] P. V. Bogdanov et al., Phys. Rev. Lett. 85, 2581 (2000).
- [26] For example, M. R. Norman and H. Ding, Phys. Rev. B 57, R11089 (1998); M. R. Norman et al., Phys. Rev. B 63, 140508 (2001).
- [27] L. B. Ioffe, and A. J. Millis, Phys. Rev. B 58, 11631 (1998).