Spectroscopic evidence for a charge-density-wave condensate in a charge-ordered manganite: Observation of collective excitation mode in PrCaMnO by using THz time-domain spectroscopy
Abstract
THz time-domain spectroscopy was used to directly probe the low-energy (0.5–5 meV) electrodynamics of the charge-ordered manganite Pr0.7Ca0.3MnO3. We revealed the existence of a finite peak structure around 2–3 meV well below the charge gap meV. In analogy to the low-energy optical properties of the well-studied low-dimensional materials, we attributed this observed structure to the collective excitation mode arising from the charge-density-wave condensate. This finding provides the importance role of the quasi-one dimensional nature of the charge and orbital ordering in Pr0.7Ca0.3MnO3.
pacs:
75.30.Vn, 71.45.Lr, 72.15.Nj, 73.20.MfI Introduction
The tendency toward for the formation of the charge ordering is a common characteristic of the transition metal oxides with a perovskite structure including high-temperature superconducting cuprates and colossal magnetoresistive manganites. MImada ; YTokura In particular, various kind of the manganites with the doping level of 1/2 show the charge-exchange (CE)-type charge ordering, YTokura ; ZJirak in which Mn3+ and Mn4+ ions by the ratio of 1:1 regularly distribute in the underlying lattice below the charge and orbital ordering temperature [Fig. 1(a)]. Such a real-space charge ordering is characterized by a single-particle excitation across the charge gap . Using the light of frequency , the single-particle excitation spectrum of the charge-ordered (CO) manganites have been extensively investigated in recent years; YOkimoto1 ; YOkimoto2 ; YOkimoto3 ; PCalvani ; HLLiu ; TTonogai for example, Okimoto et al. identified meV of Pr0.6Ca0.4MnO3 by using polarized reflectivity measurements and clarified that the electronic structure is dramatically reconstructed in the order of eV by varying temperature and magnetic field (Refs. YOkimoto2, and YOkimoto3, ). Using transmission measurements, Calvani et al. found that of La1-xCaxMnO3 with and 0.67 can be well described by the Bardeen-Cooper-Schrieffer (BCS) relation. PCalvani
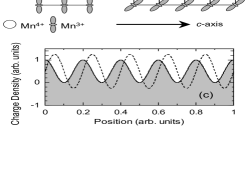
Another important viewpoint is the collective nature of carriers including the orbital degree of freedom, which is thought to have a great impact on extraordinary properties of the manganites, i.e., colossal magnetoresistance (CMR). YTokura2 The conspicuous examples are recent findings of the “orbiton”, a new elementary excitation of the orbital-ordered state observed in LaMnO3 ESaitoh and of the “charge stripes”, a new periodic form composed of a pairing of diagonal Mn3+ with Mn4+ observed in La1-xCaxMnO3 . SMori Therefore, the understandings of the role of carriers with variation of —thus the collective phenomena of carriers in connection with the specific kind of the charge ordering depending on —have attracted interests and may be of central topics in CO manganites. More recently, Asaka et al. proposed the model of the CE-type structure in Pr0.625Ca0.375MnO3 by using the transmission electron spectroscopy as schematically shown in Fig. 1(b). TAsaka It may be viewed as a quasi-one dimensional electronic structure with the reduced dimensionality as compared to the well-known CE-type structure [Fig. 1(a)]: or orbital ordering of Mn3+ occurs along -axis. In another angle, orbital of Mn3+ was cliped by three Mn4+ ions. Such a regular pattern of the distinct charges modifies the uniformity of the charge density, leading to the development of the charge-density-wave (CDW) condensate. GGruner3 This situation is depicted in Fig. 1(c); the charge density (shared area) periodically varies with the position and also time (dashed line), so the new modulation occurs in the underlying lattice (the period of this modulation is larger than the lattice constant). Such a CDW formation is recently deduced from the one-dimensional Fermi-surface (FS) topology in a layered manganite La1.2Sr1.8Mn2O7 by Chuang et al.; YDChuang they determined the detailed map of the FS by using the angle-resolved photoemission spectroscopy and concluded that FS is subject to CDW instabilities even in the ferromagnetic metallic state. In the sight of these considerations, the charge ordering is also characterized by a collective excitation well below . However, no clear evidence for the collective excitation of the CO state was reported so far (see, Note added).
The collective excitation is associated with the mode depending on both the position and the time; the modes arising from the former and the later are referred to as amplitudons and phasons, respectively. GGruner1 According to Lee et al., PALee the dispersion relation of the phasons is given by , where is the wavenumber. By the illumination of light, the collective excitation can make a coupled oscillation, which yields the change of the dielectric constant at , being in proportional to , where and are the longitudinal and transverse optical frequencies, respectively. Therefore, this kind of the coupled mode comes to the surface as a collective excitation mode in the complex optical spectrum. It is also important that the impurity and/or the lattice imperfection has striking influence on the CDW dynamics, because the CDW condensate is pinned by the impurity and therefore the peak position of the collective excitation mode shifts to a finite frequency. GGruner1
In this article we provide the spectroscopic evidence for the CDW condensate in the typical CO manganite Pr0.7Ca0.3MnO3. The basis of this conclusion is derived from the first observation of the collective excitation mode in the optical conductivity spectrum. As well-known CDW system like a quasi-one dimensional K0.3MoO3, the collective excitation mode frequently appears in the millimeter range meV, GGruner1 where it is difficult to get the probing light by the conventional optical spectroscopy. We overcome this limitation by using THz time-domain spectroscopy (TDS), MCNuss which is a powerful tool to unveil the low-energy charge dynamics of the CMR manganites. NKida1 ; NKida3 In addition to this advantage, THz-TDS is especially suited to capture the signal of the fluctuation phenomenon as the high THz pulse is sensitive and matches on the typical time scale of the charge fluctuation in correlated electron system, which is instantiated by THz-TDS experiments on underdoped Bi2Sr2CaCu2O8. JCorson
Material—Material we used in this work is the typical CO manganite; Pr0.7Ca0.3MnO3 with a orthorhombically disordered three dimensional structure. This material exhibits the insulating behavior and undergoes the charge ZJirak ; HYoshizawa and orbital ZJirak ; MvZimmermann ordering below K and the antiferromagnetic spin ordering below K. Due to the deviation of from 1/2, at which the charge ordering is most stable, the extra electrons occupy at the Mn4+ site with maintaining the charge ordering [Fig. 1(b)]. The remarkable characteristics compared to other CO manganites are such an admissibility of the charge ordering and the CMR effect, in which the dramatic variance of the resistance by more than 10 orders of magnitude was attained YTomioka ; YTomioka1 Therefore, various kind of the experimental results are accumulated to date. YTokura It should be mentioned that there are variant interpretaions about the low-temperature phase below 110 K: One is due to the coexistence of the ferromagnetic and antiferromagnetic phases proposed by Jirák et al.; ZJirak another is the canted antiferromagnetic phase (or the spin-glass phase) reported by Yoshizawa et al. HYoshizawa However, the intimate identification is beyond the scope of this study, but we can say that magnetic properties of our samples are consistent with the results by Deac et al. IGDeac

| Sample A | Sample B | |||||
|---|---|---|---|---|---|---|
| (Oe) | (K) | (K) | (K) | (K) | ||
| 500 | 115 | 0.69 | 40 | 115 | 0.82 | 30 |
| 10,000 | 80 | 0.05111Note, we define at 15 K and regard as 15 K. In the original report of Deac et al. (Ref. IGDeac, ), they used these values at 4 K. | 65111Note, we define at 15 K and regard as 15 K. In the original report of Deac et al. (Ref. IGDeac, ), they used these values at 4 K. | 80 | 0.06111Note, we define at 15 K and regard as 15 K. In the original report of Deac et al. (Ref. IGDeac, ), they used these values at 4 K. | 65111Note, we define at 15 K and regard as 15 K. In the original report of Deac et al. (Ref. IGDeac, ), they used these values at 4 K. |
II Methods
II.1 Sample preparation and characterization
Pr0.7Ca0.3MnO3 thin films on MgO(100) substrates were prepared by a pulsed laser deposition technique using a KrF excimer laser (248 nm in the center wavelength). The thin films were deposited at 800 ∘C under an oxygen pressure of 100 Pa and subsequently cooled down under of 300 Pa. An x-ray diffraction pattern at room temperature indicates that the obtained films were of single phase and were mainly -axis oriented in the cubric setting [we barely detected the (110) intensity peak in the logarithmic intensity scale]. We used two samples (A and B) in the following THz-TDS experiments, both of which are obtained by the same growth condition described above. The film thickness of the samples A and B are nm and nm, respectively. We measured the dependence of the -axis lattice constant and observed its sudden increase above nm with the intense (110) intensity peak, implying the partial relaxation of the strained epitaxial growth below nm.
The obtained films show the typical insulating behavior between 20–300 K according to the DC resistivity measurements with a four-probe method.
To characterize magnetic properties of our samples, we measured and dependences of the magnetization in a unit of Bohr magnetron at the Mn-site by a SQUID magnetometer. All data are collected by subtracting the contribution of of the MgO substrates, which are measured independently. Figure 2 shows dependence of of the sample A in the field cooling (FC; open circles) and the zero-field cooling (ZFC; open squares) under 500 Oe or 10 kOe. With decreasing under 500 Oe, both and curves enhance below 120 K and curve starts to deviate curve below the irreversible temperature K. For further decrease with , curve reaches the maximum at temperature K. The difference between and at 15 K is estimated to be at the Mn-site. On the other hand, and curves under 10 kOe are hardwired; we observed the continual increase of without the broad maximum and that the difference between and at 15 K is fairly small. The obtained magnetic properties of the samples A and B are listed in Table 1 together with at 15 K and . These quantities and behaviors of curves both under 500 Oe and 10 kOe are consistent with previous detailed magnetic studies in single crystal and ceramic samples of Pr0.7Ca0.3MnO3 by Deac et al. (Ref. IGDeac, ). It is noticed that we employ at 15 K and regard as 15 K, while Deac et al. used these values at 4 K.
We show in Figs. 3 the curve within kOe at 30 K after is decreased under the zero . The cycling is changed (a) between -50 kOe and 50 kOe and (b) between -10 kOe and 10 kOe. There is a precursor signal of the metamagnetic transition due to the melting of the charge ordering in Fig. 3(a) in contrast to curve shown in Fig. 3(b): YTomioka in the first increasing (closed circles) does not merge into in the subsequent third increasing and second decreasing process (open circles); steeply increases around 45 kOe; Once exceeds the critical field around 45 kOe [inset of Fig. 3(a)], the magnitude of in the subsequent increasing and decreasing process is larger than that shown in Fig. 3(b) (see, at -10 kOe).
We do not directly identify of our samples by e.g., the transmission electron microscopy. However, as will be shown later, dependence of the optical conductivity changes around 220 K (see, Fig. 6), which is a nearly same value of in this material (Ref. ZJirak, ). Moreover, we recently found that dependence of THz radiation from Pr0.7Ca0.3MnO3 thin film, which is made by the same growth procedure in this work, dramatically changes at 140 K and 220 K. NKida2 So we consider that our films have around 220 K.


II.2 THz time-domain spectroscopy
We performed THz-TDS experiments utilizing a photoconducting sampling technique in a transmission configuration. THz-TDS can directly provide complex optical spectra without the Kramers-Kronig transformation, which is indispensable relation to estimate complex optical spectra using the conventional optical spectroscopy (reflection or transmission measurements as described in Sec. I). The principle of the THz-TDS can be found in Refs. MCNuss, ; NKida1, ; NKida3, . We briefly describe the experimental setup of our THz-TDS experiments. The light source is a THz pulse from a dipole-type low-temperature grown GaAs (LT-GaAs) photoconducting switch under a voltage bias of 15 V excited by femtosecond optical pulses from the mode-locked Ti:sapphire laser (800 nm in the center wavelength, 150 fs in the pulse width). The THz pulse through the sample is detected by the bow-tie-type LT-GaAs photoconducting switch. In the measured range, optical constants of the MgO substrate is negligible variation with respect to both and . Therefore, we adopt the data of the MgO substrate at room temperature. By performing the Fourier transformation for the transmitted THz pulse, amplitude and phase shift spectra of Pr0.7Ca0.3MnO3 thin films are obtained. We numerically estimated the complex refractive index spectrum of Pr0.7Ca0.3MnO3 (detailed procedure, see in Ref. NKida1, ). Then, we transformed to the complex dielectric and complex optical conductivity spectra by using following relations; and , respectively, where is the dielectric constant of the bound electrons and is the permittivity of vacuum.
III Results
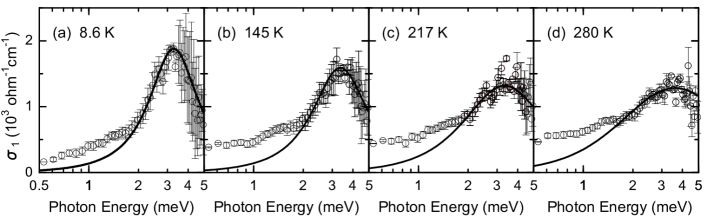
Figures 4(A) and 4(B), respectively, show with a logarithmic energy scale of Pr0.7Ca0.3MnO3 for two samples A and B at the low-temperature. We also plot in Figs. 4(a) and 4(b), corresponding to of the samples A and B, respectively. The experimental configuration differs from each other, so the light source of THz pulse is different in respective measurements. The open circles denote experimental data. The scattering of the data represented by error bars are large below 0.5 meV and above 4 meV due to a poor sensitivity of the THz light sources and an ambiguous convergence of the transformation procedure. There are important and striking features, which can be clearly seen in the measured range (0.5–5 meV): (i) a finite peak structure appears in centered around 2–3 meV below the lowest optical phonon energy meV (the external optical phonon mode originated from the perovskite structureYOkimoto3 ). Accordingly, the distinguished sharp peaks with a dispersive structure are observed in ; the peak frequency in nearly corresponds to . (ii) the observed structure has a small spectral weight of the order of 1% as compared to the single-particle excitation; YOkimoto2 ; YOkimoto3 ; TTonogai at the peak frequency ( cm-1) bears comparison with that at eV ( cm-1). (iii) its peak position strongly depends on samples, while at the peak frequency does not. (iv) the swelling of around 1 meV is observed below the finite peak structure. Conformably, continues to exhibit dependence; in particular of the sample A cuts another zero around 0.8 meV.
To reveal the spectral shape of the finite peak structure with , we performed the same experiments in the sample A on warming through K; at selected [(a) 8.6 K, (b) 145 K, (c) 217 K, and (d) 280 K] are shown in Figs. 5. Fig. 5(a) is same as Fig. 4(A). With increasing up to , around the peak frequency decreases and the spectral shape broadens out, while the swelling structure increases [Figs. 5(b) and (c)]. Even above , the peak structure is still visible [Fig. 5(d)]. One can notice that the spectral shape around the peak structure at 217 K [Fig. 5(c)] does not considerably change above as can be seen in that at 280 K [Fig. 5(d)]. In addition, the peak frequency doe not depends on .
To clarify the change of more clearly with , we plot in Fig. 6 the dependence of the at the peak frequency (closed circles) and at 0.7 meV (open squares) of the sample A, which are normalized by the value of the respective at 280 K. It can be clearly seen that both at the peak frequency and at 0.7 meV above do not show dependence within the experimental accuracy [the data of around the peak structure is subject to the inaccuracy in the transformation procedure with increasing . Thus, the scattering of the data is large]. On the contrary, with decreasing below , at the peak frequency increases and reaches the maximum value at low-temperature, which is 1.6 times larger than the value at , while at 0.7 meV decreases slightly. These results clearly indicate that the observed structure is related to the opening of .
IV Assignment and discussion
Keeping features of the finite peak structure described in Sec. III in mind, let us focus our attention on the assignment of the observed structure.
At finite , thermal fluctuations in the order of ( meV at 10 K) as well as the presence of the impurity band play an important role in the measured range, where is the Boltzman’s constant; the some hopping conduction of the thermally excited carriers within screens in the underlying lattice and subsequently gives rise to a finite peak structure (Ref. DRomero, ). In this viewpoint, dependence of the scattering rate of the charge carriers in the hopping event follows the exponential dependence. SLiu To see quantitatively how the observed structure changes with , we applied a single Lorentz oscillator expressed as
| (1) |
| (2) |
where is the peak frequency, is the relaxation time, is at , and is the plasma frequency. The solid lines in Figs. 4 denote least-squares fits to the respective data. In this procedure, we determined the value of the peak frequency , where crosses zero and then fixed the value of the optical conductivity at . Thus only is a fitting parameter in Figs. 4(A) and (B). We also estimate using only above determined values. The obtained quantities of the samples A and B are summarized in Table 2. As clearly seen in Figs. 4, we can reproduce and by using respective Eqs. (1) and (2) except for the energy region, where the swelling appears in . Figure 7 displays -square plot of the scattering rate of the sample A below 280 K. We found that obey the phenomenogical relation given by
| (3) |
where is the coefficient and is at 0 K. The solid line in Fig. 7 is a least-squares fit to the data below ; Eq. (3) holds in good with meV and meV/K2, providing the clear indication that cannot be account for by thermal as well as variable range hopping conduction pictures of the carriers in the localized state. Localization
| Sample | (meV) | (ps) | (meV) | ( cm-1) | |
|---|---|---|---|---|---|
| A | 3.3 | 0.25 | 2.6 | 1880 | 150 |
| B | 1.9 | 0.45 | 1.9 | 1750 | 1000 |

One may consider the phase separation (PS) picture MMayr —the dynamical coexistence of the ferromagnetic metallic and CO insulating states MUehara —, which is thought to be a key feature of the CMR phenomena and indeed experimentally discussed in Pr0.7Ca0.3MnO3. IGDeac ; AAnane ; PGRadaelli Such PS as well as the presence of the disorder commonly seen in thin films using MgO substrates, produces a finite peak structure as a result of the shifting of the Drude peak centered at . Our samples show the ferromagnetic order at low-temperature; there is a significant hysteresis loop in curve at 30 K with a coercive force of Oe (Figs. 3), which may imply the presence of the ferromagnetic domain in the CO insulating phase. Therefore, we compare our experimental results to the typical characteristics of the PS in CO manganites. AAnane ; TKimura ; RMathieu Best example in the PS picture is the slow relaxation effect observed in Pr0.67Ca0.33MnO3 by Anane et al. (Ref. AAnane, ) and Cr-doped manganites by Kimura et al., TKimura in which the ferromagnetic fraction can be artificially controlled by -annealing process and also the Cr (impurity)-doping at the Mn-site. In these materials, the physical quantities [i.e., and ] strongly depend on the history of the external perturbations. For example, Anane et al. measured the time dependence of in the ferromagnetic phase of Pr0.67Ca0.33MnO3 after of 100 kOe is applied at low-temperature. AAnane They found that the CO insulating phase is restored in the time range of – second (the slow relaxation effect). Very recently, Mathieu et al. reported that under 20 Oe in Nd0.5Ca0.5MnO3 exhibits the different relaxation effect in the typical characteristic time of second by changing only the cooling rate. RMathieu Moreover, the difference of in the history of the cooling rate increases with time. Based on these studies, we have done following THz-TDS experiments: We rapidly cooled the another sample used in Sec. III (the growth condition is same as samples A and B) from room temperature to 4 K with a cooling rate of K per minute and measured the time dependence of while keeping K constant. We observed no slow relaxation effect in the measured range; the spectral shape of the peak structure and the peak frequency meV exhibit no variation per second, which is a contrarious evidence for the PS picture.
As described in Sec. I, we infer the possibility of the CDW condensate due to the quasi-one dimensional charge and orbital ordering in Pr0.7Ca0.3MnO3. We discuss here that the observed peak structure arises from the CDW condensate as compared to the low-energy optical properties of the well-known CDW system. The typical characteristics of the collective excitation mode observed in low-dimensional CDW materials are as follows: GGruner1 ; TWKim1 ; GMihaly ; TWKim2 ; LDegiorgi1 ; LDegiorgi2 (i) As mentioned earlier, the pinning frequency is in general of the order of meV. GGruner1 ; TWKim1 ; GMihaly ; TWKim2 ; LDegiorgi1 ; LDegiorgi2 (ii) The spectral weight of the collective excitation mode is typically 2 orders of magnitude smaller than that of the single-particle excitation. GGruner1 ; TWKim1 ; GMihaly ; TWKim2 ; LDegiorgi1 ; LDegiorgi2 This is due to the relatively large meV, which is in strong contrast to the small spin gap meV observed in the spin-density-wave (SDW) system. In the SDW system, the spectral weight of the collective excitation mode should be comparable to that of the single-particle excitation due to the electron-electron interaction.GGruner2 (iii) Kim et al. found that the pinning frequency in (Ta1-zNbzSe4)2I alloys linearly shifts to higher and at the pinning frequency does not change with increasing the impurity concentration . TWKim2 Same tendencies are also observed in K0.3Mo1-zWzO3 alloys. LDegiorgi2 (iv) Mihály et al. identified the swelling structure in the low-energy side of the collective excitation mode in K0.3MoO3 as the internal deformation on the basis of the generalized Debye analysis. GMihaly Our present findings (i)-(iv) described in Sec. III and various works (i)-(iv) described above in the CDW system, both of which have apparent similar properties and have no contrariety. Moreover, dependence of (Fig. 7) has been also found in the CDW system GGruner1 ; TWKim1 and Eqs. (1) and (2) are same expressions derived from the equation of motion for the CDW dynamics. GGruner1 Therefore, we arrive at the conclusion that the observed structure in Pr0.7Ca0.3MnO3 is assigned to the collective excitation mode arising from the CDW condensate. To the best of our knowledge, this is a first spectroscopic evidence for the CDW condensate in CO manganites.
The description of the CDW condensate in Pr0.7Ca0.3MnO3 is consistent and may explain following previous studies. The CDW easily couples with the lattice and affects phonon modes. Therefore, new infrared modes are expected to be active below . Okimoto et al. found that in addition to phonon modes due to the orthorhombic distortion, many new modes emerge as sharp excitations in Pr0.6Ca0.4MnO3 at 10 K. YOkimoto3 Asamitsu et al. have measured current-voltage characteristics of Pr0.7Ca0.3MnO3 and found the beginning of the nonlinear conduction above the threshold electric field, AAsamitsu which reminds us of the sudden motion of the CDW (CDW depinning) as observed in CDW materials. GGruner1
We should note the previous work about the impurity effect on in a copper oxide superconductor. Basov et al. reported that the Zn (impurity)-doping of the Cu-site in YBa2Cu4O8 distracts the superconductivity and induced the finite peak structure around 10 meV (Ref. DNBasov, ). They concluded that this structure arises from the localization of the charge carriers produced by the randam distribution of the Zn on the Cu-site (disorder) on the basis that the integrated area of up to 1 eV conserves as far as 3.5% Zn-doping. However, same authors also pointed out that if the Drude-like response in YBa2Cu4O8 appears as a result of the collective excitation which is prospective by theory, the peak structure in YBa2(Cu1-zZnz)4O8 can be regard as the collective excitation mode as in both cases of the CDW and SDW. DNBasov
It is well known that the collective excitation mode originates in two different states; one is a “pinned” state due to the pinning of the CDW condensate by the impurity and/or the lattice imperfection and another is the “bound” state, which is created by the coupling of the pinned state with the optical phonon or the impurity near the pinned state. LDegiorgi1 ; LDegiorgi2 Despite the fact that the swelling of below the low-energy side of the finite structure, which is usually ascribed to a internal deformation of the pinned collective excitation mode, GMihaly can be seen in Figs. 4, we cannot clearly claim whether the observed mode is assigned to the pinned or the bound collective excitation mode of the CDW. One pregnant result is that below the peak structure crosses zero around 8 meV and reaches the minus value with decreasing [Fig. 4(a)]. This implies the presence of another and of the another peak structure below the measured range. Further experiments on in the GHz range are necessary to perform the detailed discussion and are now in progress using the cavity perturbation technique.
As shown in Fig. 5(d), the collective excitation mode can be seen even above , while its spectral shape is blurred due to the large proportion of the background contribution above . continues to follow dependence above as shown in Fig. 7 [the fitting procedure by Eq. (3) was performed using the data below ]. This excludes the thermal fluctuation as the origin of this broadening, leading us to conclude that the dynamical short-range CO (charge fluctuation) is still subsistent above instead of the long-range CO below . Such a short-range CO has been already reported by other experiments: Radaeli et al. and Shimomura et al. have revealed that the short-range CO of Pr1-xCaxMnO3 with , PGRadaelli 0.35, 0.4, and 0.5, SShimomura exists even above by neutron and x-ray scattering experiments, respectively. As in the case of the CDW system such as K0.3Mo1-zWzO3 and (TaSe4)2I, the collective excitation modes are also observed above the CDW transition temperature due to the presence of the fluctuating CDW segments, which are systematically investigated by Schwartz et al. ASchwartz For example, the collective excitation mode of K0.3MoO3 is visible even at 300 K ( K).
Finally, we comment on THz radiation from Pr0.7Ca0.3MnO3 thin films excited by the femtosecond optical pulses, which we found recently; NKida2 the radiated spectrum decreases rapidly in intensity with increasing and seems to show the depletion around 2.4 meV. As compared to Figs. 4, such a THz response is due to the absorption of the collective excitation mode during the propagation of the generated THz pulse inside the material.
V Summary and outlook
Summarizing, by using THz-TDS, for the first time, we reported the presence of the finite peak structure around 2–3 meV in Pr0.7Ca0.3MnO3 and assigned it to the collective excitation mode arising from the CDW condensate. The measurements on the polarization dependence of with the grazing incidence of light using the single-domain single crystal will provide the direct evidence and more detailed information for the collective excitation mode. In especially, the measurements of in the GHz range are needed to perform further quantitative discussions. Further interests are to study the melting process under external perturbations and dependence of the collective excitation mode; for example, decreases linearly with from 0.3 to 0.5, TTonogai whereas gradually increases and behaves the less- dependent. YTomioka1 This indicates the breaking of the BCS relation given by . So, it is indispensable to clarify how the collective excitation mode manifesting well below changes with using THz-TDS.
Note added.—After the submission of this article, we became an aware of some reports related in the present study. Kitano et al. [Europhys. Lett. 56, 434 (2001)] and Gorshunov et al. [cond-mat/0201413 (unpublished)] found peak structures around 0.1–1 meV in spin-ladder materials Sr14-xCaxCu24O41 by means of optical spectroscopy and assigned them to the collective excitation modes due to the CDW formation. About manganites, Campbell et al. [Phys. Rev. B 65, 014427 (2001)] interpreted that CDW fluctuations inhere in a layered ferromagnetic manganite La1.2Sr1.8Mn2O7 based on their diffuse x-ray scattering data. Recently, Nagai et al. [Phys. Rev. B 65, 060405(R) (2002)] reported that the electron microscopic data of a layered CO manganite Nd1-xSr1+xMnO4 are consistent with assumptive images of the CDW formation. Very recently, the finite peak structure around 4 meV was also found in 1/8 hole-doped La1.275Nd0.6Sr0.125CuO4 by Dumm et al. [Phys. Rev. Lett. 88, 147003 (2002)] as in the case of YBa2(Cu1-zZnz)4O8. They also ascribe this structure to the localization of the charge carriers in the static stripe phase due to the lack of in this material. However, Fujita et al. reported the evidence for CDW and SDW formations in 1/8 hole-doped La1.875Ba0.125-xSrxCuO4 by elastic neutron scattering experiments [Phys. Rev. Lett. 88, 167008 (2002)].
VI Acknowledgements
We would like to thank in particular Y. Okimoto and also K. Miyano, Y. Ogimoto, and Y. Tokura for giving fruitful comments and discussions. We are also grateful to T. Kawai for giving an opportunity of using SQUID apparatus, T. Kanki, I. Kawayama, K. Takahashi, and H. Tanaka for their help to SQUID measurements, and M. Misra for reading the manuscript.
References
- (1) For a review of the transition metal oxides, see, M. Imada, A. Fujimori, and Y. Tokura, Rev. Mod. Phys. 70, 1039 (1998).
- (2) Colossal Magnetoresistive Oxides, edited by Y. Tokura (Gordon and Breach Science Publishers, New York, 2000).
- (3) Z. Jirák et al., J. Magn. Magn. Mater. 53, 153 (1985).
- (4) For a review of the optical properties of the manganites, see, Y. Okimoto and Y. Tokura, J. Supercond. 13, 271 (2000).
- (5) Y. Okimoto et al., Phys. Rev. B 57, R9377 (1998).
- (6) Y. Okimoto et al., Phys. Rev. B 59, 7401 (1999).
- (7) P. Calvani et al., Phys. Rev. Lett. 81, 4504 (1998).
- (8) H. L. Liu, S. L. Cooper, and S-W. Cheong, Phys. Rev. Lett. 81, 4684 (1998).
- (9) T. Tonogai et al., Phys. Rev. B 62, 13 903 (2000).
- (10) Y. Tokura and N. Nagaosa, Science 288, 462 (2000).
- (11) E. Saitoh et al., Nature (London) 410, 180 (2001).
- (12) S. Mori, C. H. Chen, and S-W. Cheong, Nature (London) 392, 473 (1998).
- (13) T. Asaka et al., Phys. Rev. Lett. 88, 097201 (2002).
- (14) G. Grüner, Density Waves in Solids (Addison-Wesley, Reading, MA, 1994).
- (15) Y.-D. Chuang et al., Science 292, 1509 (2001).
- (16) For a review of the CDW dynamics, see, G. Grüner, Rev. Mod. Phys. 60, 1129 (1988).
- (17) P. A. Lee, T. M. Rice, and P. W. Anderson, Solid State Commun. 14, 703 (1974).
- (18) M. C. Nuss and J. Orenstein, in Millimeter and Submillimeter Wave Spectroscopy of Solids, edited by G. Grüner (Springer-Verlag, Berlin, 1998), pp7–50.
- (19) N. Kida, M. Hangyo, and M. Tonouchi, Phys. Rev. B 62, R11 965 (2000).
- (20) N. Kida and M. Tonouchi, in Physics in Local Lattice Distortions, edited by H. Oyanagi and A. Bianconi (American Institute of Physics, New York, 2001), pp366–370.
- (21) J. Corson et al., Nature (London) 398, 221 (1999).
- (22) H. Yoshizawa, H. Kawano, Y. Tomioka, and Y. Tokura, Phys. Rev. B 52, R13 145 (1995).
- (23) M. v. Zimmermann et al., Phys. Rev. Lett. 83, 4872 (1999).
- (24) Y. Tomioka, A. Asamitsu, Y. Moritomo, and Y. Tokura, J. Phys. Soc. Jpn. 64, 3626 (1995).
- (25) Y. Tomioka et al. Phys. Rev. B 53, R1689 (1996).
- (26) I. G. Deac, J. F. Mitchell, and P. Schiffer, Phys. Rev. B 63, 172408 (2001).
- (27) N. Kida and M. Tonouchi, Appl. Phys. Lett. 78, 4115 (2001).
- (28) D. Romero, S. Liu, H. D. Drew, and K. Ploog, Phys. Rev. B 42, 3179 (1990).
- (29) S. Liu et al., Phys. Rev. B 48, 11 394 (1993).
- (30) It is worth noticing that the appearance of the finite peak structure is a common feature in the disordered system but only in conductors near the compositional insulator-metal phase boundary. In general, the characteristic energy scale of the localized state in the impurity-doped conducting manganites, i.e., Al (impurity)-doping at the Mn-site of La0.825Sr0.175MnO3 (Ref. KTakenaka, ) is about 100 meV, which is considerably different from the peak position of the observed structure.
- (31) K. Takenaka, Y. Sawaki, and S. Sugai, J. Phys. Soc. Jpn. 70, 1896 (2001).
- (32) M. Mayr et al., Phys. Rev. Lett. 86, 135 (2000).
- (33) M. Uehara, S. Mori, C. H. Chen, and S-W. Cheong, Nature (London) 399, 560 (1999).
- (34) P. G. Radaelli et al., Phys. Rev. B 63, 172419 (2001).
- (35) A. Anane et al., Phys. Rev. B 59, 77 (1999).
- (36) T. Kimura et al., Phys. Rev. Lett. 83, 3940 (1999).
- (37) R. Mathieu, P. Nordblad, A. R. Raju, and C. N. R. Rao, Phys. Rev. B 65, 132416 (2002).
- (38) T. W. Kim et al., Phys. Rev. B 40, 5372 (1989).
- (39) G. Mihály, T. W. Kim, and G. Grüner, Phys. Rev. B 39, 13 009 (1989).
- (40) T. W. Kim, S. Donovan, G. Grüner, and A. Philipp, Phys. Rev. B 43, 6315 (1991).
- (41) L. Degiorgi, B. Alavi, G. Mihály, and G. Grüner, Phys. Rev. B 44, 7808 (1991).
- (42) L. Degiorgi and G. Grüner, Phys. Rev. B 44, 7820 (1991).
- (43) For a review of the SDW dynamics, see, G. Grüner, Rev. Mod. Phys. 66, 1 (1994).
- (44) A. Asamitsu, Y. Tomioka, H. Kuwahara, and Y. Tokura, Nature (London) 388, 50 (1997).
- (45) D. N. Basov, B. Dabrowski, and T. Timusk, Phys. Rev. Lett. 81, 2132 (1998).
- (46) S. Shimomura et al., Phys. Rev. B 62, 3875 (2000).
- (47) A. Schwartz et al., Phys. Rev. B 52, 5643 (1995).