Crater formation by fast ions:
comparison of experiment with Molecular Dynamics simulations
Abstract
An incident fast ion in the electronic stopping regime produces a track of excitations which can lead to particle ejection and cratering. Molecular Dynamics simulations of the evolution of the deposited energy were used to study the resulting crater morphology as a function of the excitation density in a cylindrical track for large angle of incidence with respect to the surface normal. Surprisingly, the overall behavior is shown to be similar to that seen in the experimental data for crater formation in polymers. However, the simulations give greater insight into the cratering process. The threshold for crater formation occurs when the excitation density approaches the cohesive energy density, and a crater rim is formed at about six times that energy density. The crater length scales roughly as the square root of the electronic stopping power, and the crater width and depth seem to saturate for the largest energy densities considered here. The number of ejected particles, the sputtering yield, is shown to be much smaller than simple estimates based on crater size unless the full crater morphology is considered. Therefore, crater size can not easily be used to estimate the sputtering yield.
pacs:
PACS numbers: 61.80.Jh, 79.20.Ap, 79.20.-m, 34.50.FaI Introduction
Surface modification of materials by single ion irradiation has been studied in insulators [1, 2, 3, 4, 5, 6], semiconductors [7, 8, 9] and metals [10, 11] using electron, STM and AFM microscopes. A large variety of features have been observed: ‘bumps’ [9], craters [1, 2, 3, 4, 5, 12, 13, 14], crater rims (hillocks) [1, 2, 3, 4, 5, 15, 16], adatoms [8, 17], and surface roughening [18]. Cratering occurs in response to the pressure pulse and fluid flow to the surface produced by the rapid deposition of energy, but the process is not understood quantitatively. ‘Bumps’ generally appear when an energetic process occurs a few layers below the surface creating a low density region with a larger volume which raises the surface. [19]. When the energy loss per unit path length of the projectile, , and the sputtering yield are relatively small, adatoms are observed in both experiments and simulations. By increasing the energy deposition (and the yield) craters are eventually formed. For very large energy deposition and yields, re-deposition of the ejecta plus plastic deformation occurs, producing craters with rims, studied recently for ion bombardment of polymers and other organic materials [5].
Craters are also produced by cluster ion bombardment which can lead to huge sputtering yields [20, 21]. This process has been studied in the velocity regime in which nuclear (elastic) energy loss dominates over electronic energy loss and has been seen in both experiments [20, 22] and simulations [23, 24, 25, 26]. The simulations are generally performed for bombardment at normal incidence and when energy is deposited in momentum transfer collisions to the target atoms. There are few simulations of cratering in the electronic regime [27] and none for non-normal incidence.
At normal incidence the crater produced by a fast incident ion has a roughly circular profile, but recent experiments have focused on ions incident at a large angle with respect to the normal [5] and at grazing incidence [13]. Even at normal incidence MD results for keV ion clusters incident on a copper surface appear to disagree with the scaling laws followed by macroscopic cratering [14] in which the crater radius varies with the bombarding energy [28] as . For oblique incidence in polymers [5] and biomolecules [3] bombarded by fast heavy ions it was found that the crater width does not increase significantly with increasing deposited energy density whereas the size of the crater along the incident ion direction increases rapidly with increasing energy density.
In this paper molecular dynamics (MD) simulations are used to study the surface morphology produced by the energy deposited by fast ions incident at large angle with respect to the surface normal. The results of these simulations are compared to models for the length, width and depth of the crater vs. the energy density (i.e., and track width). Since crater formation is used for sculpting specific surfaces features for biomolecule adsoption [29], for determining surface properties [4], and for estimating sputtering yields [5, 3], we use MD simulations to extract scaling laws for crater formation. Although the simulations are for an “atomic” solid, quite remarkably, the trends are very similar to those recently seen in polymers [5]. However, in the simulations we can study how cratering depends on the material properties and on the energy density deposited by an incident ion.
II MD simulation
Following the passage of a fast heavy ion a cylindrically energized region is produced in a solid, which we refer to as a track of excitations. A Lennard-Jones (L-J) crystalline solid is simulated with particles interacting through the potential [30] . Although this is an oversimplified model of a real solid, this two parameter potential has the advantage that the equations of motion, and, hence, all results, including the crater dimensions, scale with and . In addition, certain weakly bound solids, such as the low-temperature, condensed-gas solids, can be reasonably approximated as L-J solids, with parameters and taken to reproduce the material properties. All L-J samples have a cohesive energy . The interlayer distance for (001) layers is and the bulk modulus is . More details on the MD simulation can be found elsewhere [30, 31, 32]. As in our earlier papers, the scaling with and is replaced by scaling using and the number density . For the fast processes which determine sputtering and cratering we showed that the scaling was roughly preserved when a more complex potential was used [33].
Since the results will be compared to data on polymers we note that certain polymers are roughly simulated using a L-J potential for the inter-chain interactions, plus a stronger potential to account for the covalent interaction within the chain [34]. A typical size for in polymers is 3.5-5 Å [34]. The cohesive energy of a polymer is more difficult to define. The covalent bonds among atoms in the same polymer chain are of the order of several eV’s with slightly weaker bonds between monomers in a chain. However, the bonding among atoms in the neighboring chains is very weak, much smaller than 1 eV, making the binding field “anisotropic”. Removing a small chain requires different energies depending on the chain orientation and entanglement. The average cohesive energy is usually taken to be equal to the sublimation energy. A simple estimate [35] gives eV/monomer. Therefore, even though the L-J calculations scale with size and binding energy, we assume an effective binding energy of 0.5 eV/particle and 5 Å so that our “atoms” very crudely represent monomers. The mass of the simulated particle only changes the time scale, which is given by the dimensionless time , where , and is the mass of the simulated particle. Assuming a mass of gives ps.
The stopping power, i.e. the energy deposited per unit length , and the track radius, here , are typically used to describe the energy density deposited by the ion in its passage through the solid. Since in the electronic sputtering regime only a fraction of the experimental goes into non-radiative de-excitations, in the following we use the symbol to represent the amount of energy deposition contributing to track formation, cratering and sputtering. This fraction has been estimated to be for MeV He+ bombardment of solid O2 [36]. We also use this here to compare the experimental results with our MD simulations. To mimic the non-radiative energy release at the ion track in the MD simulations all particles within a cylinder of radius are given an energy with their velocities in random directions. Therefore, is . A track radius can be estimated from the Bohr adiabatic radius [37], though this has been questioned recently [36, 38]. Thermal spike models have been applied recently to estimate the latent track radius in irradiated polymers with positive results [39]. In this paper all simulations were run for an initial track radius Å, which implies . The incident angle, , is measured in degrees with respect to the surface normal. For all simulations . Larger angles were not feasible as the sample size required became too large to practically simulate. Therefore, the stopping power from MD is multiplied by a factor to compare to experiments done at . The size of the simulated sample was varied depending on the size of such that the results did not depend on the boundary conditions used, and the total simulation time was also varied to be able to “detect” all ejected particles. Most quantities presented are averages of results from a number of simulations in which the directions of the energized atoms were randomly varied.
III Crater features
A cut-across a crater formed following an excitation event is shown in Fig. 1. This cut is in a plane containing the initial surface normal and the track direction and shows the maximum depth of the crater. The crater wall is seen to have a slope similar to the incident ion direction on the entrance side and a very steep slope at the back. Remarkably, this shape is very stable even in this model solid as we have increased the run time by a factor of two and see little relaxation occurring. This is the case because of the rapid cooling in the track core discussed elsewhere [31, 40]. At the end of a typical simulation () the temperature is 50 K higher than the initial temperature of the sample (30 K). Of course, over very long times, relaxation can occur in an atomic material even at relatively low temperatures, whereas it is less likely in a polymer. Therefore, crater morphology in polymers can be readily studied. Despite some problems with their interpretation, scanning force microscopy measurements [16] are regularly used to analyze heavy ion damage in solids.
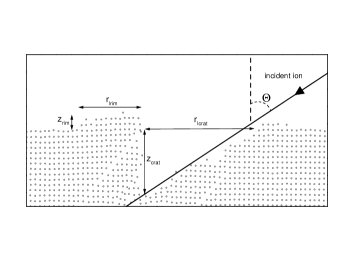
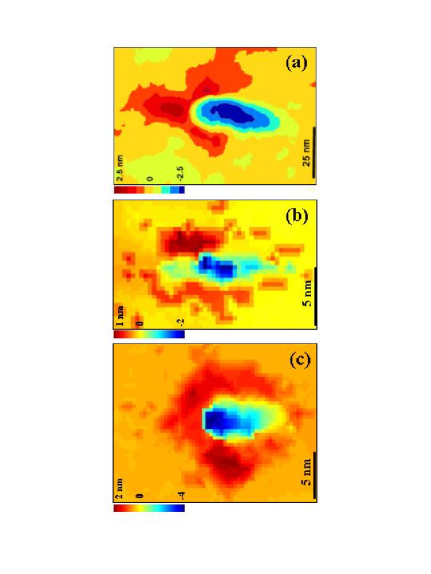
Since all craters were found to have a characteristic morphology, the dimensions used in the subsequent graphs and discussions are indicated in Fig. 1. This crater is formed at high excitation densities () and exhibits a rim on the back side. Not all craters, however, have rims, as we will discuss. To ‘see’ the rim better, in Fig. 2 we show a top view of a crater [41], together with an AFM image of a heavy ion impacting on a PMMA film. The rim is primarily on the sides and the back of the crater, not at the ion entrance site. This is the case even when there is no momentum preferentially deposited along the incident angle as is the case in macroscopic cratering. Here the crater is formed from a cylindrical ‘heat spike’ but has many of the characteristics associated with impact cratering. We also note that atoms on the rim borders are aligned along the preferential [110] directions indicating recrystallization of the material pushed or deposited onto the surface. For this “atomic” material a few adatoms are also seen far from the track region.
The crater formation has several stages, but most of the crater volume is ejected before (35 ps for a mass of ). Temperature varies greatly during the formation process and near the center of the track it can be larger than the melting temperature even after . The dependence of the crater dimensions on the energy deposited in the track can be seen in Fig. 3. The MD values represent the mean value of the crater dimension for 4-8 simulations at each , and the maximum difference among the mean value and values for particular simulation was taken as the error bar. Because of sample size limitations, angles above 60 degrees are problematic whereas experimental results are often performed at nearly grazing incidence. In previous work [32], the width of the distribution of original position of the ejecta along the direction of the incident beam was found to have a dependence while no variation was found in the distribution along the perpendicular direction. Therefore, in order to compare the simulations with the experiments a dependence has been assumed for lengths along the direction of incidence of the ion. As mentioned before, the MD results for crater and rim length obtained at were multiplied by a factor when comparing to the data of Papaléo et al. [5]. Experimental results are the convolution of the actual crater profile with the AFM tip shape, and may also involve some late relaxation of the crater walls. Therefore the measured depth is expected to be smaller than the actual depth. The effect of the convolution is smaller for the other crater dimensions. Finally, the initial track size is not only difficult to estimate but may vary with ion velocity. We have used 10 Å in our simulations, but it is not unreasonable that the initial spike radius is 5 times larger. For all these reasons the MD results were normalized separately for the length, width and depth comparisons in Fig 3. However, it is seen, quite remarkably, that the trends in the experiment and in the simulation are the same. This indicates that useful scaling laws can be obtained and that the crater formation process is insensitive to the details of both the energy deposition profile and the materials properties. This also means that simulations for relatively simple systems can be used to predict crater structures when using ions to modify materials.
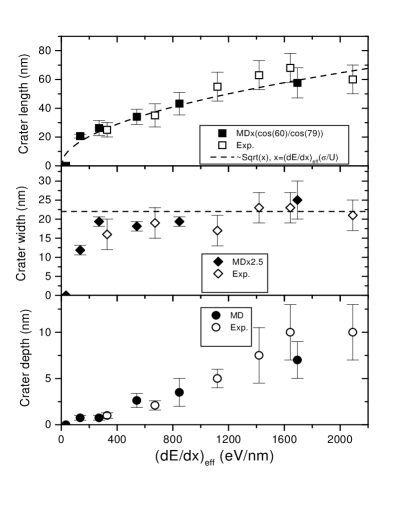
For the Yamamura et al. [42, 43] shock model given in the appendix, the volume of ejecta is determined by the energy density deposited, and the crater length and width are both expected to increase as . Assuming that the volume removed and the crater size are directly related, this gives a dependence for the sputtering yield. The crater length is seen in Fig. 3 to increase roughly as in both the simulations and the experiments. However, the length appears to increase more slowly and to saturate at large values of . After a steep increase, the crater width is seen to be much smaller than the length and increases only very slowly with increasing . Crater depth is much smaller than both the length and the width but appears to increase with . The pressure pulse model, also discussed in the appendix, gives such a scaling, but it also predicts that all of the dimensions have the same scaling. That model gave a good fit to MD calculations of the sputtering yield for ejection of large L-J molecules with hard cores, at normal incidence, and appeared to agree with data from a solid made of large biomolecules [27]. However, it differs from what is seen in the simulations presented here and in the polymer experiments.
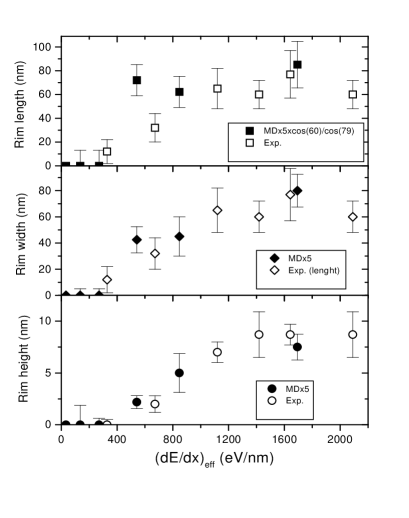
Although it is not clear from Fig. 3, for below (i.e., the energy density in the track is less than the cohesive energy density) no crater is formed. Such a threshold is also seen in the experiments and, therefore, crater detection can give a measure of the cohesive energy. Below the threshold, several atoms escape from the top layers leaving vacancies and the sputtering yield is small, as discussed by Bringa et al. [31]. In addition, some atoms are displaced to the top layer, where they stay as adatoms, but an identifiable crater is not observed. For a shallow crater forms and again several atoms are re-located as adatoms on the surface. For the energy density is about a tenth of the bulk modulus of the material, slip dislocations appear and a crater rim is formed. The dimensions of the rim are shown in Fig. 4 as a function of . After the initial rise at ‘threshold’ the rim length and width stay constant within our error bars, but the rim height increases very slowly with . Again, these trends are also observed experimentally, which is quite remarkable considering the differences in materials.
IV Sputtering yield
The sputtering yield can, of course, be obtained directly from the MD simulations. We showed earlier the surprising result that at the high excitation densities for which the energized track produces craters, the sputtering yield, , is not predicted by standard models. is roughly proportional to times the effective ‘sputter depth’, which is a fraction of the initial track width [31, 32]. When it is difficult to measure it directly, the sputtering yield is often approximated by an estimate of the crater volume. This has been tested for normal incidence for L-J molecules with a core [27]. Here we evaluate that procedure for large incident angle for a standard L-J solid. Typically one assumes that the ejected volume is a semi-ellipsoid, , where , and are the crater length, width, and depth respectively. This rough estimate is based on crater shapes obtained from MD and has been used in several papers [5]. In Fig. 5 we show for the polymers [5] () and the MD crater () using the MD values for the crater in Fig. 3. These are both compared to the actual MD yield, , as a function of .
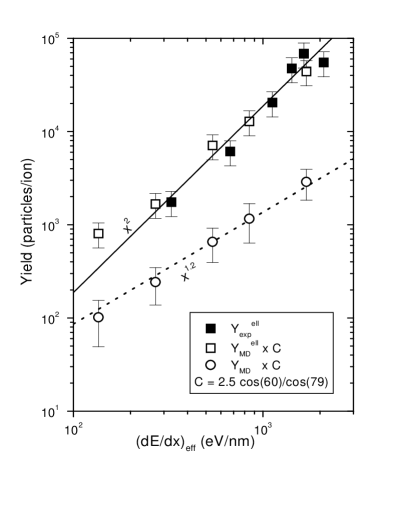
The polymer yield was obtained as in Papaléo et al. [5] using a semi-ellipsoidal volume and the same number density as in the MD simulations (using gives a density of g/cm3). The experimental yield estimate for polymers is larger than the ‘yield’ estimated from the MD craters. The MD yields have been multiplied by a constant , , which results from the normalization of crater size in Fig. 3. However, the trends are the same. They both give a yield that depends quadratically on . This is, fortuitously, the same dependence predicted by thermal spike models for sputtering. However, it is seen that these yield estimates are an order of magnitude larger than , and that they have a steeper dependence on . This large discrepancy is due to several factors. First, the craters are not well approximated by a half ellipsoid. Second, for the excitation energies shown many of the atoms originally in the crater relocate on the rim. Third, there are regions of higher density at the crater walls. These factors add up to a surprisingly large overestimate of the experimental yield. More importantly, since the ratio changes with , the dependence of the yield with can not be obtained from such estimates. Since most of the atoms on the rim come from the crater region, a more detailed description of the morphology of the crater needs to be made to obtain a reasonable yield estimate.
V Discussion and Summary
Here we carried out a series of MD simulations to study crater formation due to the high energy density deposited in a cylindrical ‘track’. Such an energized track might be formed by a penetrating fast ion that deposits its energy in electronic excitations, which is of interest here, or deposits its energy by momentum transfer producing recoil atoms. That is, the craters described are not impact craters like the lunar craters [28], rather they are the craters formed in response to the rapid energy deposition in the track of an energetic ion. The study here is for large angles of the track with respect to the surface normal.
First, we showed that the crater structure remains stable in this Lennard-Jones material over the longest simulations time tested (), which is much larger than the crater formation time (). This is the case because of the rapid cooling of the track by the melting and pressure pulse processes described in earlier papers [31, 40]. We also found the initially surprising result that the scaling of the crater parameters with in this L-J solid agrees remarkably well with that found experimentally, for MeV heavy ion bombardment of polymers at 79 degrees to the normal [5]. This means that concepts learned from MD simulations of simple materials can be applied to more complex materials.
As shown earlier for the experimental data for polymers [5], we find here a threshold for crater formation and a second threshold for rim formation. In another set of experiments the rims could be removed when the polymer is maintained at higher temperatures so that viscous relaxation occurs. Therefore, Papaléo et al. [4] used the relaxation of rim formation vs. material temperature to locate the glass transition temperature. Here we did not vary the material temperature as late relaxation occurring over long time periods can not be described using MD. However, in this paper we are able to relate the two thresholds to the track energy density. Our MD simulations show that the threshold for crater formation occurs when the energy density in the track is close to the cohesive energy density or, in the track formation model used here, when the non-radiative relaxation energy per particle inside the initial track, , is near the sublimation energy . The threshold for rim formation, however, occurs at a higher energy density both in experiment and in the simulations. We find this to be, , which occurs when the energy density in the track roughly equals the bulk modulus of the material. In the crystalline material slip dislocations can form at such energy densities allowing the raised structure to be maintained. Using an efficiency of 0.2 for determining and our simulation parameters, we find that the experimental value of the stopping power needed to form a rim would be around keV/nm for .
Above the threshold the crater width is found to be nearly constant for large incident angles and the crater length and depth increase sub-linearly with . The rim height is ten times smaller than its length and grows faster than the crater size (depth and length). This dependence should be compared to the steeper dependence for the crater radius and depth at normal incidence [12].
We note that for non-penetrating cluster bombardment the crater scaling with energy deposited is different from that found here. For incident clusters the energy of the projectile is deposited close to the surface. For a projectile energy , the crater volume, , is found to follow [44] . However, recent MD simulations seem to indicate that for keV copper clusters on copper scaling is [14] . It was argued that the presence of a molten region in the MD simulation caused the steeper dependence on . New MD results from simulations of keV xenon ions on gold [45] support the quadratic dependence with and relate this to the formation of a melt. It is difficult to compare these results with ours in which the energy is deposited in a long cylindrical track. Assuming that the energy relevant for crater formation is deposited in a volume close to the surface of depth , , we find . Here we also find that the molten region is important in the crater formation. Clustering of the ejecta might also affect crater size [12], but in our simulations, unlike the EAM Cu used in several cluster bombardment simulations [14], there is almost no contribution of clusters to the sputtering yield.
Finally, we examined the accuracy of roughly estimating the sputtering yield by simply parametrizing the crater volume. Recent results by Insepov et al. [44] point to a possible connection between crater size and hardness, and claim that crater volume is also related to the sputtering yield. However, they find a different dependence on the bombarding energy for the yield () and for the crater size (), confirming the discrepancy found here ( and ). We showed that, for the model material studied here, using crater size to estimate sputtering yield can produce surprisingly large errors in the sputtering yield and, even, the wrong dependence on . Therefore, if the yield can not be measured directly, the full morphology to the track and rim need to be described to get an accurate yield.
Acknowledgements.
This work was supported by the National Science Foundation Astronomy and Chemistry Divisions. We would like to thank useful comments from H. M. Urbassek, K. H. Nordlund, and Z. Insepov. E. Hall, from the Research Computing Support Group at UVa., helped creating the contour maps in Fig. 2.A Shock Models for sputtering and crater formation
There are several related models which attempt to explain sputtering at high excitation density using shock waves. Also, the collision of an impactor with a target producing spallation has been extensively studied with MD [46], together with cluster bombardment-induced shock waves [25, 47]. The spallation process originates from the interaction of two rarefaction waves, one coming from the shock wave reflected at the surface and the other coming from the impactor [48]. Yamamura and coworkers [42, 43] estimated the sputtering yield due to shock waves with spherical symmetry intersecting a surface. They suggested that a hemispherical volume is ejected with radius. Then the yield, is proportional to the volume of the ejecta with . Bitensky and Parilis [49] considered cylindrical tracks and the incident angle dependence to model biomolecule sputtering. At normal incidence their model reduced to the spherical shock model. The crater dimensions are assumed to be proportional to .
In order to explain experiments on ejection of whole biomolecules [27] where , Johnson et al. [27] proposed the pressure pulse model (PP). In the PP model, there are many excitation events along the ion track, each contributing to as in the simulations described here. Whereas the energy density evolves diffusively the net energy density gradient causes a net volume force and, therefore, a net momentum transfer radially and towards the surface. If the net momentum transfer to a certain volume is larger than some critical momentum that volume will be ejected. This determines a critical radius , with the volume ejected proportional to . The PP model predicts an angular distribution peaked at 45o and agrees well with MD simulations that use a Lennard-Jones potential with a core to describe the interactions of large excited molecules [27]. Notice that the PP model gives crater dimensions proportional to . If a critical energy for ejection is considered [50], instead of a critical momentum, the yield is , as in Kitazoe et al. [42].
In all models discussed above the width and length of the crater have the same dependence on . When oblique ion incidence is considered the yield increases as because the length of the crater increases also as [12] . Therefore, the dependence is the same as at normal incidence, which is not what is found in the simulations presented here.
REFERENCES
- [1] J. Kopniczky et al, Phys. Rev. B 49, 625 (1994).
- [2] J. Eriksson et al, Nucl. Instr. and Meth. B 101, 142 (1995).
- [3] J. Eriksson et al, Int. J. Mass Spectrom. Ion Processes 175, 293 (1998).
- [4] R.M. Papalėo et al., Phys. Rev. B 62, 11273 (2000).
- [5] R. M. Papaléo et al., Nucl. Ins. and Meth. Phys. Res. B 148 (1999) 126.
- [6] F. Thibaudau, J. Cousty, E. Balanzat, and S. Bouffard, Phys. Rev. Lett. 67, 1582 (1991).
- [7] K. Kyuno, D.G. Cahill, R.S. Averback, J. Tarus and K. Nordlund, Phys. Rev. Lett. 83, 4788 (1999).
- [8] K. Nordlund, M. Ghaly, R. S. Averback, M. Caturla, T. Diaz de la Rubia, and J. Tarus, Phys. Rev. B 57, 7556 (1998).
- [9] Q. Yang, T. Li, B. V. King, R. J. MacDonald, Phys. Rev. B 53, 3032 (1996).
- [10] H. Dammak et al., Phys Rev. Lett. 74, 1135 (1995).
- [11] R.C. Bircher and S.E. Donnely, Nucl. Instr. and Meth. B 148, 194 (1999).
- [12] C. T. Reimann, Nucl. Instr. and Meth. B 95, 181 (1994).
- [13] I. V. Vrobyova, Nucl . Ins. and Meth. Phys. Res. B 146, 379 (1998).
- [14] R. Aderjan and H. M. Urbassek, Nucl. Instr. and Meth. B 163-64, 697 (2000).
- [15] A. Müller et al., Nucl. Instr. and Meth. B 166-167, 581 (2000).
- [16] F. Ohnesorge and R. Neumann, Europhys. Lett. 50, 742 (2000).
- [17] K. Nordlund, J. Keinonen, Mai Ghaly and R. Averback, Nature 398, 49 (1999).
- [18] Z. Insepov and I. Yamada, Nucl. Instr. and Meth. B 148, 121(1999
- [19] R. Averback and T. Diaz de la Rubia, in Solid State Physics 51, H. Ehrenreich and F. Spaepen eds., Academic Press, 281-402 (1998).
- [20] H. H. Andersen et al, Phys. Rev. Lett. 80, 5433 (1998).
- [21] H.H. Andersen, A. Johansen and V.S. Touboltsev, Nucl. Instr. and Meth. B 163-64, 727 (2000).
- [22] I. Yamada, J. Matsuo, N. Toyoda, T. Aoki, E. Jones and Z. Insepov, Mat. Sci. and Engnr. A 253, 249 (1998).
- [23] V. I. Shulga and P. Sigmund, Nucl. Instr. and Meth. B 47, 236 (1990).
- [24] M. Ghaly and R.S. Averback, Mat. Res. Soc. Symp. Proc. 279, 17 (1992).
- [25] Z. Insepov and I. Yamada, Nucl. Instr. and Meth. B 112, 16 (1996).
- [26] T. Aoki, J. Matsuo, Z. Insepov, and I. Yamada, Nucl. Instr. and Meth. B 121, 49 (1997).
- [27] D. Fenyö and R. E. Johnson, Phys. Rev. B 46, 5090 (1992).
- [28] D. Gault et al, J. Geophys. Res. 80, 2444 (1975).
- [29] A. Quist et al, J. Colloid Interface Sci. 189, 184 (1997).
- [30] E. M. Bringa and R. Johnson, Nucl. Instr. and Meth. B 143, 513 (1998).
- [31] E. M. Bringa, R. Johnson, and Ł. Dutkiewicz, Nucl. Instr. and Meth. B 152, 267 (1999).
- [32] E. M. Bringa and R. Johnson, to be published in NIMB.
- [33] E. M. Bringa, R. E. Johnson and M. Jakas, Phys. Rev. B 60, 15107 (1999).
- [34] K. Binder, Monte Carlo and Molecular Dynamics simulations in Polymer Science, Oxford University Press, New York, 1995.
- [35] The bulk modulus, which is known from experiments, can be taken proportional to the sublimation energy.
- [36] R. E. Johnson, M. Pospieszalska, and W. L. Brown, Phys. Rev. B 44, 7263 (1991).
- [37] J. L. Magee and A. Chatterjee, in Kinetics of Nonhomogeneous processes, G. R. Freeman ed., John Wiley & Sons, New York, 1987.
- [38] P. Sigmund, Nucl. Instr. and Meth. 164/165, 401 (2000).
- [39] G. Szenes et al, Nucl. Instr. and Meth. B 166-167, 933 (2000).
- [40] M. M. Jakas and E. M. Bringa, Phys. Rev. B. 62, 824 (2000).
-
[41]
Figures of several craters, including 3D views, can be found
at:
http://dirac.ms.virginia.edu/ emb3t/craters/craters.html - [42] Y. Kitazoe, N. Hiraoka and Y. Yamamura, Surf. Sci. 111, 381 (1981).
- [43] Y. Yamamura, Nucl. Instr. and Meth. 194, 515 (1982).
- [44] Z. Insepov, R. Manory,J. Matsuo, I. Yamada, Phys. Rev. B 61, 8744 (2000).
- [45] E. M. Bringa, K. Nordlund, and Keinonen, in preparation.
- [46] B. L. Holian, Shock wave and spallation by Molecular Dynamics, in Microscopic Simulations of Complex Hydrodynamic Phenomena, M. Mareschal and B. L. Holian, eds., Plenum Press, pp. 75-86, 1991.
- [47] M. Moseler, J. Nordiek, and H. Haberland, Phys. Rev. B 56, 15439 (1997).
- [48] Ya. B. Zel’dovich and Yu. P. Raiser, Physics of Shock Waves and High Temperature Hydrodynamic Phenomena, Academic Press, New York, 1967.
- [49] I.S. Bitensky and E.S. Parillis, Nucl. Instr. and Meth. B 21, 26 (1987).
- [50] Bitensky, I.S., Goldenburg, A.M. and Parilis, E.S. 1990, in Ion Formation from Organic Solids V (IFOSV), A. Hedin et al. eds., Wiley, Chichester, p. 205.