[
Carrier dynamics and infrared-active phonons in -axis oriented RuSr2GdCu2O8 film
Abstract
The conductivity spectra of -axis oriented thin RuSr2GdCu2O8 film on SrTiO3 substrate, prepared by pulsed-laser deposition, are obtained from the analysis of the reflectivity spectra over broad frequency range and temperatures between 10 and 300 K. The free charge carriers are found to be strongly overdamped with their scattering rate (1.0 eV at room temperature) exceeding the plasma frequency (0.55 eV). Four phonon lines are identified in the experimental spectra and assigned to the specific oxygen related in-plane polarized vibrations based on the comparison with the results of a lattice dynamics shell model calculations.
pacs:
PACS: 74.25.Gz, 74.25.Kc, 78.20.Ci, 74.70.Dd]
Thin films of ruthenium oxides are of increasing interest because of their unique physical properties. Conducting Sr1-xCaxRuO3 materials, for instance, are known to be an excellent component for the manufacturing of multilayers, which consist of conductors, superconductors, and insulators.[1, 2] Their magnetic properties could be varied in a controllable way by altering the Sr-Ca ratio. More recently another ruthenium oxide material, RuSr2GdCu2O8 (Ru1212), is in focus of both experimental and theoretical studies as it exhibits highly unusual combination of magnetic and superconducting properties (see, e.g. Ref.[3, 4, 5, 6, 7] for a review). In this paper we report the results of an optical study of -axis oriented Ru1212 film.
A KrF excimer pulsed laser with wavelength = 248 nm was used to deposit RuSr2GdCu2O8 thin films on (001)-oriented SrTiO3 (STO) substrates. Stoichiometric Ru1212 target was prepared using standard solid-state reaction similar to those reported earlier for the bulk sample.[8] The films were deposited under various growth conditions. We found that, in agreement with the results of McCrone et al.[9], the Ru1212 phase can only be formed after high temperature post-annealing. Magnetization measurements revealed the existence of the magnetic ordering transition at T120 K, slightly lower compared to bulk materials. The resistivity data did not show clear signs of superconductivity down to 10 K. The details of film preparation will be published elsewhere.[10]
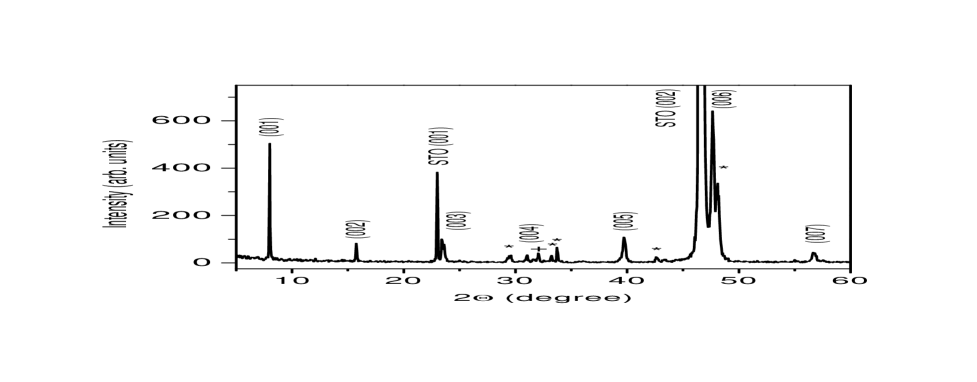
Fig. 1 shows the typical X-ray diffraction scan pattern for the annealed film. Pronounced (00l) reflection peaks indicate that the film is predominantly -axis oriented. This fact is also confirmed by our polarized Raman scattering studies and comparison with the data obtained for Ru1212 single crystals.[11] The -axis lattice parameter is determined to be 11.3 Å, in close agreement with earlier reports for sintered polycrystalline samples.[8, 12] The film is, though, not phase pure as yet. The additional peaks (their intensity did not exceed 10% of the maximum peak intensity of Ru1212) are marked with asterisks in Fig. 1 and originate from an unidentified impurity phase. The peak marked with a ”+” is due probably to the (103)/(110) reflections of STO substrate.
Optical properties of Ru1212 film were studied on a Bomem DA-8 Fourier Transform Interferometer in the frequency range 50 - 10,000 cm-1. A helium-flow cryostat was used for temperature measurements between 300 and 10 K. As the film thickness is rather small (0.3 m), one needs to account for the substrate response in order to quantitatively evaluate the intrinsic properties of the film from the reflectivity measurements. This could be done by taking into account multiple reflections in the film/substrate system (see, e.g., Ref. [13]).
First, we present the results of model calculations of the reflectivity for a conducting film on top of the SrTiO3 substrate. The dielectric function of either the substrate or the film as a function of frequency was approximated as follows
| (1) |
where is the high frequency dielectric constant, the Drude term accounts for the free carriers contribution with and being the unscreened plasma frequency and scattering rate, and the sum accounts for phonons with frequency , damping and oscillator strength .
The parameters of the three substrate oscillators were obtained from the analysis of the reflectivity of the substrate alone and their room temperature values are listed in Table I. The high frequency dielectric constant is found to be . All substrate parameters are in close agreement with the reported data (see, e.g., Ref. [13]).
| Frequency (, cm-1) | Damping (, cm-1) | Oscillator strength () |
| 109.2 | 19.3 | 209 |
| 175.4 | 13.4 | 5.52 |
| 542.1 | 20.3 | 1.46 |
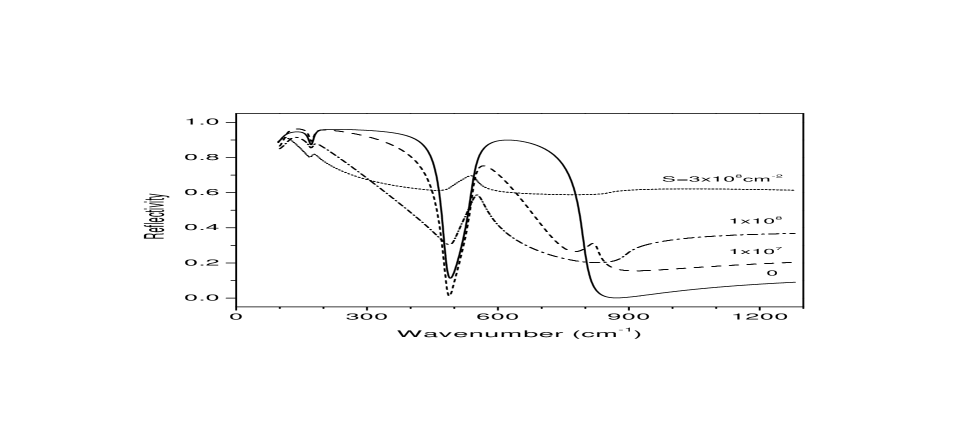
The experimental reflection spectrum of the substrate is shown by the solid line in Fig. 2. The other model curves in this Figure correspond to the substrate covered by a 0.3 m thick film with = 7.0, a fixed plasma damping = 7000 cm-1, and varying from to cm-2. The film with the lowest weakly modifies the reflection spectrum as the sharp minima at about 175 and 490 cm-1 remain very pronounced; the reflectivity level increases, however, at frequencies above 800 cm-1. An increase of the free carrier density in the film ( cm-2) affects considerably the shape of the spectrum: the reflectivity drops rather quickly with frequency in the range 150-450 cm-1 and pronounced ”restrahlen” band in the range 500-800 cm-1 becomes much narrower. For cm-2 the only substrate feature left in the spectrum is the peak around 500 cm-1 on top of a flat and rather high reflection background.
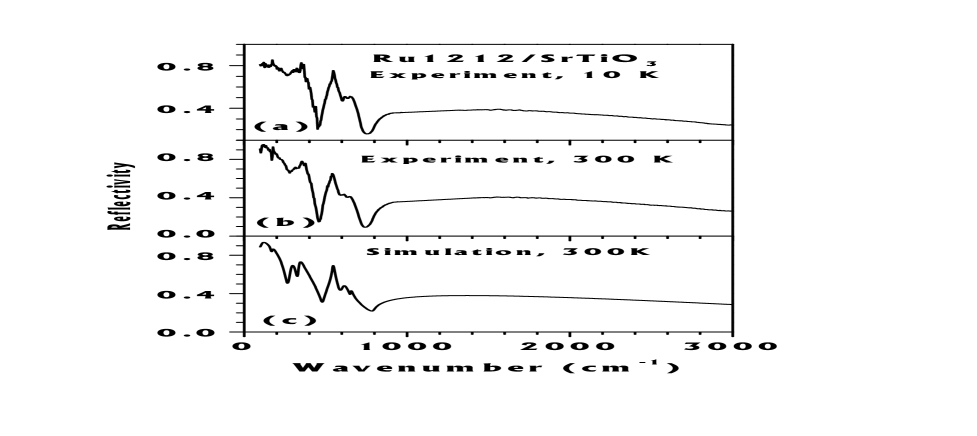
Experimental spectra of film/substrate system at 10 K (the upper panel) and 300 K (the middle panel) are shown in Fig. 3. The fit of the room temperature spectrum (the lowest panel in Fig. 3) reproduces all prominent features of the experimental spectra rather well although we were not able to fit the spectrum within the noise level. This fact implies that the Drude-Lorentz description of the free carrier response in Ru1212 is oversimplified, but could be used to get an estimate of free carrier plasma frequency and damping. We mention that there are no drastic changes of the spectra upon cooling down to 10 K.
The Ru1212 free carrier parameters at room temperature obtained from the best fit are = (1.2 0.1) cm-2 and cm-1; the high frequency dielectric constant is found to be 6.2 0.2. The screened plasma frequency of the film is (4400 1200) cm-1, smaller than the scattering rate , a fact which points towards a strongly overdamped free carrier dynamics in Ru1212. One of the physical reasons of this high scattering rate might be the microstructure peculiarities, namely, the presence of well defined domains on the lateral scale 50-200 Å, as shown by the high resolution electron microscopy[4]. It appears that the dense domain structure is also at the origin of complicated magnetic and superconducting properties of Ru1212. Extremely high scattering rate and, correspondingly, very short carrier free path could also be due to structural or magnetic features of Ru1212 on even a smaller scale, comparable to the lattice parameters.
| Frequency (, cm-1) | Damping (, cm-1) | Oscillator strength () |
| 285 | 32 | 10.2 |
| 335 | 19 | 3.56 |
| 604 | 40 | 0.74 |
| 655 | 10 | 0.07 |
Finally, relatively sharp structures in the reflection spectra of the Ru1212 film are due to the infrared active phonons with polarization . The fit of the spectra yields the set of phonon parameters, listed in Table II.
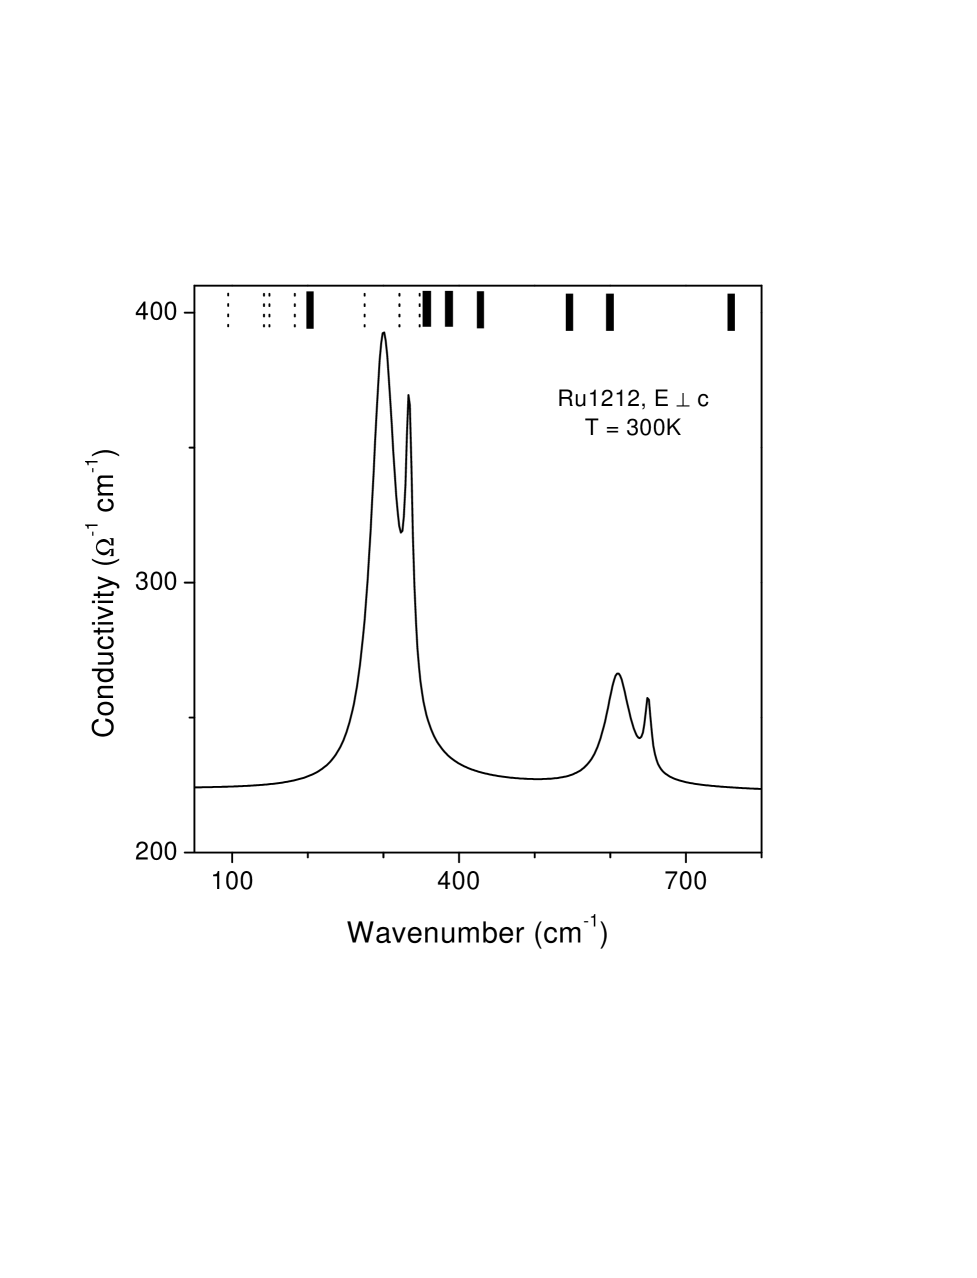
The conductivity spectrum of Ru1212, calculated according to the Eq. 1 and parameters from Table II is shown in Fig. 4. The fact of strongly overdamped carrier dynamics is reflected in almost constant in-plane ”background” conductivity in the frequency range below 800 cm-1. We mention that the absolute values of conductivity are by factor of two higher compared to what was earlier reported for ceramic Ru1212 samples,[14, 15] for which the in-plane conductivity was supposed to be a dominant component.[16] The four peaks are the most intensive phonons. In the upper part of Fig. 4 the position of the transverse optical (TO) modes of Ru1212 for is shown, calculated within the shell model which, as we showed earlier, describes well -axis polarized modes in this material.[14] For Ru1212, which crystallizes in the tetragonal space group[17], there are in total 14Eu infrared-active modes for light polarized normal to the -axis. Seven of them are predicted to possess vanishing oscillator strength (LO-TO splitting is smaller than 3 cm-1) and their position is shown by thin dotted lines in the upper part of Fig. 4. A number of more intense band are expected to appear between 350 and 400 cm-1 (middle frequency range) and 530-600 cm-1 (high frequency range), which are shown by solid lines in Fig. 4. Experimentally, four phonon lines (parameters are listed in Table II) are dominating the low frequency conductivity spectra of Ru1212. By comparison with the results of lattice dynamics calculations, they originate (in order of increasing frequency) from two apex oxygen vibrations, oxygen in the Ru-O layer (ORu) and Cu-O plane (OCu).
In conclusion, the frequency dependent conductivity of Ru1212 film for is obtained from the reflection data of thin -axis oriented Ru1212 film, deposited on SrTiO3 substrate. Free charge carriers of the film are found to be strongly overdamped. The well developed domain structure of Ru1212 is a possible reason for this effect. Four phonon lines have been identified in the spectra. Based on the results of shell model lattice dynamics calculation, they are assigned to the specific vibrations of oxygen in different crystallographic positions.
Acknowledgements. This work was supported by NSF Grant No. DMR-9804325, the State of Texas trough the Texas Center for Superconductivity at the University of Houston, T.L.L. Temple Foundation and John J. and Rebecca Moores Endowment.
REFERENCES
- [1] C.B. Eom, R.J. Cava, R.M. Fleming, J.M. Phillips, R.D. van Dover, J.H. Marshall, J.W.P. Hsu, J.J. Krajewski, and W.F. Peck, Jr., Science 258, (1992) 1766.
- [2] I. Bozovic, J.H. Kim, J.S. Harris, Jr., C.B. Eom, J. Phillips, and J.T. Cheung, Phys. Rev. Lett. 73 (1994) 1436.
- [3] J.L. Tallon, C. Bernhard, M. Bowden, P. Gilbert, T. Stoto, and D. Pringle, IEEE Trans. Appl. Supercond. 9 (1999) 1696.
- [4] A.C. McLaughlin, W. Zhou, J.P. Attfield, A.N. Fitch, and J.L. Tallon, Phys. Rev. B 60, (1999) 7512.
- [5] C.W. Chu, Y.Y. Xue, S. Tsui, J. Cmaidalka, A.K. Heilman, B. Lorenz, and R.L. Meng. Physica C 335 (2000) 231.
- [6] J.-X. Zhu, C.S. Ting, and C.W. Chu, Phys. Rev. B 62 (2000) 11369.
- [7] K. Nakamura, K.T. Park, A.J. Freeman, and J.D. Jorgensen, Phys. Rev. B 63 (2001) 024507.
- [8] C.W. Chu, Y.Y. Xue, R.L. Meng, J. Cmaidalka, L.M. Dezaneti, Y.S. Wang, B. Lorenz, and A.K. Heilman, cond-mat. preprint/9910056, October 5, 1999.
- [9] J.E. McCrone, G. Gibson, J.L. Tallon, J.R. Cooper, and Z. Barber, preprint (1999).
- [10] S.Y. Chen et al., to appear.
- [11] V.G. Hadjiev, M.N. Iliev, et al., to appear.
- [12] L. Bauernfeind, W. Widder, and H.F. Braun, Physica C 254 (1995) 151.
- [13] J. Humliček, A.P. Litvinchuk, W. Kress, B. Lederle, C. Thomsen, M. Cardona, H.-U. Habermeier, and I.E. Trofimov, Physica C 206 (1993) 345.
- [14] A.P. Litvinchuk, M.N. Iliev, Y.-Y. Xue, R.L. Meng, C.W. Chu and V. Popov, Phys. Rev. B 62 (2000) 9709.
- [15] A.V. Boris, P. Mandal, C. Bernhard, N.N. Kovaleva, K. Pucher, J. Hemberger, and A. Loidl, Phys. Rev. B 63 (2001) 184505.
- [16] A.P. Litvinchuk, C. Thomsen, and M. Cardona, in ”Physical Properties of High Temperature Superconductors IV”, ed. by D.M. Ginsberg (World Scientific, Singapore, 1994), p.375.
- [17] O. Chmaissem, J.D. Jorgensen, H. Shaken, P. Dollar, and J.L. Tallon, Phys. Rev. B 61 (2000) 6401.