[
Electron Spin Resonance of Ni-doped CuGeO3 in the paramagnetic, spin-Peierls and antiferromagnetic states: Comparison with non-magnetic impurities
Abstract
We have performed Electron Spin Resonance measurements on single crystals of the doped spin-Peierls compounds CuGe1-ySiyO3 and Cu1-xMxGeO3 with M = Zn, Mg, Ni (). The first part of our experiments was performed in the paramagnetic and spin-Peierls phases at 9.5, 95 and 190 GHz. All non-magnetic impurities (Si, Zn and Mg) were found to hardly affect the position and linewidth of the single line resonance, in spite of the moment formation due to the broken chains. In contrast to Si, Zn and Mg-doping, the presence of Ni (S = 1) at low concentration induces a spectacular shift towards high fields of the ESR line (up to 40% for x=0.002), together with a large broadening. This shift is strictly proportional to the ratio of Ni to Cu susceptibilities: Hence it is strongly enhanced below the spin-Peierls transition. We interpret this shift and the broadening as due to the exchange field induced by the Ni ions onto the strongly exchange coupled Cu spins. Second, the antiferromagnetic resonance was investigated in Ni-doped samples. The frequency vs magnetic field relation of the resonance is well explained by the classical theory with orthorhombic anisotropy, with values remarkably reduced, in accordance with the study of the spin-Peierls and paramagnetic phases. The easy, second-easy, and hard axes are found to be , , and axes, respectively. These results, which are dominated by the single ion anisotropy of Ni2+, are discussed in comparison with those in the Zn- and Si-doped CuGeO3.
pacs:
PACS: 75.10Jm, 76.30Da]
I Introduction
The quasi-one dimensional compound CuGeO3 is the first inorganic system exhibiting a spin-Peierls (SP) transition[3]. It has been extensively studied since large single crystals are available, which allows to perform various kinds of experiments. The magnetic structure of CuGeO3 is as follows: the spin correlations are antiferromagnetic along the and axes and ferromagnetic along the -axis. Below K, the Heisenberg antiferromagnetic (AF) chains, running along the -axis, become dimerized and an energy gap meV opens between the singlet ground state and the first excited triplet states. The SP transition is evidenced by a kink at in the magnetic susceptibility and is clearly revealed by X-ray and neutron scattering[4]. A unique feature of this compound is that the effect of impurities can be studied by substituting impurity ions (Zn, Mg and Ni) for the Cu sites [5, 6, 7, 8, 9, 10] and Si for the Ge sites [11]. These substitutions all induce a strong decrease of and the appearance at lower temperature () of a three-dimensional AF phase. The most intriguing feature in the impurity effects is the coexistence below of the SP state and the long-range AF ordering, which was extensively studied both experimentally[12, 13] and theoretically[14]. Magnetization measurements performed in Cu1-xMxGeO3 (with M = Zn, Mg, Ni) and CuGe1-ySiyO3 single crystals have revealed the existence of a universal Temperature - Doping concentration phase diagram with a scaling factor [15]. The spin-Peierls temperature shows a linear decrease as the doping level increases, following the relation , while the Néel temperature increases linearly from 0 at low doping levels up to a broad maximum around 4.5 K for and then gradually decreases. Thus, doping on the Ge site by Si impurities (spin 0) is three times more efficient than doping on the Cu site, either by magnetic (Ni: spin 1) or non-magnetic (Zn, Mg) impurities. For all non-magnetic impurities, the easy axis in the AF phase is the -axis[8, 11, 12, 15, 16, 17, 18, 19]. However, some deviations from this universal behavior are noted in the case of Ni concerning the AF phase. Indeed, the curve for Ni is slightly lower[15] and the easy axis was found to be the -axis from susceptibility[15, 20] and neutron scattering experiments[9].
Electron spin resonance (ESR) studies of the paramagnetic and spin-Peierls phases have been performed by different authors in pure[21, 22, 23, 24], Si-, and Zn-doped CuGeO3[18, 25, 26], and the antiferromagnetic resonance has also been studied for these two substitutions[17, 18, 19]. But very little has been done using the ESR technique in Ni-doped CuGeO3, besides the work of Glazkov et al.[27] where a large number of parameters is needed for the interpretation.
The first aim of this paper is to make a comparative ESR study of Cu1-xMxGeO3 (with M = Zn, Mg, Ni) and CuGe1-ySiyO3 compounds, to find out if the universal character of the Temperature-Concentration phase diagram holds also for ESR, especially when comparing non-magnetic and magnetic impurities. Extensive ESR measurements were performed in the paramagnetic and spin-Peierls phases on high quality single crystals, for various doping levels. The results obtained in the non-magnetic impurity doped compounds are briefly presented and those obtained in Ni-doped CuGeO3 are focused on. For the latter, our results on the ESR line shift are analyzed in detail and a model is proposed to explain the observed effect.
The second aim of this paper is to study the antiferromagnetic resonance (AFMR) in Ni-doped CuGeO3 samples, and to compare the results with those obtained in the case of non-magnetic impurities. ESR is indeed a crucial technique to study the magnetic anisotropy at a microscopic level. In both studies (ESR and AFMR), Ni substitution is shown to produce different effects on the spin resonance of CuGeO3, as compared to the case of non-magnetic impurities.
II Experimental set up
The CuGe1-ySiyO3 (y = 0, 0.002, 0.007, 0.0085, 0.015, 0.06, 0.085) and Cu1-xMxGeO3 (M = Zn with , 0.039, 0.01; M = Mg with , 0.03, 0.05; M = Ni with , 0.0085, 0.02, 0.03, 0.04) single crystals used in this study were grown from the melt under oxygen atmosphere using a floating zone method associated with an image furnace. All samples were then analyzed using Inductively Coupled Plasma Atomic Emission Spectroscopy (ICP/AES). The doping levels that are reported here are thus the effective ones derived from the ICP/AES analysis, which are usually slightly lower than the nominal concentration.
The ESR measurements were performed between 4 and 300 K in all single crystals on a standard X-band spectrometer (Bruker ESP 300E), operating at a frequency GHz and in a field range T. With this apparatus, the measured signal is the field derivative of the absorption. The crystal of typical mass 5 to 10 mg can be mounted onto the sample holder in order that the magnetic field lies either in the or in the plane. Because of the huge broadening of the ESR line induced by Ni-doping, further measurements were performed on a home-made high field spectrometer. These experiments were crucial to interpret the observed phenomena. The measurements were performed between 4 and 250 K at frequencies 95 and 190 GHz, with the field parallel to the -axis. The sample size was about 488 mm3, corresponding to a mass of more than 500 mg. With this spectrometer, the measured ESR signal is the field derivative of a combination of the dispersion and absorption. The AFMR measurements were performed on two Cu1-xNixGeO3 single crystals, with and 0.04, in the frequency ranges of 9, 20, 35, and 50 GHz and a temperature of 1.8 K (i.e. below ). The dimension of the crystals used in these experiments is about 332 mm3. We used an X-band spectrometer (JOEL-JES-RE3X) for the experiments around 9 GHz and a home-made spectrometer for higher frequencies. For the latter, microwaves are generated from two klystrons at 20 and 50 GHz and from a Gunn-oscillator at 35 GHz, the magnetic field () being produced by a 20 T superconducting magnet from Oxford Instruments. The magnetic susceptibility measurements in the Ni-doped samples are also presented in this paper (for the other compounds, see Ref. [15]): they were performed on a home-made SQUID magnetometer operating in the temperature range K and in the magnetic field range T.
III ESR in CuGeO3 doped with non-magnetic impurities
The temperature dependence of the magnetic susceptibility was first measured in all the samples whose ESR study is presented here (see Ref. [28] for Si-doping and Ref. [15] for Si, Zn and Mg-doping). We present briefly in this section the ESR results obtained in the case of non-magnetic impurities and discuss the linewidth, the shift, and the integrated intensity of the resonance line.
A wide series of CuGeO3 samples doped with non-magnetic impurities Si, Zn, and Mg (see the list in sec. II) and a sample of pure CuGeO3 were investigated. In all Si-, Zn- and Mg-doped CuGeO3 compounds, a single lorentzian derivative ESR line was observed at X-band between 5 and 300 K along the three crystallographic axes, as for pure CuGeO3.
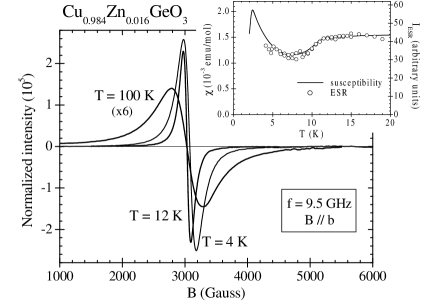
Figure 1 shows examples of spectra obtained in a 1.6% Zn-doped sample for , i.e. for the field perpendicular to the chain axis, and at different temperatures, above and below K. In all these samples and along the three crystallographic directions, the linewidth and its temperature dependence were found to be identical to those of pure CuGeO3 above 15 K[29], but not below: depends on the Néel and SP temperatures, which vary with the doping level. As can be seen in Fig. 1, a 1% shift of the ESR line is observed only below . The same result was found in all CuGeO3 samples doped with non-magnetic impurities and also in the pure compound: The values remain constant down to 10-15 K and become shifted at lower temperature by less than 2%. The sign of the shift depends on the field orientation and on the substituent, which agrees well with the results of Hase et al. [25] obtained on pure, Zn- and Si-doped CuGeO3. For pure and Si-doped CuGeO3, the g-factor is found to increase along and to decrease along and , as temperature decreases. For Zn- and Mg-doped CuGeO3 the opposite behavior is observed for the three crystallographic directions.
The inset of Figure 1 shows the variation with temperature of the ESR (twice) integrated intensity as compared to that of the static susceptibility, in the 1.6% Zn-doped CuGeO3 sample. Since both curves can be superimposed, we infer that ESR at X-band cannot distinguish between triplet spins (spin-Peierls contribution) and spins freed by impurities (Curie-Weiss contribution)[15, 28]. We will come back to this point in Sec. V B. A similar investigation carried out on Zn-doped CuGeO3 (up to 5% Zn) on powder samples at high field (between 100 and 400 GHz) by Hassan et al.[26] yields results qualitatively different from the previous investigations at lower frequency (see Ref. [17, 18] and present work). In Ref.[26], the appearance of two distinct powder pattern ESR spectra is interpreted as a separate contribution from the excited spin-Peierls triplet and the Zn-induced moments. Motivated by this apparent paradox, we have investigated the ESR in the paramagnetic phase of a single crystal of CuGeO3 : 5% Zn at 95 GHz and 5 K. Contrary to Ref.[26], we observe for all field directions in the (a, b) plane a single resonance line varying from 2.145 to 2.240, in accordance with our X-band measurements. Thus, we are forced to conclude that the additional ESR powder pattern observed by Hassan et al.[26] is somehow linked to the powdered nature of the investigated samples.
IV Magnetic susceptibility in Ni-doped CuGeO3
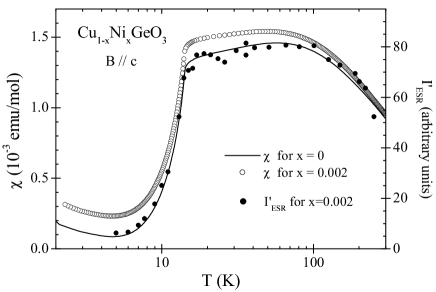
Figure 2 shows the temperature dependence of the magnetic susceptibility measured in pure CuGeO3 and in Cu1-xNixGeO3 samples in the 1.8-300 K temperature range (Fig. 2b) and below 30 K (Fig. 2a).
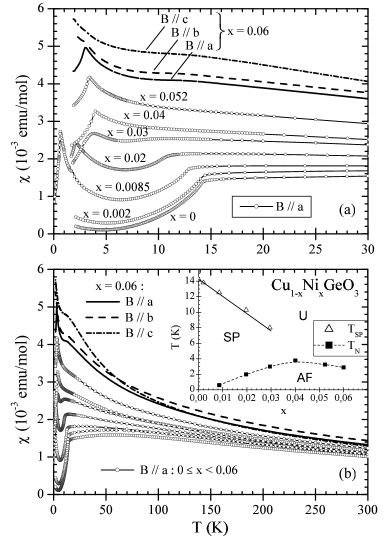
The data from Figure 2a clearly show the decrease of the SP transition (which is visible up to ) and the occurrence of the AF transition at lower temperature, with being the easy axis. Indeed, the susceptibility measured with the external field along the -axis shows a peak, around 3 K for (see solid line), while the susceptibilities measured with the external field along the and axes further increase below 3 K with decreasing temperature (see dash and dash-dot lines). The Ni2+ ion, with , is considered to participate to the long-range magnetic ordering since the magnitude of the Curie tail is one order of magnitude smaller than expected from 6% Ni free spins, indicating that the interaction between the Cu2+ and Ni2+ ions is relatively large. The phase diagram shown in the inset of Fig. 2b was obtained from these measurements. The values of the spin-Peierls and Néel temperatures (when they exist) are given in Table I. For , the susceptibility measurement was performed only down to K, so that the Néel temperature (expected to be smaller than the 0.6 K value obtained for ) could not be determined.
Figure 2b illustrates the large effect of Ni-doping on the global susceptiblity curve, due to the magnetic nature of the Ni2+ ion. Indeed, the susceptibility increases more and more between 300 and 20 K as the Ni concentration increases. Interestingly, the susceptibilities along the and axes become smaller than the one along below 50 K. This anomalous temperature dependence was not observed in Si- and Zn-doped CuGeO3 [11, 15, 30]. This could originate from the single ion anisotropy of Ni2+ ions with along the direction of the distorted oxygen octahedron in the plane, as clearly observed with Mn2+ (Ref. [31]). This will be further discussed in the AFMR results presented in Sec. VI.
The temperature dependence of the susceptibility could be analyzed in the paramagnetic phase ( K) by a crude model of Cu-Ni pairs, neglecting in a first step the single ion anisotropy of Ni2+, yielding an estimate of the Ni-Cu antiferromagnetic exchange coupling of 25 K [15]. This value is to be compared to the strongest Cu-Cu coupling, K along the -axis. The susceptibility data from Figure 2 will be used later on to explain the ESR results.
V ESR in Ni-doped CuGeO3
A Experimental results
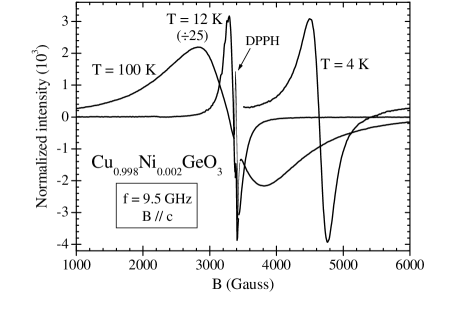
The Ni-doped CuGeO3 samples were investigated at X-band along the three crystallographic directions and at high frequency along the -axis. Figure 3 shows typical ESR spectra obtained in Cu0.998Ni0.002GeO3 ( K) at X-band along the -axis at , 12 and 4 K. Figure 4 shows ESR spectra obtained in Cu0.9915Ni0.0085GeO3 ( K) at 95 GHz along the -axis at , 11 and 7 K. In all Ni-doped compounds, a single lorentzian derivative ESR line was again observed but its linewidth and resonance field behave in a completely different way. Qualitatively, as compared to Fig. 1 for 1.6% Zn-doping, one notices immediately on Fig. 3 for 0.2% Ni-doping (X-band) and Fig. 4 for 0.85% (95 GHz) that a % shift towards high field is already visible in the spectra at 12 and 11 K respectively, compared to those at 100 K. This shift increases to reach 24% at 7 K (Fig. 4) and 36% at 4 K (Fig. 3) which is much larger than the % shift measured in Fig. 1. Moreover, one notes the large broadening induced by Ni-doping: the spectrum measured at 100 K for 0.2% Ni-doping (see Fig. 3) is about three times broader than for 1.6% Zn-doping (see Fig. 1) or pure CuGeO3. This large broadening justifies the use of higher frequencies for further studies of the Ni-doped CuGeO3 samples.
The spectra obtained in X-band ( GHz) correspond to the field derivative of the absorption while those obtained in the millimetric domain ( and 190 GHz) correspond to the field derivative of a combination of the absorption and dispersion . In order to check the lorentzian profile and to extract precisely the integrated intensity (meaningfull at X band only), the linewidth, and the resonance field for each measured spectrum, the data obtained in the X and millimetric domains were fitted to the relation:
| (1) |
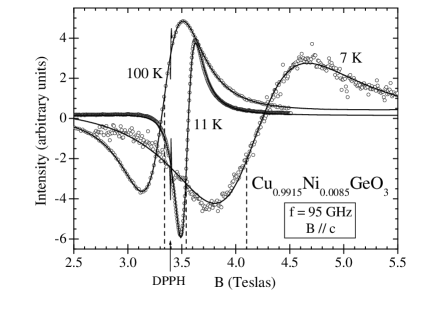
where is a linear function in accounting for the base line, is the phase (equal to zero at X band), and are Lorentzian shape centered at the resonance field , with an integrated intensity and a Lorentzian linewidth . The ”peak to peak” linewidth of the ESR spectra is given by . Figure 4 illustrates the very good quality of the fits to Eq. (1) of a few ESR spectra measured in Cu0.9915Ni0.0085GeO3 at 95 GHz for three different temperatures. Typical precisions are less than 1% on the determination of and less than 0.01% for , the precision on the phase (in the case of the millimetric range) being always better than 1o.
1 Integrated intensity at X band
In the case of X band, the ESR integrated intensity can be compared to the static susceptibility measured with the SQUID magnetometer. ESR spectra were measured in three Cu1-xNixGeO3 samples. For , the ESR line could be followed between 4 and 300 K, but due to the very large broadening induced by Ni-doping, the ESR line could be followed only up to 30 K for and up to 20 K for . All spectra measured for were analyzed using Eq. (1) with and and the ESR (twice) integrated intensity was obtained for each temperature. Due to the strong lineshift induced by Ni-doping, the resonance field must be taken into account and the static susceptibility measured by SQUID has thus to be compared with the following ratio:
| (2) |
where is the resonance field of pure CuGeO3 measured at the same frequency and along the same direction (i.e. corresponding to in the present case where ). Note that in the case of non-magnetic impurities, the static susceptibility was directly compared to since the resonance field varied by less than 2% on the whole temperature range.
Figure 5 displays the temperature dependence of (right scale) compared to the macroscopic susceptibility vs temperature in the same sample () and in pure CuGeO3 (left scale), in a logarithmic scale. The SQUID measurements were performed in a 0.1 T magnetic field applied along the -axis while the ESR measurements were performed in a sweeping field from 0 to 6600 G applied along the same axis. By adjusting the and curves at high temperature, one can note that the ESR integrated intensity follows better the susceptibility of the pure sample than that of the 0.2% Ni-doped sample. This results leads one to suggest that the ESR signal would originate only from the Cu2+ spins of CuGeO3 while the Ni2+ spins would not participate to this resonance line [32].
To check this assumption, the same comparison was performed for a higher Ni-doped sample (). Here again, the static susceptibility vs temperature curves of Cu0.98Ni0.02GeO3 and pure CuGeO3 are compared with the curve derived from the ESR measurements in the same Ni-doped sample. For an easier comparison, the susceptibility data were normalized at 20 K (by dividing for each temperature by K)) and all the curves are plotted as a function of the reduced temperature , with K for and K for (see Fig. 6). Indeed, for such a high Ni-doping level, the spin-Peierls temperatures and the absolute value of the static susceptibility are quite different from the pure sample (see Fig. 2a). By normalizing the susceptibility and ESR data at 20 K, one can notice that the curve lies in between the normalized susceptibilities of pure and Ni-doped CuGeO3.
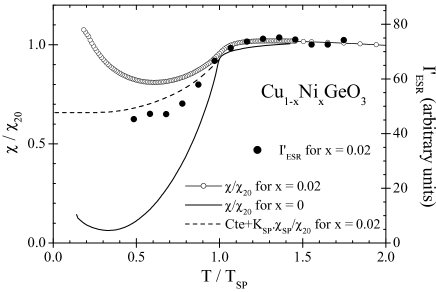
Since it was shown [15, 28] that the amplitude of the SP order parameter (expressed by the fraction ) is reduced in presence of doping (by Ni, Zn, Mg, Si), we have analyzed our data accordingly. In particular, for Cu1-xNixGeO3 with , was found to be equal to 0.465 [15], i.e. only approximately one half of the Cu spins are able to dimerize so that the decrease of is much smaller than for pure CuGeO3. Moreover, the decrease of the energy gap upon doping further amplifies this effect. Thus, our ESR intensity data have to be compared with this (reduced) SP contribution instead of that of the full susceptibility of pure CuGeO3. The dash line from Fig. 6 shows the temperature dependence of this SP contribution (divided by the Cu0.98Ni0.02GeO3 susceptibility at 20 K) normalized at with the curve of the pure sample. One can note the good agreement between this curve and the data. This analysis further supports the idea that the ESR signal only comes from the Cu2+ spins. We will come back to these results when discussing the lineshift results (see Sec. V B). The same study has been performed for a magnetic field applied along the -axis and the results were found to be similar.
2 Linewidth
Besides the large ESR shift, the other main qualitative effect of Ni-doping is a very large broadening of the ESR line as compared to pure CuGeO3. This is further contrasted by the linewidth data of CuGeO3 doped by the non-magnetic impurities Zn, Mg or Si [29]. In Fig. 7a, the low temperature linewidth data are presented at X band for pure CuGeO3 and various Ni-doping levels. It appears that above and up to about 40 K, the linewidth increases linearly with temperature and is approximately proportional to the Ni concentration at a rate of G/%Ni for K and a slope G.K-1/%Ni.
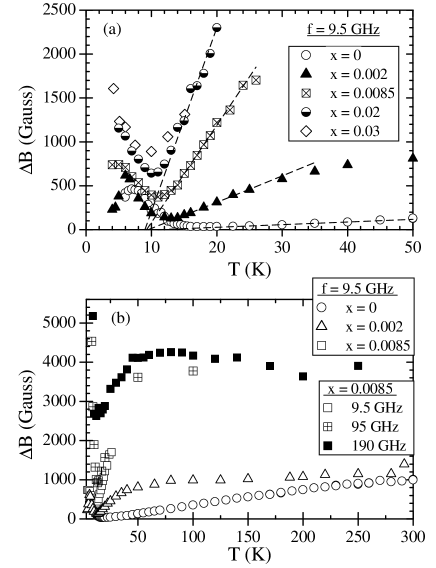
However, as shown in Fig. 7b, contrary to the pure CuGeO3 linewidth data, where the linear temperature dependence extends almost up to room temperature (see also Ref. [21, 22]), the Ni-doped CuGeO3 ESR linewidth reaches a plateau above 50 K independent of both the temperature and the magnetic field. This plateau is proportional to the Ni concentration at a rate G/%Ni. At temperatures lower than , a temperature behavior much closer to that of pure CuGeO3 is observed with a comparable rate of broadening (see Fig. 7a), but now strongly increasing with field (see Fig. 7b). Whereas we cannot account at present for the temperature dependence of the linewidth, the order of magnitude of is discussed in Sec. V B.
3 Lineshift along the c-axis
We now focus on the ESR lineshift , measured for , being the resonance field of the studied sample and the resonance field of pure CuGeO3 (corresponding to ) measured at the same frequency. The aim of the following analysis is to study the field (or frequency), concentration and temperature dependence of the shift in order to derive experimentally an expression of .
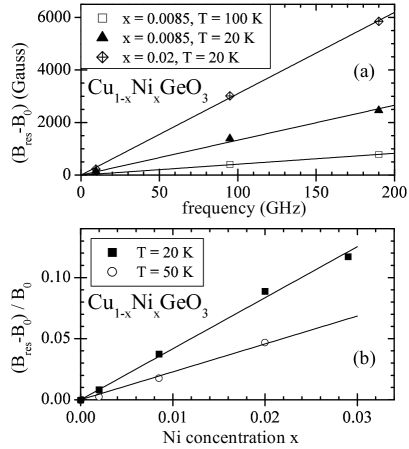
Figure 8a shows the frequency dependence of the lineshift measured for two different samples, 0.85 and 2% Ni-doped CuGeO3, and two different temperatures. This figure shows that the shift is proportional to the working frequency (see solid lines) and thus to , which proves that it is a genuine ”-shift”. This shift increases with and . To study the concentration and temperature dependences, we will thus now refer to the frequency-independant relative shift . Figure 8b shows the Ni concentration dependence of at two given temperatures, and 50 K (data from various frequencies were combined together to obtain this figure). For both temperatures, the relative shift is proportional to the Ni concentration, up to 3% (see solid lines). At this stage, we thus have the relation:
| (3) |
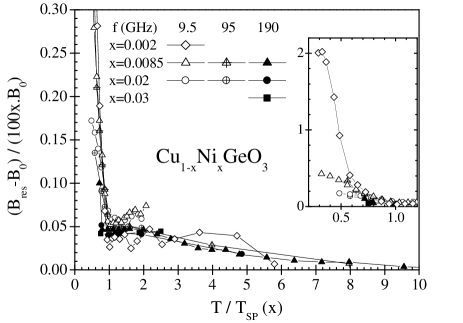
All our experimental results about the lineshift are gathered in Figure 9 using the above relation, i.e. the relative lineshift normalized to the Ni concentration is plotted as a function of the reduced temperature . This figure shows the good agreement of relation (3) with our data. All the experimental points are roughly on a unique curve , at least above . Below the spin-Peierls temperature, the temperature dependence of depends on the Ni-doping level. Indeed, the data at 9.5 and 95 GHz are well superimposed down to 0.7 for both samples with and , but the increase at lower temperature is stronger as the Ni concentration decreases (see inset of Fig. 9).
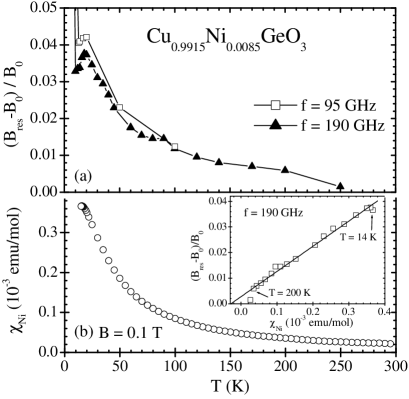
Thus, in order to study in detail the temperature dependence of the shift, we consider separately the paramagnetic (P) and SP phases. The temperature dependence of the relative shift in the 0.85% Ni-doped sample is illustrated for two different frequencies in Figures 10a for and 11a for . Between 300 and 20 K, increases up to 4% (see Fig. 10a) and its temperature dependence behaves like the nickel susceptibility (see Fig. 10b). The latter has been derived by subtracting the susceptibility of pure CuGeO3 to that of the Ni-doped sample (both presented in Fig. 1b). The inset of Figure 10b shows that is strictly proportional to in the P phase.
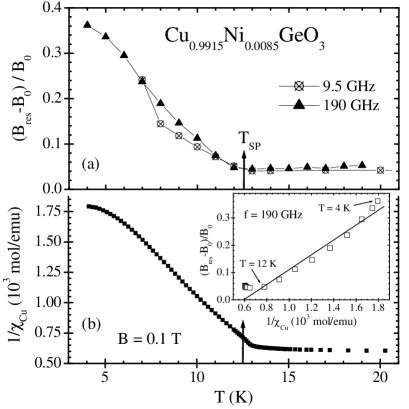
Concerning the low temperature part, one can notice a strong enhancement of the line shift below 12.5 K at 9.5 and 190 GHz (see Fig. 11a). This temperature corresponds to the SP transition, thus this behavior is mainly related to the dimerization of the Cu ions into states. Figure 11b illustrates the temperature dependence of the inverse of the Cu-dimers susceptibility (spin-Peierls contribution in the triplet state ) , which was obtained by subtracting a Curie-Weiss contribution (coming from the Ni ions) to the total susceptibility[15]. As can be seen in the inset of Figure 11b, varies linearly with . This analysis of the data leads to the following relation for the relative shift:
| (4) |
For the same reason as for the integrated intensities (decrease of the fraction when x increases), this formula is indeed consistent with the inset of Fig. 9 where the relative shift below shows a fourfold increase as the Ni doping level decreases from 0.85% to 0.2%.
4 Anisotropy of the lineshift
The anisotropy of the lineshift has also been carefully studied at X-band in the 0.2% Ni-doped compound at 4 K, in the and planes (see Fig. 12).
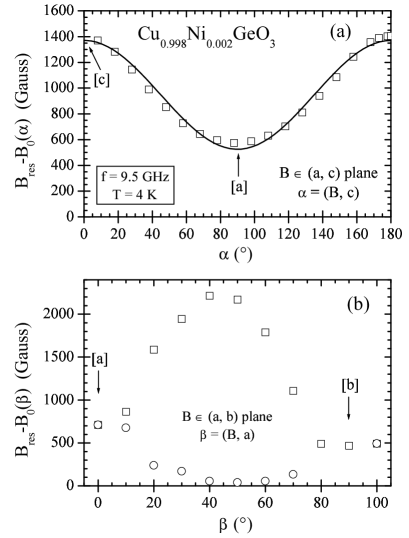
The shift was found to be very anisotropic in both planes and a second, less intense, resonance line was observed in the plane. In the plane, the shift is maximum along ( 1400 Gauss) and minimum along ( 600 Gauss), following with and Gauss. In the plane, the shift is minimum and equivalent along the and axes while a maximum shift (2200 Gauss) is found at (where is the angle between the applied magnetic field and the -axis) possibly reflecting the anisotropy of the Cu to the Ni site coupling. Note that the anisotropy of the lineshift along the crystal axes follows that of the static susceptibility (see Fig. 2b for the 6% Ni-doped CuGeO3 sample).
B Resonance Model
The model used to interpret the ESR data of CuGeO3 doped with Ni at very low concentrations is constrained by the above mentioned experimental observations which we briefly recall:
i- At all temperatures, along the , , and directions, only one Lorentzian shaped (except at the lowest temperature) ESR line is observed, above and below the spin-Peierls transition, which we attribute to the paramagnetic Cu2+ spins above and to the excited triplet Cu2+ spins below .
ii- No resonance consistent with Ni2+ in a distorted octahedral site is observed in the temperature range K, neither at 9.5 GHz nor up to 190 GHz and 10 Tesla.
iii- The ESR integrated intensity, normalized to the resonance field, does not scale with the static susceptibility measured in the same Ni-doped sample, but only to the proportion of Cu spins being in the SP triplet state, which supports i-.
iv- The width of the Cu2+ resonance strongly increases with the Ni concentration (at a rate of 0.1 Tesla/% Ni at 20 K).
v- A resonance shift of the Cu2+ line towards higher fields, proportional to the concentration of the Ni2+ ions, is observed, above and below the spin-Peierls transition. This shift is proportional to the Ni ions susceptibility and inversely proportional to the Cu ions susceptibility. This shift thus becomes particularly noticeable below the SP transition. The shift is anisotropic, being roughly twice as large for the -direction as for the and directions, which are about equivalent: it appears then that this shift is not related to the factor anisotropy of the pure CuGeO3 system (, , ).
A very detailed investigation of a two coupled paramagnetic spins system, present in RbMnF3 doped with Ni, Co or Fe, has been performed by Gulley and Jaccarino[33]. For 1 to 5% Ni-doping, contrary to the present work, no discernable linewidth broadening together with a small -shift of 0.5% are observed. This situation was quantitatively analyzed in terms of very strongly exchange-coupled Ni and Mn spins. This is clearly not the case for CuGeO3 : Ni but does apply to the case of CuGeO3 : Zn, Mg or Si. Indeed, in addition to the absence of broadening and to the 1% -shift, the fact that the ESR integrated intensity fits well the static susceptibility constitutes a compelling evidence for the strong coupling between the bulk Cu2+ spins and the Cu2+ spins induced by the non magnetic impurities.
The model used for our interpretation is an extension of Kittel’s analysis for the ferrimagnetic resonance shift in the presence of strongly relaxing rare earth dopants [34]. Indeed the coupling K of the Cu2+ spins along each of the two (non equivalent [24]) 1D chains of CuGeO3 is strong enough to ensure a single, exchange-narrowed mode in presence of an antiferromagnetic coupling (induced on its two Cu2+ first nearest neighbors) by a Ni2+ spin. In order to account for our observation of a single resonance line, we are forced to assume that (i) either the relaxation rate of the Ni2+ spin is sufficiently large, compared to , to decouple the Ni2+ spins from the precession of the Cu2+ spins or that (ii) this decoupling occurs through a sufficiently large zero-field splitting removing the Ni2+ resonance away from the Cu2+ resonance. In that case, we can modelize the spin dynamics of CuGeO3:Ni by two coupled Bloch-like equations, one for the tightly coupled together Cu2+ spin system (magnetization ) and one for the fast relaxing Ni2+ spins (magnetization ). For sake of simplicity we will assume that the gyromagnetic ratio so that the decoupling occurs only through the relaxation rate of the Ni2+ spins. The coupled equations are then written with the notation: the Cu spin-lattice relaxation rate, the Ni spin-lattice relaxation rate, and the Cu/Ni spin-spin cross relaxation rates between Cu and Ni (related by , i.e. the ratio of the equilibrium magnetizations, by detailed balance [35]).
| (5) | |||||
| (6) |
Solving for the transverse components as usual leads to the determinant:
| (7) |
with
| (8) | |||||
| (9) | |||||
| (10) | |||||
| (11) |
where is the unshifted resonance frequency. In the limit of we get [36]:
| (12) |
This yields indeed a Cu2+ resonance shifted to higher fields if i.e. an antiferromagnetic coupling from Ni2+ to Cu2+, and proportional to the Ni2+ static magnetization . However, a major difference appears between our CuGeO3:Ni model and Kittel’s two sublattice model. In the classical sublattice spin dynamics the coupling constant represents the exchange energy density, through , meaning that every spin A is coupled to every spin B. In our case, we want to specify that the Ni spin is coupled to its two first nearest neighbors Cu2+ by and that the effective coupling is the resulting average of the Cu-Ni exchange among the Cu2+ spins (tightly coupled through ). This average coupling occurs however only from those Cu2+ spins which are not condensed into singlets below the spin Peierls transition. Writing that the exchange energy density is identical in both descriptions yields:
| (13) |
where is the fraction of condensed singlets spins i.e. the spin-Peierls order parameter and is the number of Cu ions per unit volume. The shift is then given by:
| (14) |
Thus, Eq.(14) indeed predicts the observed dependence for the lineshift (see Eq.(4)). The merit of this formulation is that we use the same argument above and below . The above equation can be rewritten (in the P phase) in terms of our measured quantities to yield by:
| (15) |
The term between brackets is depicted in the inset of Fig. 10b. We find K where the error is estimated from the spread of the data at various and frequencies. This value for was checked to be quite consistent with the weak coupling approximation. However this value is three times larger than the one obtained above (§IV) from the fit to the static susceptibility. We think that the value of derived from the ESR data is closer to the truth since the zero field splitting of the Ni2+ ion was not incorporated in the susceptibility analysis: This parameter is a priori not required in the ESR model since Ni2+ is considered as ”non resonant”.
As concerns the linewidth, a direct application of the weak coupling exchange broadening calculated by Gulley and Jaccarino (equation (2.12) from Ref. [33]) with 150 K and 75 K yields a temperature independant broadening of 8000 G/% Ni, to be compared with 4600 G/% Ni observed between 50 and 300K.
VI Antiferromagnetic resonance in Ni-doped CuGeO3
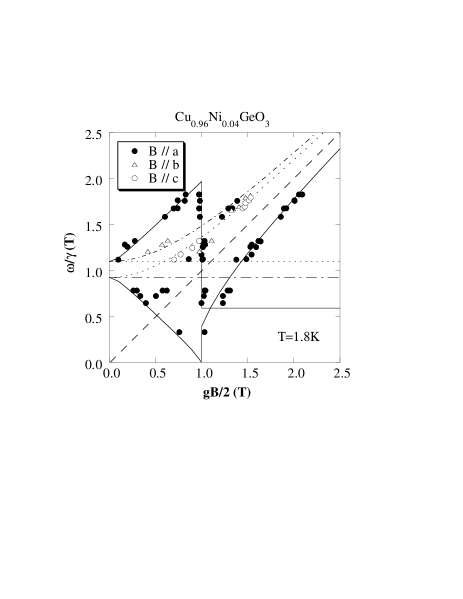
Typical AFMR signals measured in the sample at 1.8 K in a field applied along the , , and axes are shown in Fig. 13. Five ESR lines were observed at 21.87 GHz for . The lines at 0.3, 1.2 and 1.5 T correspond to AFMR lines. The line at 0.75 T originates from a standard DPPH (1,1-diphenyl-2-picrylhydrazyl) sample. The line at 0.7 T probably corresponds to an Electron Paramagnetic Resonance (EPR) signal from the sample. For and , one ESR line, which corresponds to an AFMR signal, was observed around 47.5 GHz. The EPR signal which was observed along the -axis in the AF ordered state was not observed for these two field directions[37]. This is consistent with the recent theory [38] which predicts the existence of an EPR signal even in the ordered phase when the external field is applied parallel to the easy axis.

From the AFMR results, we can identify the easy, second-easy, and hard axes as the , , and axes, respectively, as will be shown below. The angular dependence of the resonance fields at X band was also measured. Resonance points around 0.9 T show a minimum when the field is parallel to the -axis. From this result we confirmed that the spins point along the -axis within an experimental error of , which had not clearly been determined by the susceptibility [20] and the neutron scattering measurements [9]. We also performed AFMR measurements in the sample at K. The AFMR signals are less clear mainly due to the lower . However, it was found that the magnetic anisotropy is the same as in the sample.
Figure 14 shows the frequency vs magnetic-field plot of the resonance points at 1.8 K. Here, the angular frequency () is divided by (: Bohr magneton, : Planck’s constant) to express it in magnetic field units and is scaled by the value for the respective field directions. The values we used are, , , and , which are 80 of the values in pure CuGeO3 and are also consistent with those obtained from the ESR measurements at K.
| (K) | (T2) | (T2) | ||
|---|---|---|---|---|
| Si (2)a | 4.8 | 1.30.1 | 3.80.2 | 0.780.06 |
| Zn (4)b | 4.2 | 0.89 | 2.1 | 0.85 |
| Ni (4) | 4.0 | 0.85 | 1.2 | 0.90 |
The data were analyzed with the AFMR theory for a two-sublattice antiferromagnet with orthorhombic anisotropy [39]. This theory was used in analyzing Zn- [17, 18] and Si-doped samples [19], and is conveniently reviewed in Ref. [40]. We obtained the parameters (=) = 0.85 (T2), (=) = 1.2 (T2), and (=) = 0.90, where , ( and 2), , and are the molecular field coefficient, the anisotropy constants, the susceptibilities along the easy axis and perpendicular to it, respectively. The lines in Fig. 14 are fits with the classical AFMR theory. The parameter obtained with AFMR measurements is similar to those in Cu0.96Zn0.04GeO3 [17, 18] and CuGe0.98Si0.02O3 [19] as shown in Table II but is much larger than that obtained from the magnetic susceptibility measurements (). The susceptibility parallel to the -axis of Cu0.96Ni0.04GeO3 does not go to zero with decreasing temperature below as shown in Fig. 2a. This is quite different from what a classical theory of antiferromagnetism predicts for . We found that the measured can be interpreted as a sum of a paramagnetic susceptibility which obeys the Curie law and an antiferromagnetic one. The amount of the paramagnetic ”centers” is estimated to be about 1% of the total spins assuming and . The antiferromagnetic susceptibility decreases with decreasing temperature more rapidly than , thus giving a larger value for .
We now discuss the origin of the magnetic anisotropy in Ni-doped CuGeO3. In order to explain this, we consider three terms; single ion anisotropy (), dipole-dipole (), and anisotropic exchange () energies. Moriya and Yosida discussed theoretically the origin of the anisotropy in CuCl2H2O.[41] They considered both of and terms (note that no term is possible for Cu2+ spin). They estimated cm-1/ion and cm-1/ion, respectively. Although the crystal structure of CuGeO3 is different from that of CuCl2H2O, we expect that the value of in CuGeO3 is not very much different from the one given above. For in CuGeO3, we estimate a ten times larger value, because the exchange interaction is about ten times larger than for CuCl2H2O. On the other hand, cm-1/ion for Ni2+ (Ref. [42]) so that even a small amount of doping will change drastically the anisotropy of the system. The value and the single ion anisotropy constant, , for Ni2+ in an axially distorted octahedral environment are related to the spin-orbit coupling and to the crystal field levels. In the well documented case of trigonal elongation of the octahedron, as in CsNiF3[43], this distorsion leads to (and g⟂(Ni)(Ni)). In contrast, in the case of CuGeO3, one expects an elongation to yield similar to the Tutton salts[44] and hence give rise to an easy local axis. Here, we denote the single ion anisotropy term as .
The easy axis for Ni2+ spin in CuGeO3 lies in the plane and is directed alternately when one moves from one site to the other along the -axis. Because of the antiferromagnetic interaction, the spins will point either close to the -axis or the -axis with antiferromagnetic arrangement along the -axis, the former being favoured by . Thus, the mean easy axis is the -axis. Then the easy and second easy axes in Zn- and Si-doped samples are interchanged in the Ni-doped sample.
The and values for various impurity-doped CuGeO3 are summarized in Table II. and correspond to the geometric mean of the exchange field and anisotropy fields along the second-easy and the hard axes, respectively. It is noted that the two parameters are very close in the Ni-doped sample. The parameter is related to the anisotropy when one rotates the magnetic moments from the to axes in CuGeO3:Zn and from the to axes in CuGeO3:Ni. In the Zn-doped sample, one loses both of and for this rotation, while in the Ni-doped sample, and a part of are lost ( in the plane is less anisotropic because and are nearly equal). So, in the Ni-doped sample is smaller than that in the Zn-doped sample. Consequently, and become closer in the CuGeO3:Ni sample.
VII Conclusion
We have presented in this paper a systematic study of the spin resonance properties of CuGeO3 in the paramagnetic, spin-Peierls and antiferromagnetic regimes, when doped with Ni, and compared these new results with previously obtained ESR data on CuGeO3 doped with non-magnetic impurities such as Zn, Mg or Si. The main conclusions that we are able to draw are the following:
1- Whereas the investigation of the static susceptibility of doped CuGeO3 enables us to define a universal behavior, in the proper reduced units, for the appearance of the paramagnetic, spin-Peierls and antiferromagnetic phases in the Temperature-Concentration diagram, at least two different regimes exist as concern the ESR properties, depending whether the doping atom is magnetic or not.
2- In the case of non-magnetic doping, the resulting Cu2+ moments responsible for the Curie tail observed below the spin-Peierls temperature are in strong coupling regime with the spin-Peierls excited triplet, resulting in an unshifted ESR line and a -direction easy axis in the AFMR analysis.
3- In presence of doping with Ni2+, a weak coupling is found from the analysis of the measured large shift of the Cu2+ ESR, both in the paramagnetic and the spin-Peierls regimes.
4- However, in order to account for the AFMR -easy axis in the latter case, one has to assume that the Ni2+ ions do participate to the AFMR mode. The origin of the anisotropy in that case is the single ion anisotropy of the Ni2+ rather than the anisotropic exchange present for pure and (non-magnetic) doped CuGeO3.
5- Although each of these different regimes can be consistently parameterized in a quantitative way, a general description of the dynamics of the transverse spin susceptibilities of doped spin-Peierls compounds is still an open question.
VIII Acknowledgments
We thank A. K. Hassan for helpfull discussions and for the high field EPR of CuGeO3:Zn single crystals. This work was partially supported by the ”MR Science Research Program” from RIKEN. We would like to thank M. Tokunaga for his help in the AFMR measurement. The Institut d’Electronique Fondamentale and Laboratoire de Physico-Chimie de l’Etat Solide are Unités Mixtes de Recherche CNRS: UMR 8622 and UMR 8648, respectively.
REFERENCES
- [1] Present address: Advanced Science Research Center, Japan Atomic Energy Research Institute, Tokai, Ibaraki 319-1195, Japan.
- [2] Also at RIKEN Harima Institute, Mikazuki, Sayo, Hyogo 679-5148, Japan.
- [3] M. Hase, I. Terasaki, and K. Uchinokura, Phys. Rev. Lett. 70, 3651 (1993).
- [4] J.-P. Pouget, L.-P. Regnault, M. Ain, B. Hennion, J.-P. Renard, P. Veillet, G. Dhalenne, and A. Revcolevschi, Phys. Rev. Lett. 72, 4037 (1994).
- [5] M. Hase, I. Terasaki, Y. Sasago, K. Uchinokura, and H. Obara, Phys. Rev. Lett. 71, 4059 (1993).
- [6] M. Hase, Y. Sasago, K. Uchinokura, G. Kido, and T. Hamamoto, J. Magn. Magn. Mater. 140-144, 1691 (1995).
- [7] S. B. Oseroff, S.-W. Cheong, B. Aktas, M. F. Hundley, Z. Fisk, and L. W. Rupp, Jr., Phys. Rev. Lett. 74, 1450 (1995).
- [8] J. G. Lussier, S. Coad, D. F. McMorrow, and D. McK Paul, J. Phys.: Condens. Matter 7, L325 (1995).
- [9] S. Coad, J.-G. Lussier, D. F. McMorrow, and D. McK Paul, J. Phys.: Condens. Matter 8, 6251 (1996).
- [10] T. Masuda, A. Fujioka, Y. Uchiyama, I. Tsukada, and K. Uchinokura, Phys. Rev. Lett. 80, 4566 (1998).
- [11] J.-P. Renard, K. Le Dang, P. Veillet, G. Dhalenne, A. Revcolevschi, and L.-P. Regnault, Europhys. Lett. 30, 475 (1995).
- [12] L.-P. Regnault, J.-P. Renard, G. Dhalenne, and A. Revcolevschi, Europhys. Lett. 32, 579 (1995).
- [13] Y. Sasago, N. Koide, K. Uchinokura, M. C. Martin, M. Hase, K. Hirota, and G. Shirane, Phys. Rev. B 54, R6835 (1996).
- [14] H. Fukuyama, T. Tanimoto, and M. Saito, J. Phys. Soc. Jpn. 65, 1182 (1996).
- [15] B. Grenier, J.-P. Renard, P. Veillet, C. Paulsen, G. Dhalenne, and A. Revcolevschi, Phys. Rev. B 58, 8202 (1998).
- [16] M. Hase, K. Uchinokura, R. J. Birgeneau, K. Hirota, and G. Shirane, J. Phys. Soc. Jpn. 65, 1392 (1996).
- [17] M. Hase, M. Hagiwara, and K. Katsumata, Phys. Rev. B 54, R3722 (1996).
- [18] P. Fronzes, M. Poirier, A. Revcolevschi, and G. Dhalenne, Phys. Rev. B 56, 7827 (1997).
- [19] H. Nojiri, T. Hamamoto, Z. J. Wang, S. Mitsudo, M. Motokawa, S. Kimura, H. Ohta, A. Ogiwara, O. Fujita, and J. Akimitsu, J. Phys.: Condens. Matter 9, 1331 (1997).
- [20] N. Koide, Y. Sasago, T. Masuda, and K. Uchinokura, Czechoslovak J. Phys. 46, 1981 (1996).
- [21] S. Oseroff, S-W. Cheong, A. Fondado, B. Aktas, and Z. Fisk, J. Appl. Phys. 75, 6819 (1994).
- [22] I. Yamada, M. Nishi, and J. Akimitsu, J. Phys.: Condens. Matter 8, 2625 (1996).
- [23] M. Honda, T. Shibata, K. Kindo, S. Sugai, T. Takeuchi, and H. Hori, J. Phys. Soc. Jpn. 65, 691 (1996).
- [24] B. Pilawa, J. Phys.: Condens. Matter 9, 3779 (1997).
- [25] M. Hase, J. Magn. Magn. Mater. 177-181, 611 (1998).
- [26] A. K. Hassan, L. A. Pardi, G. B. Martins, G. Cao, and L.-C. Brunel, Phys. Rev. Lett. 80, 1984 (1998).
- [27] V. N. Glazkov, A. I. Smirnov, O. A. Petrenko, D. M. K. Paul., A. G. Vetkin, and R. M. Eremina, J. Phys.: Cond. Mat. 10, 7879 (1998).
- [28] B. Grenier, J.-P. Renard, P. Veillet, C. Paulsen, R. Calemczuk, G. Dhalenne, and A. Revcolevschi, Phys. Rev. B 57, 3444 (1998).
- [29] Among the twelve investigated samples (doped with 1.6, 3.9 and 10% Zn, 1, 3 and 5% Mg, 0.2, 0.7, 0.85, 1.5, 6 and 8.5% Si), the linewidth was found to be always the same as in pure CuGeO3 except for the 0.7% Si- and 3.9% Zn-doped samples, where a temperature independent constant broadening (of 200 Gauss along and , 400 G along ) was measured.
- [30] M. Hase, N. Koide, K. Manabe, Y. Sasago, K. Uchinokura, and A. Sawa , Physica B 215, 164 (1995).
- [31] B. Grenier and P. Monod, to be published.
- [32] Note that the results from the 0.2% Ni-doped sample and the pure one can be directly compared on the same scale since the spin-Peierls temperatures are very close to each other (see Table I).
- [33] J. E. Gulley and V. Jaccarino, Phys. Rev. B 6, 58 (1972).
- [34] C. Kittel, Phys. Rev. 115, 1587 (1959).
- [35] S. E. Barnes, Adv. Phys. 30, 801 (1981).
- [36] In Kittel’s paper, due to the particular form of the damping specific to ferrimagnetic materials, a special case of strong coupling in presence of infinite relaxation rate is obtained. This results in a shift which is independent from the coupling contrary to Eq. (12) of the present work. The latter is simply related to the ”unbottleneck” situation.
- [37] This fact shows that this EPR line cannot be attributed to free Cu spins (see for instance M. Hagiwara, K. Katsumata, I. Yamada, and H. Suzuki, J. Phys.: Condens. Matter 8, 7349 (1996)). However, we note that the 0.5 T linewidth of the 3.2% Ni sample used by Glazkov et al. (Ref. [27] Fig. 3) precludes a detailed comparison with the present results obtained on high quality samples (0.2 T linewidth).
- [38] A. Ogasahara and S. Miyashita, J. Phys. Soc. Jpn 69, 4043 (2000).
- [39] T. Nagamiya, K. Yosida, and R. Kubo, Adv. Phys. 4, 1 (1955).
- [40] K. Katsumata, J. Phys.: Condens. Matter 12, R589 (2000).
- [41] T. Moriya and K. Yosida, Prog. Theor. Phys. 9, 663 (1953).
- [42] A. Abragam, B. Bleaney ”Electron paramagnetic resonance of transition ions”, Clarendon Press. Oxford, p. 450 (1970).
- [43] see for instance, C. Dupas and J.-P. Renard, J. Phys. C: Solid State Phys. 10, 5057 (1977).
- [44] J. H. E. Griffiths and J. Owen, Proc. Roy. Soc. A 213, 459 (1952).