[
Micro-Hall Magnetometry Studies of Thermally Assisted and Pure Quantum Tunneling in Single Molecule Magnet Mn12-Acetate
Abstract
We have studied the crossover between thermally assisted and pure quantum tunneling in single crystals of high spin () uniaxial single molecule magnet Mn12-acetate using micro-Hall effect magnetometry. Magnetic hysteresis experiments have been used to investigate the energy levels that determine the magnetization reversal as a function of magnetic field and temperature. These experiments demonstrate that the crossover occurs in a narrow ( K) or broad ( K) temperature interval depending on the magnitude and direction of the applied field. For low external fields applied parallel to the easy axis, the energy levels that dominate the tunneling shift abruptly with temperature. In the presence of a transverse field and/or large longitudinal field these energy levels change with temperature more gradually. A comparison of our experimental results with model calculations of this crossover suggest that there are additional mechanisms that enhance the tunneling rate of low lying energy levels and broaden the crossover for small transverse fields.
Keywords: Single-Molecule Magnets; High-Spin Clusters; Quantum Tunneling; Hysteresis; Hall-Effect Magnetometry
]
High spin single molecule magnets Mn12-acetate (Mn12) and Fe8 have been actively studied as model systems for the behavior of the mesoscopic spins [4, 5, 6, 7, 8, 9, 10, 11, 12, 13, 14, 15]. These materials can be considered as monodisperse ensembles of weakly interacting particles with net spin and strong uniaxial anisotropy. They enable studies of both classical and quantum effects through macroscopic magnetic measurements. These clusters show enhanced relaxation of magnetization at regular intervals of magnetic field, attributed to the tunneling of magnetization across the anisotropy barrier [5, 6].
The temperature dependence of this process suggests that both classical thermal activation and quantum tunneling are important [8]. Other significant recent experimental results on single molecule magnets include observation of non-exponential relaxation of magnetization [6] and quantum phase interference in Fe8 [10]. Spectroscopic experiments (EPR and inelastic neutron scattering) have provided important information about the magnetic energy levels of Mn12 and Fe8, relevant to understanding their macroscopic magnetic response [11, 12, 13, 14, 15].

Experimental results, such as the series of regular steps in magnetic hysteresis curves of these materials, have been interpreted within an effective spin Hamiltonian for an individual cluster:
| (1) |
where the uniaxial anisotropy parameters and have been determined by EPR [13] and inelastic neutron spectroscopy experiments [14] ( K, K, and is estimated to be ). Here includes terms which do not commute with and produce tunneling. These mechanisms of level-mixing may be due to a transverse field (such as hyperfine, dipolar fields or an external field, contributing terms like ) or higher order transverse anisotropies, for example , K [14], which is the lowest order term allowed by the tetragonal symmetry of the Mn12 crystal. The enhanced relaxation of the magnetization at certain field values is ascribed to thermally assisted tunneling (TAT) or pure quantum tunneling (QT) (see Fig. 1). In the TAT regime the relaxation occurs by tunneling from thermally excited magnetic sublevels (), when two levels on the opposite sides of the anisotropy barrier are brought close to resonance by the magnetic field. From the unperturbed Hamiltonian (1) the longitudinal (-axis) field at which the levels and become degenerate is:
| (2) |
where is the step index describing the bias field, and is a constant ( T). Direct numerical diagonalization of the spin Hamiltonian (1) shows that the small transverse anisotropy term does not significantly change these resonance fields. Note that a larger magnetic field is necessary to bring lower lying sublevels into resonance. As the temperature decreases, the thermal population of the excited levels is reduced, and these states contribute less and less to the tunneling. Consequently, the steps in hysteresis curves shift to higher bias field values, and steps with larger become observable. At low temperature, the tunneling from the ground state dominates, and the position and amplitude of the steps become independent of temperature, denoted the QT regime.
At any temperature the magnetic relaxation rate is dominated by the contribution of only few (one or two) magnetic sublevels. This is because the relaxation rate is the product of the thermal occupation probability and the tunneling rate. The probability of thermal occupation decreases exponentially with energy, while the tunneling probability increases exponentially approaching one at the top of the anisotropy barrier. Therefore the relaxation rate has a sharp maximum at the dominant level or levels.
Recent theoretical models suggest that in the large spin limit a crossover between thermal activation and quantum tunneling can either occur abruptly, in a narrow temperature interval, or gradually, in a broader temperature interval [16, 17, 18]. In the first case the energy at which the system crosses the anisotropy barrier shifts abruptly with temperature from a value close to the top of the barrier to the lowest lying level in the metastable well (denoted a first-order crossover). In the second case this energy changes smoothly with temperature (second-order) [19]. The “phase diagram” for this crossover depends on the form of the spin Hamiltonian, particularly the terms important for tunneling. In finite spin systems the crossover is always smeared, nevertheless the two types of the crossovers can be distinguished experimentally. In the first-order crossover there are competing maxima in the relaxation rate versus energy and the global maximum shifts abruptly from one energy to the other as a function of temperature. In the second-order case a single maximum in the relaxation rate shifts continuously with temperature. Recent experiments have shown that in Mn12 the crossover occurs in a narrow temperature interval when the applied field is parallel to the easy axis of the sample [21]. In contrast, experiments on Fe8 suggest a second-order crossover [22].
In this paper we show that in Mn12 both types of the crossover can be experimentally observed when the applied field has a transverse component. A transverse magnetic field makes the crossover more gradual and leads to a continuous shift in the dominant energy levels (i.e., a second-order crossover) [23]. We show that these levels can be identified by hysteresis experiments and their behavior as a function of temperature can be studied in order to test the tunneling model described above.
Our experiments have been conducted using a micro-Hall-effect magnetometer [24] in a high field 3He system. Single crystals of Mn12 in the shape of parallelepipeds m3 were synthesized as described in Ref. [25]. A crystal was encapsulated in thermally conducting grease and the temperature was measured with a calibrated carbon thermometer a few millimeters from the sample. The angle between the easy axis of the crystal and the applied magnetic field was varied by rotating the sample in a superconducting solenoid.
In our hysteresis experiments the sample was initially saturated (), then the field was ramped at a constant rate ( T/min) towards positive saturation. Hysteresis curves show steps and plateaus, separated by a field interval of approximately T, in agreement with previously published results. Figure 2 shows a plot of the derivative of the magnetization versus the applied field for measured at different temperatures.
The positions and structure of the peaks in show the magnetic fields at which there are maxima in the magnetization relaxation rate at a given temperature, applied field and magnetization. The dashed lines mark the positions of the three observed peaks showing their shift with temperature. The peak that occurs at the lowest magnetic field shifts gradually from T to T (by ) as the temperature decreases from K to K, that can be identified as the TAT regime.
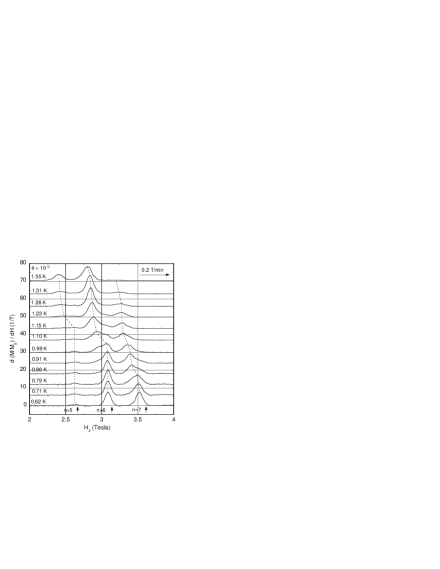
As the temperature is reduced from K to K, this maximum is shifted abruptly to T (i.e., by ) and remains approximately at the same value upon further decrease of temperature to K. The middle peak also shifts gradually from T to T in the interval between K to K, but it then shifts abruptly between K and K, at lower temperature than the previous maximum. Below K the position of this peak also remains constant. We attribute this temperature independent regime to the pure QT. Assuming that at the lowest temperature only the ground state participates in tunneling, we can identify the positions of the observed peaks by the resonance field values , , , and , calculated according to Eq. (2), from low to high magnetic field. The peaks labeled and show an abrupt crossover between TAT to QT, which occurs in an interval of approximately K. In contrast to and peaks, the peak shifts to higher field (from T to T) step-wise in the whole studied temperature interval ( K). We consider the crossover to QT in this case as gradual (second-order).
Peak positions as a function of temperature, obtained from hysteresis experiments performed as described above, are summarized in Fig. 3. This plot shows the values of the longitudinal field, at which the maxima in occur, versus temperature for the four studied angles, , , , and . The peak positions were corrected for the effects of the internal field as described in Ref. [23]. The bars on the left hand side of the figure show the escape levels calculated using Eq. (2), with parameters from spectroscopic data [13, 14].

Analyzing this graph, we can make following observations. First, for larger angles, and therefore higher transverse field, peaks with lower indices (i.e., lower ) can be observed in the experimental time window. The lowest step observed for and is , for it is , for it is . This is consistent with the idea that the transverse field promotes tunneling and lowers the effective anisotropy barrier. We find that there is greater amplitude in lower lying peaks as the transverse field is increased. Second, two regimes can be distinguished: the high temperature regime, where the peaks gradually shift to higher fields with decreasing temperature, and the low temperature regime, where the peak positions are constant. We associate the first regime with the TAT and the second with pure QT. Third, the form of the crossover between these two regimes depends on the longitudinal field. For each sample orientation, peaks with lower indices show a more abrupt crossover between TAT and QT than peaks with higher indices (compare peaks and for and , or and for , or and for ).
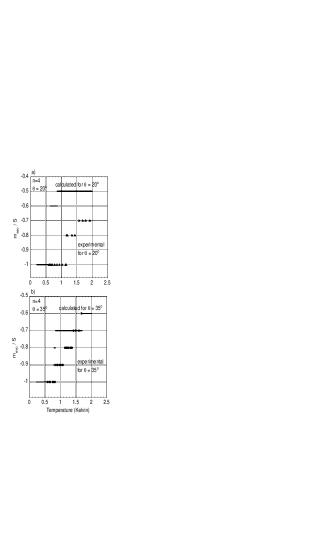
The experimentally determined escape levels can be compared to models [16, 17, 26]. As mentioned above, the relaxation rate can be written as a product of the tunneling rate between the pair of levels and , split by the energy , and the Boltzmann factor: ), where is the average energy of levels and above the lowest lying state in the metastable well . The energy level which dominates tunneling is determined as the level for which the tunneling rate has a maximum at a given temperature, longitudinal and transverse field. The tunnel splittings were obtained by numerical diagonalization of spin Hamiltonian (1), whose eigenvalues were determined with high precision [26]. In Eq. (1) the second order uniaxial anisotropy term (i.e., ) was ignored for simplicity and a higher value of ( K) was used so that the low lying energy level spacing and overall barrier height is better approximated. Figure 4 shows experimental positions of the peak at two different angles, (Fig. 4(a)) and (Fig. 4(b)) compared to the calculated . Calculations were performed using a Mathematica program for constant values of the longitudinal and transverse magnetic field corresponding to , and .
First consider the data. A few major discrepancies between the calculated and experimental results can be noticed. The experimental crossover temperature is higher than the calculated one ( K versus K). Also the experimental temperature interval in which the crossover occurs is larger than predicted by the model. Experimental escape levels involved in the crossover () are lying lower in the potential well than the calculated ones (). The observed escape levels change more gradually than predicted by the model: our observations show that none of the levels are skipped in the crossover, while the calculations show that as many as three levels () do not contribute significantly to the relaxation. Based on this comparison we conclude that there are additional mechanisms, such as transverse anisotropy, that enhance the tunneling rate of low lying levels. For the crossover is more gradual than for , in qualitative agreement with the theoretical model. As in the case, experimental data show that lower lying levels ( and ) are active over larger intervals of temperature than predicted by the model. The overall better agreement with the calculated data in this case suggests that a large enough applied transverse field can become a dominant factor in determining the tunnel splittings.

It is important to note that in our hysteresis experiments, in which the field is increasing, relaxation will first occur from thermally excited states because these come into resonance first (Eq. (2)). Therefore our data on Figures 3 and 4 somewhat underestimate the crossover temperature.
To show this we have performed a series of minor loop hysteresis experiments near the crossover temperature. In these experiments the field was swept at a constant rate back and forth across an interval, where a peak in was observed. If the field is ramped towards positive saturation, relaxation from the excited levels is emphasized, if the direction of the sweep is towards lower magnetization, the ground state tunneling is favored. The results of these experiments in which the field was swept across the n=6 peak five times at are shown on Fig. 5. Figure 5(a) shows a typical hysteresis curve at K. Figures 5(b-d) show plots of at three different temperatures. For K (Fig. 5(b)) the maximum in for all sweeps occurs at T, which corresponds to QT from . At a higher temperature, K (Fig. 5(c)) the maximum of the first sweep is at a lower field, T, which can be identified as a thermal channel (). For the sweeps - the maximum occurs at the QT position ( T), which suggests that at this temperature QT still dominates. At higher temperature ( K, Fig. 5(d)) almost all relaxation occurs via a thermal channel at T (), which shows that the crossover to TAT has already taken place. These results show that regular hysteresis experiments emphasize the tunneling from the excited states, and therefore the crossover temperature determined from such experiments is underestimated.
In conclusion, we presented low temperature magnetic hysteresis studies of thermally assisted and pure quantum tunneling in Mn12. The crossover between these two regimes can be either abrupt or gradual. These types of the crossovers are distinguished by the temperature interval within which the escape energy levels shift from thermally excited levels to the lowest state in the metastable well. Through the hysteresis experiments we were able to identify these energy levels and study their behavior as a function of temperature. Our studies indicate that the higher longitudinal and transverse fields make the crossover more gradual. Comparison of our experimental data and theoretical model suggests that in Mn12 there must be additional mechanisms which promote tunneling, such as a transverse anisotropy, which is responsible for broadening the crossover for smaller transverse fields and increasing the tunneling rate from low lying levels. These experiments establish a lower bound on the crossover temperature (Fig. 3), as the standard hysteresis experiments favor relaxation from the excited levels.
We are grateful to Dmitry Garanin for fruitful discussions and help with numerical calculations.
REFERENCES
- [1] louisa@mailaps.org
- [2] andy.kent@nyu.edu
- [3] marc.walters@nyu.edu
- [4] see, E. M. Chudnovsky and J. Tejada, Macroscopic tunneling of the magnetic moment (Cambridge University Press, Cambridge, UK 1997), Chapter 7.
- [5] J. R. Friedman, M. P. Sarachik, J. Tejada, and R. Ziolo, Phys. Rev. Lett. 76, 3830 (1996); L. Thomas, F. Lionti, R. Ballou, D. Gatteschi, R. Sessoli, and B. Barbara, Nature 383, 145 (1996).
- [6] C. Sangregorio, T. Ohm, C. Paulsen, R. Sessoli, D. Gatteschi, Phys. Rev. Lett. 78, 4645 (1997).
- [7] R. Sessoli, D. Gatteschi, A. Caneschi, and M. A. Novak, Nature 365, 141 (1993).
- [8] M. Novak and R. Sessoli, in Quantum Tunneling of Magnetization-QTM’94, ed. by L. Gunther and B. Barbara (Kluwer Publishing, Dordrecht, 1995) p. 171; B. Barbara, W. Wernsdorfer, L. C. Sampaio, J. G. Park, R. Ferré, L. Thomas, C.Paulsen, M. A. Novak, A. Benoit, K. Hasselbach, D. Mailly, R. Sessoli, and A. Cansechi, J. Magn. Magn. Mater. 140-144, 1825 (1995).
- [9] J. M. Hernandez, X. X. Zhang, F. Luis, J. Bartolomé, J. Tejada, and R. Ziolo, Europhys. Lett. 35, 301 (1996).
- [10] W. Wernsdorfer and R. Sessoli, Science 284, 133 (1999).
- [11] S. Hill, J. A. A. J. Perenboom, N. S. Dalal, T. Hathaway, T. Stalcup, and J. S. Brooks, Phys. Rev. Lett. 80, 2453 (1998).
- [12] M. Hennion, L. Pardi, I. Mirebeau, E. Suard, R. Sessoli, and A. Caneschi, Phys. Rev. B 56, 8819 (1997).
- [13] A. L. Barra, D. Gatteschi, and R. Sessoli, Phys. Rev. B 56, 8192 (1997).
- [14] I. Mirebeau, M. Hennion, H. Casalta, H. Andres, H. U. Güdel, A. V. Irodova, and A. Caneschi, Phys. Rev. Lett. 83, 628 (1999).
- [15] Y. Zhong, M. P. Sarachik, J. R. Friedman, R. A. Robinson, T. M. Kelley, H. Nakotte, A. C. Christianson, F. Trouw, S. M. J. Aubin, and D. N. Hendrickson, J. Appl. Phys. 85, 5636 (1999).
- [16] E. M. Chudnovsky and D. A. Garanin, Phys. Rev. Lett. 79, 4469 (1997).
- [17] D. A. Garanin, X. Hidalgo, and E. M. Chudnovsky, Phys. Rev. B 57, 13639 (1998).
- [18] G.-H. Kim, Phys. Rev. B 59, 11847 (1999); G.-H. Kim, Europhys. Lett. 51, 216 (2000); H. J. W. Müller-Kirsten, D. K. Park, and J. M. S. Rana, Phys. Rev. B 60, 6662 (1999), and references therein.
- [19] The analogy to phase transitions is a purely formal one as discussed in [16]. The first-order, second-order terminology for the escape rate crossover is originally due to Larkin and Ovchinnikov [20].
- [20] A. I. Larkin and Y. N. Ovchinnikov, Sov. Phys. JETP 59, 420 (1984).
- [21] A. D. Kent, Y. Zhong, L. Bokacheva, D. Ruiz, D. N. Hendrickson, and M. P. Sarachik, Europhys. Lett. 49, 512 (2000).
- [22] W. Wernsdorfer, R. Sessoli, A. Caneschi, D. Gatteschi, and A. Cornia, Europhys. Lett. 50, 552 (2000).
- [23] L. Bokacheva, A. D. Kent, and M. A. Walters, Phys. Rev. Lett. 85, 4803 (2000).
- [24] A. D. Kent, S. von Molnar, S. Gider, and D. D. Awschalom, J. Appl. Phys. 76, 6656 (1994).
- [25] T. Lis, Acta Cryst. B 36, 2042 (1980).
- [26] D. A. Garanin and E. M. Chudnovsky, Phys. Rev. B 63, 024418 (2001).