Chemical Potential Shift in Nd2-xCexCuO4: Contrasting Behaviors of the Electron- and Hole-Doped Cuprates
Abstract
We have studied the chemical potential shift in the electron-doped superconductor Nd2-xCexCuO4 by precise measurements of core-level photoemission spectra. The result shows that the chemical potential monotonously increases with electron doping, quite differently from La2-xSrxCuO4, where the shift is suppressed in the underdoped region. If the suppression of the shift in La2-xSrxCuO4 is attributed to strong stripe fluctuations, the monotonous increase of the chemical potential is consistent with the absence of stripe fluctuations in Nd2-xCexCuO4. The chemical potential jump between Nd2CuO4 and La2CuO4 is found to be much smaller than the optical band gaps.
pacs:
PACS numbers: 79.60.-i, 74.72.Jt, 71.30.+h, 75.50.EeHigh- superconductivity occurs when the parent antiferromagnetic (AF) insulator with the CuO2 plane is doped with holes or electrons. In the p-type materials, the long-range AF order vanishes for a slight amount of hole doping whereas in the n-type materials, the AF order persists up to a high doping concentration of 0.14 electrons per Cu and the superconducting (SC) doping range is much narrower [1]. The p-type materials show -linear in-plane electrical resistivity [2] and split neutron peaks around indicating incommensurate spin fluctuations [3] whereas the n-type materials show dependence of the in-plane resistivity [4] and commensurate spin fluctuations [5]. In order to elucidate the mechanism of high- superconductivity, it is very important to clarify the origin of the similarities and the differences between the p-type and the n-type materials.
In this Letter, we report on a study of the chemical potential shift in Nd2-xCexCuO4 (NCCO) as a function of doped electron concentration. The shift can be deduced from the core-level shifts in photoemission spectra because the binding energy of each core level is measured relative to the chemical potential . In a previous study [6], we found that in La2-xSrxCuO4 (LSCO) the chemical potential shift is unusually suppressed in the underdoped region and attributed this observation to the strong stripe fluctuations which exist in this system. As for the chemical potential jump between La2CuO4 and Nd2CuO4, which would represent the band gap of the parent insulator, it was estimated to be at most 300 meV in previous valence-band photoemission studies [7, 8], which is much smaller than the 1.5–2.0 eV charge-transfer (CT) gap of the parent insulator estimated from optical studies [9].
High-quality single crystals of NCCO ( 0, 0.05, 0.125 and 0.15) were grown by the traveling-solvent floating-zone method as described elsewhere [10]. Uncertainties in the Ce concentration were . For , both as-grown and reduced samples were measured while for the other compositions only as-grown samples were measured. The as-grown samples were all antiferromagnetic and did not show superconductivity. Only the sample showed superconductivity after reduction in an Ar atmosphere and its was K.
X-ray photoemission spectroscopy (XPS) measurements were performed using both the Mg (eV) and Al (eV) lines and a hemispherical analyzer. All the spectra were taken at liquid-nitrogen temperature ( K) within minutes after scraping. We did not observe a shoulder on the higher binding energy side of each O 1s peak, indicating the high quality of the sample surfaces free from degradation. Although the energy resolution was about eV for both lines, we could determine the core-level shifts with an accuracy of about meV because most of the spectral line shapes did not change with . In XPS measurements, a high voltage of kV is used to decelerate photoelectrons, and it is usually difficult to stabilize the high voltage with the accuracy of meV. In order to overcome this difficulty, we directly monitored the voltage applied to the outer hemisphere and the retarding fringe, and confirmed that the uncertainty could be reduced to less than meV. To eliminate other unexpected causes of errors, we measured the sample as a reference just after the measurement of each sample.
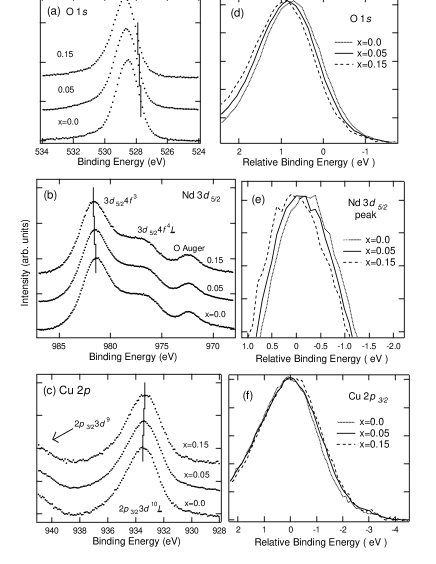
Figure 1 shows the XPS spectra of the O 1s, Nd 3 and Cu 2 core levels taken with the Al line. Here, the integral background has been subtracted and the intensity has been normalized to the peak height [11]. The Nd 3 spectra are composed of the 34Ḻ and 34 final-state components, where Ḻ denotes a ligand hole, and O KLL Auger signals overlap them. The Cu 2 spectra are composed of the 23Ḻ and 23 components, but only the 23Ḻ peaks are shown in the figure. One can see the obvious doping dependent shifts of O and Nd core levels from both the displaced and overlayerd plots in Fig. 1. To deduce the amount of the core-level shifts reliably, we used the peak position for the Nd 3d spectra and the mid point of the lower binding energy slope for the O 1s spectra. We used the mid-point position rather than the peak position for O because the line shape on the higher binding energy side of the O 1s peak was sensitive to a slight surface degradation or contamination. The Cu 2p core-level line shape was not identical between different ’s, and becomes broader as increases. This is because the doped electrons in the CuO2 plane produce Cu1+ sites on the otherwise Cu2+ background, which yield an overlapping chemically shifted component located on the lower binding side of the Cu2+ peak. Therefore, it was difficult to uniquely determine the shift of the Cu 2p core level and we only take its peak positions in the following.
Figure 2 shows the binding energy shift of each core level relative to the as-grown sample. Here, we have assumed that the change of the electron concentration caused by the oxygen reduction was per Cu (oxygen reduction being ) as reported previously [12]. One can see that the Nd 3d and O 1s levels move toward higher binding energies with electron doping. The shift of Cu 2p is defined by the shift of the peak position, and is in the opposite direction to Nd 3d and O 1s because of the Cu1+ components mentioned above. We also measured the shifts of the core levels using the Mg line and almost the same results were obtained as shown in Fig. 2.
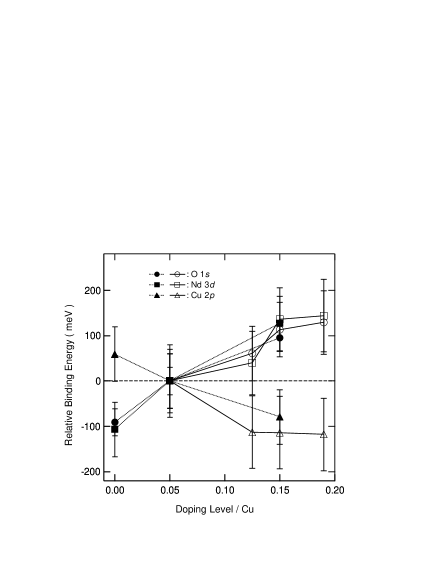
While the shift of the chemical potential changes the core-level binding energy, there is another factor that could affect the binding energy, that is, the change in the Madelung potential due to Ce4+ substitution for Nd3+. However, the identical shifts of the O 1s and Nd 3d core levels indicate that the change in the Madelung potential has negligible affects on the core-level shifts because it would shift the core levels of the O2- anion and Nd3+ cation in the opposite directions. Moreover, as the shifts of the O and Nd core levels toward higher binding energies with electron doping are opposite to what would be expcted from increasing core-hole screening capability with , excluding the core-hole screening mechanism as the main cause of the core-level shifts. Therefore, we conclude that the shifts of the O and Nd core levels are largely due to the chemical potential shift . We have evaluated in NCCO by taking the average of the shifts of the two core levels.
Figure 3(a) shows in NCCO as well as in LSCO [6] as a function of electron or hole carrier concentration. In order to obtain the jump in between Nd2CuO4 and La2CuO4, we also measured the O and Cu levels in LSCO as shown in Fig. 4, and found that the O and Cu levels in Nd2CuO4 lie at meV and meV higher binding energies than those in La2CuO4, respectively. The fact that the observed jump is different between O 1s and Cu 2p is not surprising because Nd2CuO4 and La2CuO4 are different materials with different crystal structures. Thus the chemical potential jump between Nd2CuO4 and La2CuO4 cannot be uniquely determined from those data but it should be much smaller than the CT gap of about eV for Nd2CuO4 and eV for La2CuO4 estimated from the optical measurements [9]. This small jump is in accordance with the early valence-band photoemission studies of LSCO and NCCO [7, 8].
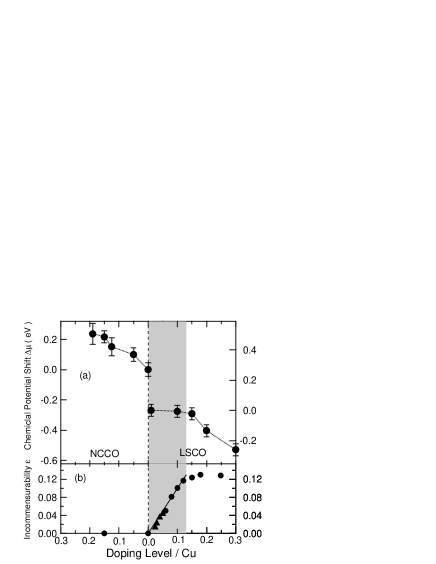
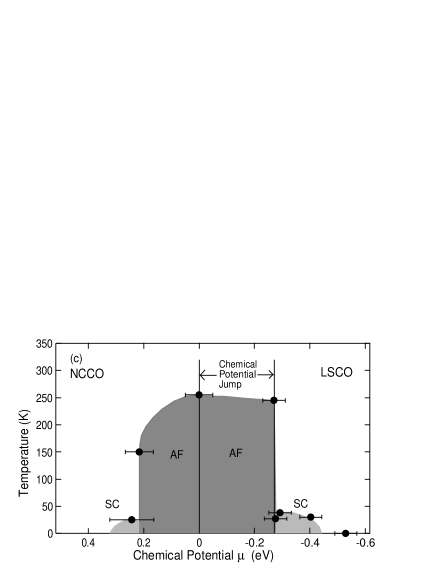
Figure 3(a) demonstrates the different behaviors of between LSCO and NCCO. In LSCO, is suppressed in the underdoped region , whereas in NCCO monotonously increases with electron doping in the whole concentration range. Figure 3(c) represents the phase diagram of LSCO and NCCO drawn against the chemical potential and the temperature . One can see that the phase diagram is rather symmetric between the hole doping and electron doping unlike the widely used phase diagram. That is, in both the electron- and hole-doped cases, the SC region is adjecent to the AF region, as proposed by Zhang [14] based on SO(5) symmetry. The present phase diagram implies that as a function of , increases up to the point where the superconductivity is taken over by the AF ordering. Such a behavior is reminiscent of the superfluid-solid transition in the phase diagram of 3He [15].

The monotonous increase of in NCCO may be understood within the simple rigid-band model. The chemical potential of Nd2CuO4 lies near the bottom of the conduction band. When electrons are doped, moves upward into this band as long as the AF ordering and hence the AF band structure persist as in NCCO. This behavior is contrasted with the suppression of in underdoped LSCO, where the AF ordering is quickly destroyed and the electronic structure is dramatically reorganized by a small amount of hole doping. It has been suggested [6] that the suppression of is related to the charge fluctuations in the form of stripes in LSCO. Indeed in La2-xSrxNiO4 (LSNO), where static stripe order is stable at 0.33 [16], is anomalously suppressed in the underdoped region [17]. In LSCO, dynamical stripe fluctuations have been implied by inelastic neutron scattering studies [3, 18] whereas any sign of stripes is absent in the neutron study of NCCO [5]. In Fig. 3, we compare the chemical potential shift with the incommensurability which was deduced from the neutron experiments both for LSCO [3] and NCCO [18]. This figure shows that in the region where does not move ( in LSCO), linearly increases with . In NCCO, where the chemical potential monotonously moves upward, the incommensurability does not change with (remains zero), in other words, static nor dynamical stripes do not exist. In the overdoped region of LSCO, the number of stripes saturates, doped holes overflow into the interstripe region and moves fast with hole doping.
The smallness of the chemical potential jump between Nd2CuO4 and La2CuO4 indicates that lies within the CT gap of Nd2CuO4 (1.5 eV) and La2CuO4 (2.0 eV). This behavior was clearly observed in an angle-resolved photoemission (ARPES) study of LSCO [19], where is located 0.4 eV above the top of the valence band of La2CuO4. Such a behavior is quite peculiar from the view point of the rigid-band model, and therefore a dramatic change in the electronic structure should occur with hole doping. In NCCO, however, the doping-induced change is not so dramatic as in LSCO as mentioned above, and the chemical potential pinning well below the bottom of the conduction band is not very likely. Another possible cause of the small chemical potential jump is that the CT gap is indirect and is smaller than that estimated from the optical studies. In optical conductivity spectra, only the direct transition can be unambiguously measured, and if the gap is indirect, the gap would be estimated much larger than the CT gap. This idea is consistent with the recent resonant inelastic x-ray scattering study [20] and its theoretical analysis using --- model [21], which has yielded an indirect gap that is smaller than the direct one by eV.
In summary, we have experimentally determined the doping dependence of the chemical potential shift in NCCO and observed a monotonous shift with doping. Comparison with LSCO indicates that the change in the electronic structure with carrier doping is more moderate in NCCO. The monotonous shift is consistent with the observation that spin fluctuations are commensurate in NCCO. The small chemical potential jump between the -type and -type materials is confirmed and is attributed to the indirect CT gap and the chemical potential pinning within the CT gap in LSCO.
The authors would like to thank S. Tesanovic, A. Ino and T. Mizokawa for enlightening discussions. Collaboration with G. A. Sawatzky and J. van Elp in the early stage of this work is gratefully acknowledged. This work was supported by a Grant-in-Aid for Scientific Research in Priority Area “Novel Quantum Phenomena in Transition Metal Oxides” and a Special Coordination Fund for the Promotion of Science and Technology from the Ministry of Education and Science and by New Energy and Industrial Technology Development Organization (NEDO).
REFERENCES
- [1] H. Takagi, S. Uchida, and Y. Tokura, Phys. Rev. Lett. 62, 1197 (1989).
- [2] H. Takagi, B. Batlogg, H. L. Kao, J. Kwo, R. J. Cava, J. J. Krajewski, and W. F. Peck, Jr., Phys. Rev. Lett. 69, 2975 (1992).
- [3] K. Yamada, C. H. Lee, K. Kurahashi, J. Wada, S. Wakimoto, S. Ueki, H. Kimura, Y. Endoh, S. Hosoya, G. Shirane, R. J. Birgeneau, M. Greven, M. A. Kastner, and Y. J. Kim, Phys. Rev. B 57, 6165 (1998).
- [4] S. J. Hagen, J. L. Peng, Z. Y. Li, and R. L. Greene, Phys. Rev. B 43, 13606 (1991).
- [5] K. Yamada, K. Kurahashi, and Y. Endoh, unpublished.
- [6] A. Ino, T. Mizokawa, A. Fujimori, K. Tamasaku, H. Eisaki, S. Uchida, T. Kimura, T. Sasagawa, and K. Kishio, Phys. Rev. Lett. 79, 2101 (1997).
- [7] H. Namatame, A. Fujimori, Y. Tokura, M. Nakamura, K. Yamaguchi, A. Misu, H. Matsubara, S. Suga, H. Eisaki, T. Ito, H. Takagi, and S. Uchida, Phys. Rev. B 41, 7205 (1990).
- [8] J. W. Allen, C. G. Olson, M. B. Maple, J.-S. Kang, L. Z. Liu, J.-H. Park, R. O. Anderson, W. P. Ellis, J. T. Markert, Y. Dalichaouch, and R. Liu, Phys. Rev. Lett. 64, 595 (1990).
- [9] S. Uchida, T. Ido, H. Takagi, T. Arima, Y. Tokura, and S. Tajima, Phys. Rev. B 43, 7942 (1991).
- [10] Y. Onose, Y. Taguchi, T. Ishikawa, S. Shinomori, K. Ishizaka, and Y. Tokura, Phys. Rev. Lett. 82, 5120 (1999).
- [11] We note that the background subtraction does not affect the estimates of the shifts.
- [12] A. J. Schultz, J. D. Jorgensen, J. L. Peng and R. L. Greene, Phys. Rev. B 53, 5157 (1996).
- [13] S. Hüfner, Photoelectron Spectroscopy (Springer-Verlag, Berlin, 1995). Chap. 2, p. 35.
- [14] S. C. Zhang, Science 275, 1089 (1998).
- [15] S. Tesanović, private communication.
- [16] J. M. Tranquada, D. J. Buttrey, V. Sachan, Phys. Rev. B 54, 12318 (1996).
- [17] M. Satake, K. Kobayashi, T. Mizokawa, A. Fujimori, T. Tanabe, T. Katsufuji, and Y. Tokura, Phys. Rev. B 61, 15515 (2000).
- [18] M. Matsuda, M. Fujita, K. Yamada, R. J. Birgeneau, M. A. Kastner, H. Hiraka, Y. Endoh, S. Wakimoto and G. Shirane, Phys. Rev. B 62, 9148 (2000).
- [19] A. Ino, C. Kim, M. Nakamura, T. Yoshida, T. Mizokawa, Z.-X. Shen, A. Fujimori, T. Kakeshita, H. Eisaki, and S. Uchida, Phys. Rev. B 62, 4137 (2000).
- [20] M. Z. Hassan, E. D. Isaacs, Z.-X. Shen, L. L. Miller, K. Tsutsui, T. Tohyama, and S. Maekawa, Science 288, 1811 (2000).
- [21] K. Tsutsui, T. Tohyama, and S. Maekawa, Phys. Rev. Lett. 83, 3705 (1999).