The Smectic Phase of Spherical-Fan Shaped Molecules. A Computer Simulation Study
Abstract
We have used Monte Carlo computer simulations to study a system of spherical fan shaped particles made of three hard discs fused along a common diameter. The calculated equation of state indicates a strong, entropy driven, first order transition from the isotropic phase to a layered phase that has the basic characteristics of the usual smectic A mesophase but with strongly correlated rotations about the symmetry axes of neighbouring molecules.
During the last decades computer simulations, have become a very powerful tool not only for testing theories but also for confirming and predicting phase behaviour in a wide class of simple as well as complex model systems. In the late 50’s, the fogy landscape in the field of freezing transition for hard sphere systems was cleared up by the famous computer simulations of Alder and Wainwright [1] and of Wood and Jacobson [2]. These simulations showed that such systems could indeed form stable crystals. Three decades later, simulations by Frenkel and co-workers [3] confirmed Onsager’s theory [4] for the entropically driven order disorder transition in systems of long hard rods. Since then, numerous computer simulation efforts have shown that even highly idealized molecular systems, interacting exclusively with steric repulsions, can exhibit a rich variety of anisotropic mesophases. Thus, sufficiently anisometric “hard” particles can form phases of the same symmetries with the known liquid crystalline phases i.e. calamitic and discotic nematics, smectics, columnar (for a review see [5]) as well as novel phases that are yet to be observed in nature (e.g. cubatic [6]). Moreover, computer simulations of hard particles have provided clear insights into the role of packing entropy in driving phase transitions to and among liquid crystalline phases and in determining their structure [3, 5, 7]. The neglect of short range “soft” interactions or longer ranged electrostatic interactions or molecular flexibility and the associated conformational changes, limits theory and computer simulations to a qualitative description of real systems, usually without claims of quantitative reliability. Nevertheless, mimicking the basic molecular properties with simplified hard body models and making computer experiments with them, thus taking into account nearly exactly the short range intermolecular correlations, could be a first step towards the molecular engineering of new materials with novel and possibly desirable properties.
At the same time, the synthetic efforts of chemists in the field of liquid crystals have produced a number of novel molecular structures and mesophases that have generated further research excitement and have inspired new molecular simulations. Most recently, supermolecular systems of dendritic architecture of controlable sizes, shapes and rigidity have been made and found to form mesophases with unusual properties [8, 9, 10, 11, 12]. Interestingly, such systems produce anisotropic fluid phases even when the global shape of the supermolecules (the “molecular envelope”) is not sufficiently (or not at all) anisometric by the standards used for usual low molar mass liquid crystals [11, 13]. This phenomenon can be rationalised in terms of strongly anisotropic interactions that appear at short intermolecular distances where substantial interpenetration of the molecular envelopes occurs. In hard-body modelling of the interactions this corresponds to molecules of highly non-convex shapes, with the non-convexity giving rise to strong orientational correlations among the molecules at short distances. Strictly, the shapes of molecules are in general non-convex. However, orientational ordering in common liquid crystals is primarily a result of anisometry of the molecular shape, although non-convexity is clearly involved as an additional factor in bent-rod molecular models of smectics such as the zig-zag model [14, 15] and the banana smectogen models [16]. Other multi-rod models, such as the “Onsager crosses” studied by Blaak and Mulder in connection with the formation of cubatic phases [17, 18], stipulate non-convex molecular shapes although their primary intention is to convey the competition among different molecular directions of alignment. To our knowledge, shape non-convexity has not been explicitly addressed as the molecular feature underlying the formation of orientationally ordered fluid phases in classes of compounds where anisometry of the global molecular shape is marginal or completly absent.
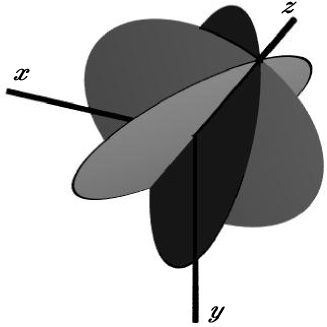
In this paper we present the first results of our study of liquid crystalline phases originating from non-convexity of the molecular shape. To completely remove any influence from global shape anisometry we have chosen at this stage to study molecules whose global shape is spherical. We have performed Monte Carlo (MC) simulations of a system of fan-shaped hard-body molecules made of three infinitely thin discs fussed symmetrically along a common diameter, as shown in Fig. 1. The molecular -axis is chosen to coincide with the direction of the common diameter, the -axis is chosen along the normal to the surface of one of the three discs and the -axis completes a right-handed orthogonal molecular axis frame. The diameter of the discs, and therefore of the spherical envelope of the entire fan-shaped molecule, is denoted by .
Using the standard MC method of Wood [19] we have studied the thermodynamic and structural properties of hard spherical fans in the isothermal-isobaric ensemble. An advantage of this MC- method is that the equation of state of the system is obtained directly for a sequence of constant pressures and the corresponding densities are calculated as ensemble averages. Each MC trial move consists of a random displacement of the centre of mass of a particle followed by a random rotation around one of the molecular axes [20]. The move is accepted if the particle in the new state does not overlap with any of the other particles, otherwise the move is rejected. The variations in the volume of the sample are introduced by random changes in the logarithm of the volume [21]. The maximum molecular displacements, rotations and volume changes are adjusted so that the acceptance ratio for the corresponding trial moves lie around . In what follows, pressure and density are expressed in terms of molecular quantities according to the usual dimensionless parameterisation: and , where is the molecular number density and is the volume of the spherical envelope, i.e. of a sphere with diameter equal to the diameter of the discs. Distances are expressed in units of D.

The size of the system and the shape of the simulation box do not seem to affect critically the results. Simulating systems from particles up to , using cubic or variable shape box, yield essentially the same results for the equation of state and the relevant thermal averages, apart from differences in the standard deviations of the calculated averages. In what follows we present results of systems containing particles in cubic boxes. One MC cycle consists on average of N displacement/reorientation attempts followed by one attempted volume change. The particles are initially placed on a fcc lattice and the system is equilibrated at low pressure, well in the isotropic phase. The system is then gradually compressed to higher densities by increasing the pressure. For each pressure (using as initial configuration the last configuration of the previous pressure) the system is equilibrated for MC cycles and ensemble averages are accumulated over at least a further MC cycles. The required MC cycles in the vicinity of the phase transition are by one order of magnitude longer in order to obtain reliable statistics. The calculated phase diagram is given in Fig. 2. It is apparent that at a first order transition takes place and the system condenses from a low density phase to a new phase with appreciably higher density . Once the high pressure phase has been reached, the phase diagram is reproduced with negligible hysteresis by expansion of the system.
(a)
(b)
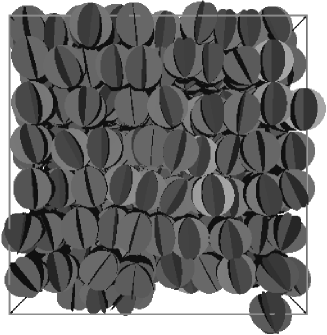
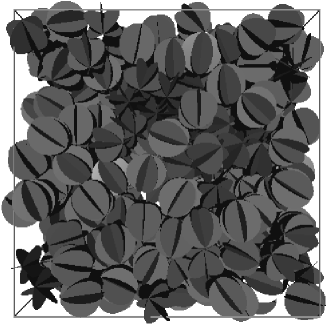
Visualization of the low and high density phases at the boundaries of the phase transition, shown in Fig. 3, makes it evident that the low pressure phase is , as expected, isotropic whereas the dense phase has both, layered structure and long range orientational order of the -axes of the spherical fans. In order to quantify the orientational order we have calculated the principal order parameter where is the second Legendre polynomial, corresponds to the direction of the molecular -axis and is the director (symmetry axis) of the phase (for details see [5, 20, 22]) and the angular brackets denote ensemble averaging. In the ordered phase S increases slowly with increasing the pressure from a value at the transition to at .
In order to characterize the phases in some detail we have calculated from the simulations the usual orientationally averaged radial correlation function , as well the orientational correlation function where is the direction of the molecular -axis of a particle at the origin and is the corresponding direction of a particle at distance from the origin. Fig. 4(a) shows the calculated for four different pressures. For pressures corresponding to the isotropic phase the first peak appears at while for higher pressures it appears at . The latter value is very near the closest distance of approach () of two molecules oriented such that their -axes are side-by-side parallel and a disc blade of the one exactly bisects the dihedral angle formed by two adjacent blades of the other. The position of this peak, together with the average intermolecular distance calculated from the density of the ordered phase and together with analogous features of the other correlation functions to be discussed below, indicate that the spherical envelopes of neighbouring molecules overlap considerably in a way that the blades of one molecule are accommodated in the grooves between the blades of its side-by-side neighbours, thereby giving rise to strong correlations of the rotations about the z molecular axes. At high pressures, the persisting structure of at large distances is primary due to the layering of the molecules.
In a system with long range orientational order becomes long ranged and its limiting value at large distances tends to [22]. The first high peak at corresponds to the minimum non-overlapping distance of two particles with parallel -axes (half diameter). Higher rank orientational correlation functions show the expected behaviour namely, vanish at long distances in the isotropic phase and level off at a finite value in the layered phase.

To examine the positional order we have evaluated the correlation functions and shown in Fig 4(c) and (d). These describe the probability of finding a pair of molecules with magnitude ( ) for the projection of their intermolecular vector along (perpendicular to) the layer normal. For the layered phase maps the density modulation along the director, with the period of the density wave yielding the layer spacing. The nonzero values of the density wave in the inter-layer region (Fig. 4(c)) indicate that some particles are found between the layers. The layer spacing at the transition is approximately one molecular diameter and decreases slightly with increasing pressure, indicating that the phase does not exhibit strong interdigitation of the layers , at least up to . Furthermore, as evident from Fig. 4(d), the absence of long range positional correlations (structureless at long distances) shows that the phase exhibits liquid like positional behaviour within the layers, characteristic of a smectic A mesophase. Moreover, we observe that the second high peak in the radial distribution function, at , is not exhibited by , indicating that this peak originates from correlations among particles in different layers.
Spherical fan molecules made of two discs or of more than three discs have also been considered. Preliminary simulations of two disc fans showed that their interactions are not sufficiently anisotropic to clearly produce orientationally ordered phases. Fans with four or five discs show qualitatively the same behaviour as three disc fans but with the transition to the ordered phase shifted towards higher pressures. As the number of discs in the fan molecules increase, their phase organisation tends to that of hard spheres. Preliminary runs show that ten disc spherical fans behave practically as hard spheres. Symmetric three-disc fans with discs of finite thickness were also considered. The thickness of the discs controls the extent of side-by-side interdigitation of the fans and is found to influences critically the phase diagram and the correlation functions in the ordered phase. Finally, variants of the three disc spherical fans have also been considered in which the discs are not fused along a common diameter; the results will be reported in a forthcoming communication.
The primitive structures considered in this study are relevant to certain known classes of organic and inorganic compounds such as propellanes [23] and compounds with cage type molecular architecture [24]. Aside from very few known exceptions [25], such compounds do not show liquid crystalline behaviour. With the help of the present simulations this can understood by simply comparing the effective “blade thickness” to the “groove width” of the spheroid fan molecules and noting that for the molecular interaction to have a substantial anisotropic component the groves should be sufficiently deep and wide enough to readily accommodate a blade. Common carbocyclic fan-shaped compounds do not meet this requirement since the diameter of the blade-forming rings is not sufficiently larger than their thickness. The simulated mesophase behaviour of the thin-disc spherical fan model would therefore be more directly relevant to supermolecular structures in which the blade diameter can be made much larger than its thickness while maintaining sufficient rigidity to confer a spherical fan or cage geometry to the interacting supermolecules.
Acknowledgements We thank G.H. Mehl and E.T. Samulski for very helpful discussions. This work was supported in part by the Greek General Secretariat of Research and Technology and the European Social Fund under the PENED’99 project 99ED52.
References
- [1] B. J. Alder and T. E. Wainwright, J. Chem. Phys. 27, 1208 (1957).
- [2] W. W. Wood and D. J. Jacobson, J. Chem. Phys. 27, 1207 (1957).
- [3] A. Stroobants, H. N. W. Lekkerkerker, and D. Frenkel, Phys. Rev. A 36, 2929 (1987).
- [4] L. Onsager, Ann. NY Acad. Sci. 51, 627 (1949).
- [5] M. P. Allen, G. T. Evans, D. Frenkel, and B. M. Mulder, Adv. Chem. Phys 86, 1 (1993).
- [6] J. A. C. Veerman and D. Frenkel, Phys. Rev. A 45, 5632 (1992).
- [7] S. C. McGrother, D. C. Williamson, and G. Jackson, J. Chem. Phys. 104, 6755 (1996).
- [8] K. Lorenz, D. Holter, B. Stuhn, R. Mulhaupt, and H. Frey, Adv. Mater. 8, 414 (1996).
- [9] V. Balagurusamy, G. Ungar, V. Percec, and G. Johansson, J. Am. Chem. Soc. 119, 1539 (1997).
- [10] R. M. Richardson, S. A. Ponomarenko, N. I. Boiko, and V. P. Shibaev, Liq. Cryst. 26, 101 (1999).
- [11] J. Barbera, M. Marcos, and J.-L. Serrano, Chem. Eur. J. 5, 1834 (1999).
- [12] G. H. Mehl and J. W. Goodby, Chem. Commun. 1, 13 (1999).
- [13] A. F. Terzis, A. G. Vanakaras, and D. J. Photinos, Molec. Crys. Liq. Cryst. 330, 517; ibid (in press) (1999).
- [14] R. Bartolino, J. Doucet, and G. Durantd, Ann. Phys. (Paris) 3, 389 (1978).
- [15] A. G. Vanakaras, D. J. Photinos, and E. T. Samulski, Phys. Rev. E 57, R4875 (1998).
- [16] P. J. Camp, M. P. Allen, and A. J. Masters, J. Chem. Phys. 111, 9871 (1999).
- [17] R. Blaak, Cubatic Phase in Complex Liquids, Ph.D. thesis, FOM Institute, Amsterdam (1997).
- [18] R. Blaak and B. M. Mulder, Phys. Rev. E 58, 5873 (1998).
- [19] W. W. Wood, J. Chem. Phys. 48, 415 (1968).
- [20] M. P. Allen and D. J. Tildesley, Computer Simulation of Liquids ((Oxford University, New York), 1987).
- [21] D. Frenkel and B. Smit, Understanding Molecular Simulation (Academic Press, 1996).
- [22] C. Zannoni, in The Molecular Physics of Liquid Crystals, edited by G. R. Luckhurst and G. W. Gray (Academic Press, 1979), chap. 3.
- [23] D. Ginsburg, Propellanes: Structure and Reactions (Verlag Chemie, Weinheim, 1975).
- [24] Y. Tobe, in Carbocyclic Cage Compounds: Chemistry and Applications, edited by E. Osawa and O. Yonemitsu (VCH Publishers, New York, 1992).
- [25] P. Bassoul, J. Simon, and C. Soulie, J. Phys. Chem. 100, 3131 (1996).