Synthesis and Processing of powders and wires
Abstract
Sintered powders and wires of superconducting have been fabricated under a variety of conditions in order to determine details of the diffusion of the into and to study the types of defects that arise during growth. For samples prepared by exposure of boron to vapor at , the conversion of particles of less than size particles to is complete in about . The lattice parameters of the phase determined from X-ray are independent of the starting stoichiometry and the time of reaction. Wire segments of with very little porosity have been produced by reacting diameter boron fibers in an atmosphere of excess vapor at . Defects in the reacted fibers are predominantly the voids left as the boron is converted to .
pacs:
I Introduction
The discovery of superconductivity in the intermetallic compound, near [1] has prompted both fundamental studies of the mechanism causing superconductivity[2] and practical studies of supercurrent transport at grain boundaries.[3, 4] Bud’ko and co-workers[2] have shown the existence of a boron isotope effect in that with , where is the superconducting transition temperature and is the isotopic mass. This result implies that the electron-phonon interaction is important in the determination of and that light elements with high phonon frequencies might be important in the search for new metallic superconductors with high transition temperatures. Energy gap measurements[5] and neutron scattering measurements of the phonon spectrum[6] all point to a conventional mechanism for the superconductivity. On the practical side, Canfield and co-workers[7] have shown a method to convert commercially available boron fibers[8] into very low resistivity wire and Takano and co-workers[9] have measured the current carrying capacity of hot-pressed pellets of the material. Other measurements of flux pinning and intergrain coupling have been made using studies of flux creep.[10]
In this paper, we report a systematic study of the vapor diffusion method of sample preparation for both microcrystalline powders and boron () fibers, which are available commercially in kilometer lengths. The primary variable in the study is time, and for the wire samples the effect of defects in the starting fibers. Of particular interest is the role of the tungsten-boride core in creating cracks and transmitting along the length of the fiber.
II Experiment
For powder synthesis, we place a stoichiometric mixture of bright lumps of () and fine crystalline powder ( ) that is less than in diameter into a tube whose ends are sealed under a partial atmosphere of . For the wire synthesis, we cut fiber lengths several long and either or in diameter and place them in tubes under a partial pressure of with excess . These starting fibers have a tungsten-boride core about in diameter with breaks every few .[8]
After the tubes are sealed, they are in turn sealed in quartz ampoules with of and placed in a box furnace preheated to . It is believed that using a preheated furnace inhibits the growth of higher boron phases. After reaction, the samples are rapidly cooled by putting the quartz tube in running cold water. The formation of from causes the powders to expand and bow the tube outward[2] and causes diameter wires to expand by more than in diameter.[7]
Samples are characterized by X-ray diffraction, magnetization, and electrical resistivity. X-ray diffraction spectra are taken with radiation in a Scintag diffractometer where the scan angle varies from to with a scan step of . Magnetization is measured in a Quantum Design magnetometer with a sample travel in a magnetic field of in a zero-field-cooled mode. Resistivity is measured with a standard four probe technique using an resistance bridge.
III Results and discussion
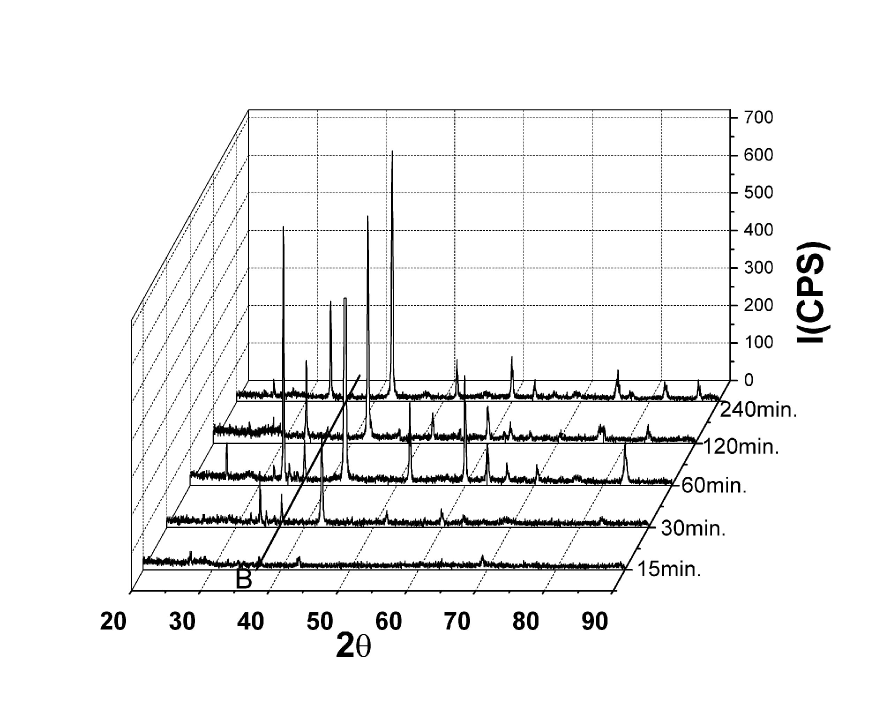
The lattice constants of the phase, determined from X-ray data, change relatively little with time of reaction for powders and have values close to those previously reported.[11] The dynamics of the growth of the phase are illustrated by the study of powder diffraction X-ray data after different times of reaction in Fig. 1. The major peak at , marked by the solid line on the figure, is small and goes away during processing. For particle sizes used here (less than ), the peaks grow quickly between and and remain relatively unchanged from to . The peaks used for a standard have been removed from these spectra. It should be noted that when the reaction ampoule was placed in a furnace, heated to , left for , and quenched, the powder X-ray spectra showed many second phase peaks. Zero-field-cooled magnetization measurements for these same samples show the transition width narrowing from to and then remaining relatively constant at about .
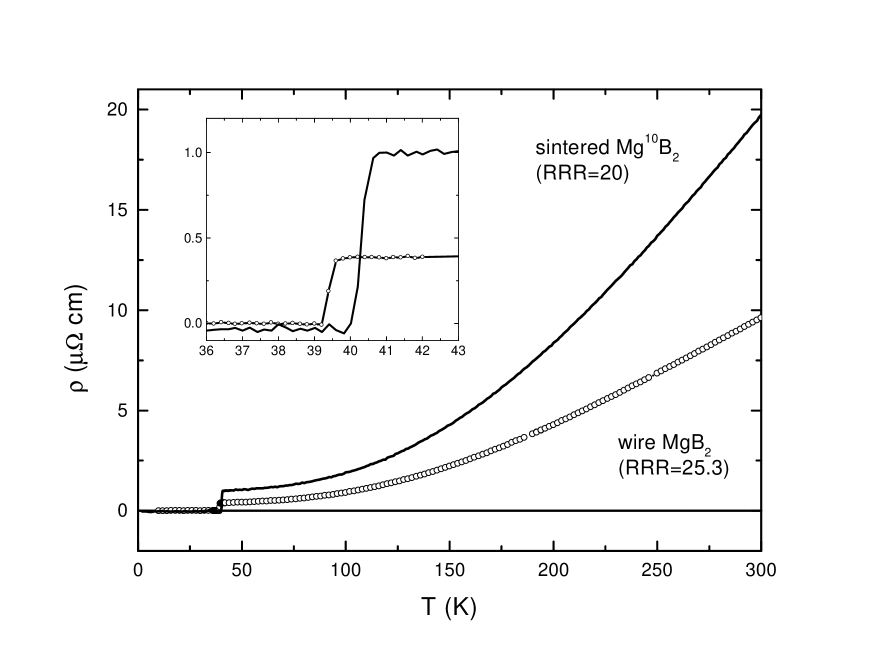
Electrical resistivity of the sintered pellets is compared to the wires in Fig.2. The inset in Fig. 2 shows an expanded view near the transition temperature and indicates values at of about for the pellets and for the wire segments. These processing methods give very low electrical resistivity in the normal state for both pellets and wires. Because both the relatively open structure of the pellet and the dense structure of the wire samples have comparable residual resistivity ratios, , we think the lower resistivity values for the wire sample are due to its higher density.
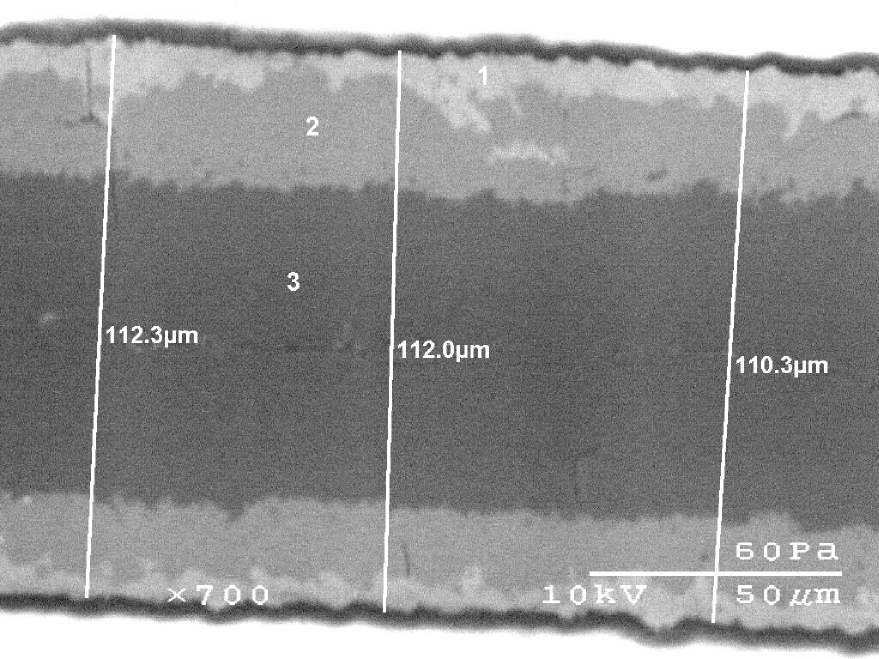
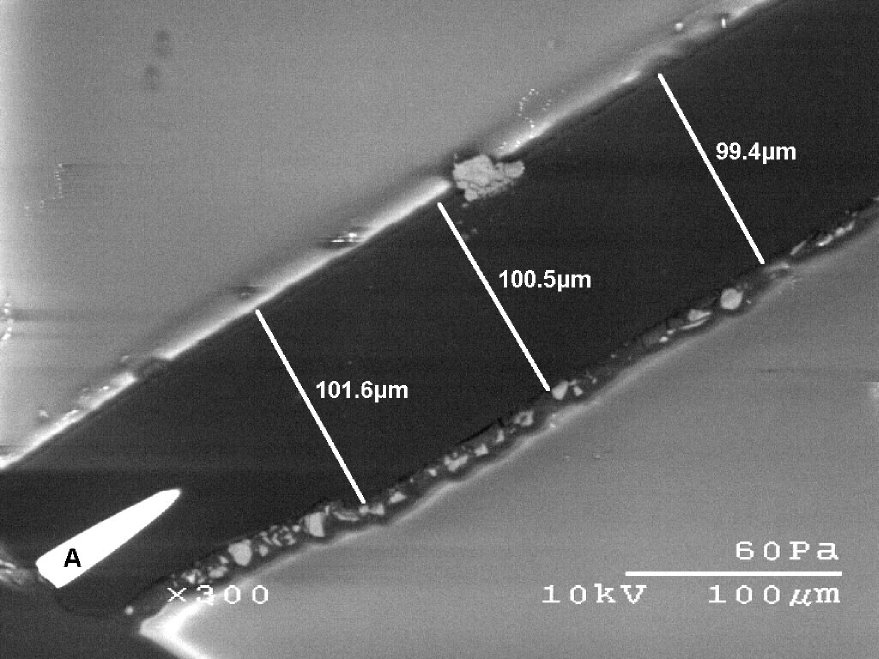
In order to study the synthesis of wire, a series of exposure time, t, of the boron fibers in vapor was measured for . For the processing of the diameter fibers, the scanning electron micrographs in Fig. 3a and 3b illustrate the behavior seen. In these micrographs, has a much higher atomic number than so the shading is a good indication of content. In Fig. 3a, a length of fiber reacted for has been polished through a section that misses the tungsten-boride core in the middle of the fiber. The concentration is very high at the outside surface region marked (1), and there is a clear front of moving across the fiber. At the boundary between the regions marked (2) and (3), energy dispersive X-ray spectra (EDS) show that the level abruptly falls by about . Region (3) has a fairly high content, even though it has not transformed to the phase. As shown by the diameter lines, the diameter of this section has grown by more than from the original .
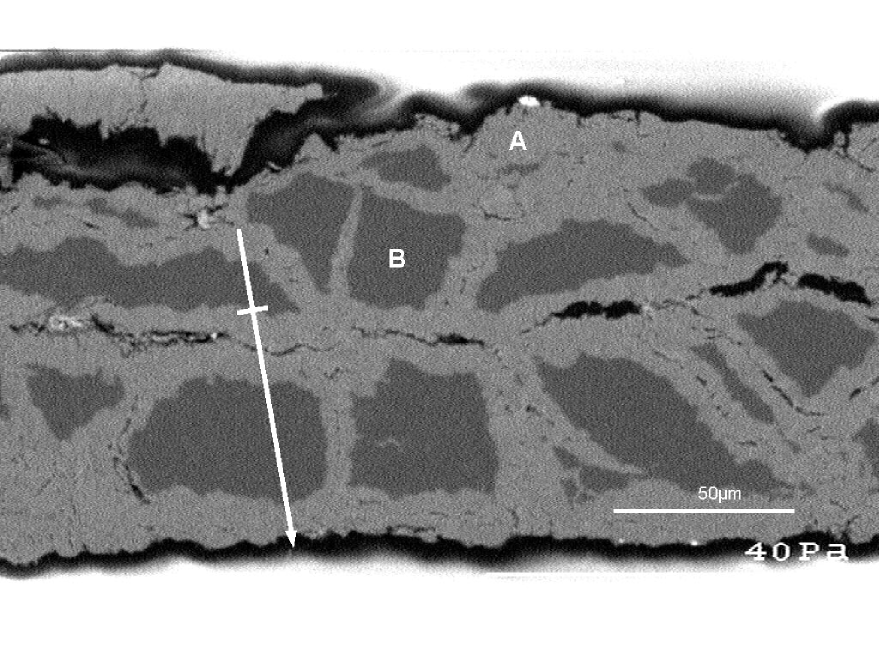
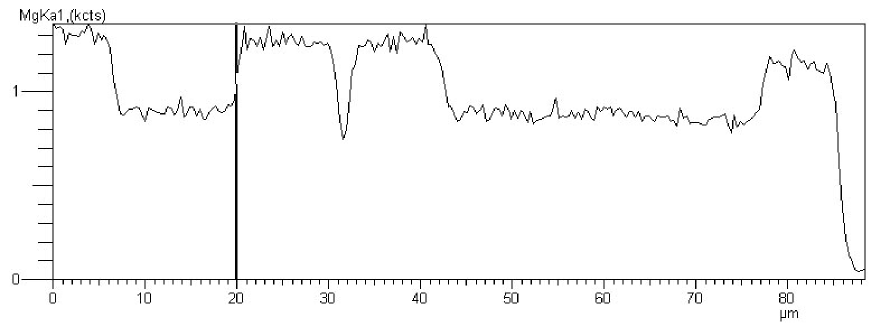
A different section of fiber reacted for in the same run as in Fig. 3a is shown in Fig. 3b. Here the polishing just barely exposes the tungsten-boride core along the centerline. This SEM micrograph shows many of the common defects. The dark line along the center is a void region, which often occurs near the tungsten-boride core, and an EDS spectrum shows very strong lines in this region. The bright region marked (A) is an region and the dark region marked (B) is an unreacted region. If optical pictures are taken, the regions stand up above the regions because they are harder and polish less rapidly. Figure 3c shows an EDS line scan measurement of the concentration taken along the dark line running from upper left to lower right in the left-center portion of Fig. 3b. The count on Fig. 3c drops from about to about going from the bright region to the dark region. The tick mark on the line in Fig. 3b corresponds to the vertical line in Fig. 3c and to a point where the scan moves from a dark region back into a bright region near the core. Magnesium seems to diffuse very rapidly along the core region and diffuse outward from there to form . The void region shown by the dark area in the upper left corner of Fig. 3b is unusually large, and the bottom of the void is clearly seen in the SEM. Voids are commonly about across, and the bottom of the void generally can be seen in the SEM. The diagonal regions of high content we believe are cracks where the can diffuse rapidly and start the formation of .
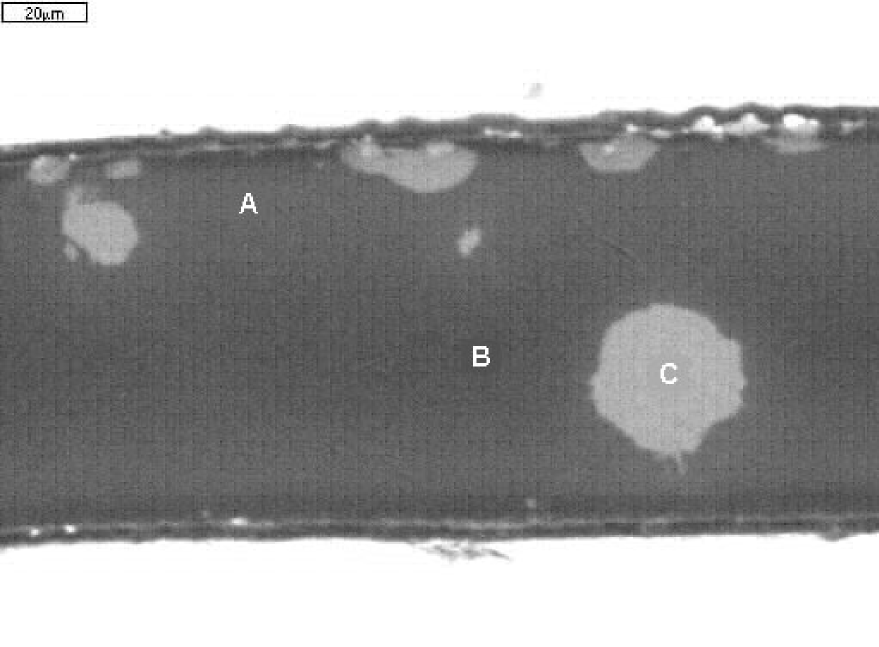
A fiber reacted for is shown in Fig. 4a. Again the polishing depth does not cut through the core. The sample has much less conversion to , shown by the bright spots. EDS measurements show the highest content in the bright spot marked (C), substantially less near the edge at the point marked (A), and even less at the point near the center marked (B).
Another fiber reacted for is shown in Fig. 4b. In the left edge of this fiber, the tungsten core shows through, and the diameter of the fiber is still close to . The EDS data show only a small amount of near the edge of the fiber and practically none in the center of the fiber.
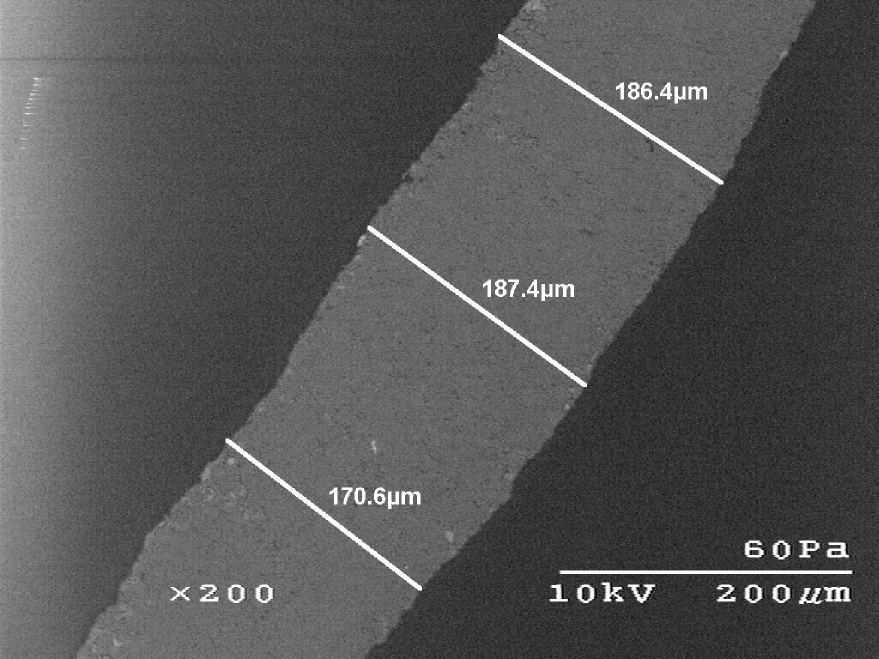
When exposure time, , the starting diameter fibers are fully reacted and end up having a final diameter of about . To examine how the process scales with initial fiber size, a diameter fiber was exposed for a much longer time, , with the results shown in Fig. 5. The conversion to has increased the diameter of the wire to greater than , as shown by the diameter measurements. There are no second phase particles large enough to be seen in the SEM micrograph, and the fiber is relatively void free.
IV Conclusions
Low resistivity, high purity powders and highly dense wires of can be synthesized by exposure of boron powder and boron fibers to vapor at for adequate exposure time. Comparable results are seen for both and diameter fibers. For fibers that are placed in a furnace preheated to , the phase begins to form quickly after about and is about percent complete after an hour. Diffusion of along the tungsten-boride core and along voids or cracks in the fiber are important means of transport. As the phase forms, the diameter of the fiber grows from about to about . As reported earlier,[7] the wire segments provide a highly conducting material with a normal state resistivity of about and a superconducting critical current density of about at and .
V Acknowledgments
Work is supported by the U.S. Department of Energy, Basic Energy Sciences, Office of Science, through the Ames Laboratory under Contract No. W-7405-Eng-82.
REFERENCES
- [1] J. Nagamatsu, N. Nakagawa, T. Muranaka, Y. Sentani, and J. Akimitsu, Nature 410, 63 (2001).
- [2] S. L. Bud’ko, G. Lapertot, C. Petrovic, C. E. Cunningham, N; Anderson, and P. C. Canfield, Phys. Rev. Lett. 86, 1877 (2001).
- [3] D. K. Finnemore, J. E. Ostenson, S. L. Bud’ko, G. Lapertot, and P. C. Canfield, Phys. Rev. Lett. 86, 2420 (2001).
- [4] D. C. LarbalestierM. Rikel, L. D. Cooley, A. A. Polyanskii, J. Y. Jinang, S. Patnaik, X. Y. Cai, D. M. Feldmann, A. Gurevich, A. A. Squitier, M. T. Naus, C. B. Eom, E. E. Hellstrom, R. J. Cava, K. A. Regan, N. Rogado, M. A. Hayward, T. He, J. S. Slusky, K. Inumaru, and M. Haas, Nature 410,186 (2001).
- [5] G. Karapetrov, M. Iavarone, W. K. Kwok, G. W. Crabtree, and D. G. Hinks, cond-mat/0102312; and H. Schmidt, J. F. Zasadzinski, K. E. Gray, and D. G. Hinks, cond-mat/0102389;
- [6] R. Osborn, E. A. Goremyshkin, A. I. Kolesnikov, and D. G. Hinks, cond-mat/0103064.
- [7] P. C. Canfield, D. K. Finnemore, S. L. Bud’ko, J. E. Ostenson, G. Lapertot, C. E. Cunningham, and C. Petrovic, Phys. Rev. Lett. 86, 2423 (2001).
- [8] Textron Systems, 201 Lowell Street, Wilmington, MA 01887.
- [9] Y. Takano, H. Takeya, H. Fujii, H. Kumakura, K. Togano, H. Kito and H. Ihara, cond-mat/0102167.
- [10] Y. Bugoslavsky, G. K. Perkins, L. F. Cohen, and A. D. Caplin, Nature .
- [11] N. V. Vekshina, L. Ya. Markovskii, Yu. D. Kondraschev, and T. K. Voevodskaya, Zhurnal Prikladnoi Khimii, 44, 970 (1971).