Landau Level Crossings and Extended-State Mapping in Magnetic Two-dimensional Electron Gases
Abstract
We present longitudinal and Hall magneto-resistance measurements of a “magnetic” two-dimensional electron gas (2DEG) formed in modulation-doped Zn1-x-yCdxMnySe quantum wells. The electron spin splitting is temperature and magnetic field dependent, resulting in striking features as Landau levels of opposite spin cross near the Fermi level. Magnetization measurements on the same sample probe the total density of states and Fermi energy, allowing us to fit the transport data using a model involving extended states centered at each Landau level and two-channel conduction for spin-up and spin-down electrons. A mapping of the extended states over the whole quantum Hall effect regime shows no floating of extended states as Landau levels cross near the Fermi level.
PACS:73.20, 78.66.-w, 79.60.Jv
When a perpendicular magnetic field is applied to a two-dimensional electron gas (2DEG), the electron energy levels become quantized into highly degenerate Landau levels (LLs) that are broadened by the presence of disorder. Each broadened LL has a “mobility edge” separating localized states in the tail regions from extended states in the central region of the LL. The interplay between the extended and localized states in this simple physical system has given rise to rich physics, ranging from the integer quantum Hall effect (IQHE) [1] to the magnetic field induced metal-insulator transition.[2][3] The location of the mobility edges within the density of states (DOS) for each LL is still a subject of research and speculation.[4] Particularly interesting aspects of 2DEG physics are anticipated when circumstances allow for the overlap of different LLs and their possible mixing. For instance, calculations predict that LL mixing at vanishing magnetic fields may be responsible for a “floating” of extended states to higher energies,[5] hence offering a possible resolution to the magnetic-field induced insulator-to-metal transition in 2DEGs.[6][7] However, clean experimental studies of the consequences of LL mixing at small magnetic fields are problematic since the existence of LLs requires finite magnetic fields. This has motivated investigations of 2DEGs in which LL crossings are purposely engineered away from zero magnetic fields in the regime of quantum transport.[8][9]
Here, we use a “magnetic” 2DEG system (modulation-doped quantum wells) to create finite field crossings between opposite spin states of LLs with different orbital quantum number. We observe striking anomalies in the magnetic field- and temperature-dependence of the sheet and Hall resistance ( and respectively), including a negative differential Hall resistance. Surprisingly, the data can be explained in detail using a simple model of the extended states at the center of each disorder broadened LL, without resorting to explicit LL mixing of the opposite spin states. Further, by combining magnetization, optical and transport measurements on samples from the same wafer, we map out the extended states in the LLs of the 2DEG, providing for the first time a means to determine the form of the extended states well away from a quantum Hall plateau. Our measurements indicate that, at least in the present 2D system, LL crossings at finite fields do not result in a floating of extended states.
Samples used in this study are grown by molecular beam epitaxy (MBE) and consist of a modulation-doped quantum well located between ZnSe barriers. In these “magnetic” 2DEGs, the exchange interaction between confined electrons and local moments (Mn2+ ) results in a temperature- and magnetic field-dependent amplification of the “bare” Zeeman energy. [10] The ensuing LL fan diagram has an unusual structure in which the dominance of the spin-splitting () over the Fermi energy () and the cyclotron splitting can result in a highly spin-polarized 2DEG even at low magnetic fields. Earlier studies of low density samples (where ) have shown how these can serve as model examples of a “spinless” 2D fermion gas because all the LLs below are in the same spin state. [3] [11] [12] The samples studied here belong to a qualitatively different regime in which , resulting in discrete points where Landau levels of opposite spin cross near .
In order to allow for complementary magnetometry measurements on the same sample (reported in more depth elsewhere [13]), an MBE-grown (100) GaAs/GaAlAs heterostructure is used as a substrate. This paper focuses on a sample in which the active 2DEG layer is deposited on a 1 m thick ZnSe buffer layer and consists of a modulation-doped 10.5 nm ( monolayers) quantum well region in which monolayer of MnSe is inserted every 7 monolayers of (giving an average Mn composition of about 0.9 percent). The doping is provided by 20 nm of n-doped ZnSe:Cl separated by 12 nm of undoped ZnSe on either side of the quantum well. We note that the data shown here is qualitatively similar to that seen in other samples with similar composition.
Magneto-resistance measurements are carried out using standard dc techniques (excitation current nA) on mesa-etched Hall bars ( m) at low temperature (330 mK 7 K) in a pumped helium-3 cryostat in magnetic fields up to 8T. Electrical contacts to the 2DEG are made by first removing the oxide from the surface with an etch of and using diffused indium contacts annealed in a forming gas atmosphere for 15 minutes. Electron density in the 2DEG is varied electrostatically with an evaporated gold gate, separated by m of spun-on insulator (benzocyclobutene). Additional measurements carried out at lower temperatures in a dilution fridge confirm that the data does not change in any qualitative manner at temperatures below 300 mK. Magnetization is measured over a comparable range of temperature and magnetic field using cantilevers fabricated out of the same wafer.[13] Finally, magneto-photoluminescence measurements are used to deduce the spin splitting of conduction band states.
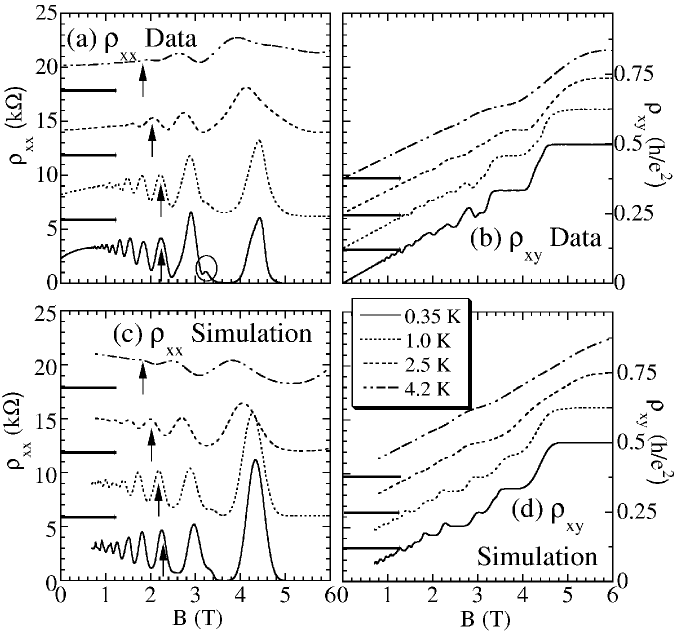
Figures 1 (a) and (b) show the magnetic field- and temperature-dependence of and at zero gate voltage. We see a strong positive magneto-resistance at low fields which is larger for low temperature and low carrier concentration, as is generally seen in diluted magnetic semiconductors.[11][14] SdH oscillations are visible above T in (a), while (b) shows oscillations at moderate fields before showing properly quantized Hall plateaus for the lowest temperature (0.35 K - solid line). Deriving the electron concentration from the slope of at low field (), we assign filling factors to the minima of the oscillations occurring at a field , and find that increments by approximately 1 between each oscillation, indicating that the spin degeneracy of the Landau levels has been lifted. However the SdH oscillations are not periodic in ; in other words assigning integral values to makes the product vary with magnetic field. Furthermore, Fig. 1(a) also shows that the SdH minima shift to lower magnetic fields with increasing temperature (bottom to top), as highlighted with arrows in the figure. We emphasize that the magnetic field dependence of is linear before the onset of the quantum Hall effect, indicating that the carrier density does not change with magnetic field.[15] We do note that determined from the slope of the low-field is generally less than that used in the model developed later, and increases slightly as temperature increases. We attribute this discrepancy in part to the anomalous Hall effect (, where is the magnetization) and also to the presence of some parallel conduction above 2.5 K; neither of these affect the positions of the SdH oscillations.
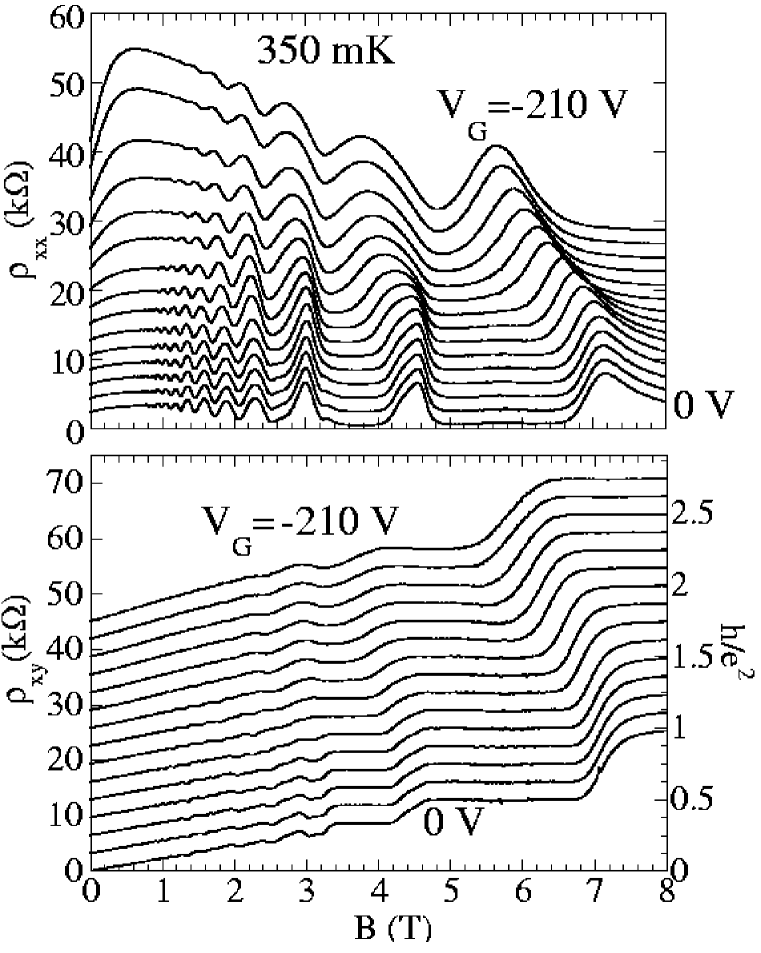
In Fig. 1(a), we have circled a small oscillation around 3.2 T (), preceded by a large peak and accompanied by a distortion of the plateau in at 3 T. The minimum in at 3.2 T is seen up to higher temperatures (4.2 K), while the large minimum at 3.7 T disappears as temperature is increased. A reduction in carrier density (and hence ) using electrostatic gating rapidly destroys the small oscillation (Fig. 2), and makes the SdH oscillations more regular while also dramatically increasing the low field positive and high field negative magneto-resistance. The aperiodicity in inverse magnetic field and shifts with temperature observed in the SdH oscillations are also seen in de Haas – van Alphen (dHvA) oscillations measured using cantilever magnetometry (as shown in Fig. 3(a)).
In order to understand these phenomena, we develop a model based on the LL energy spectrum. In a magnetic 2DEG, the energy of an electron in a LL with spin up (+) or down (-) is given by:
| (1) |
where is the level index, is the cyclotron frequency, and is the spin splitting which follows the empirical form[17]:
| (2) |
Here, is the saturation value of the spin splitting, is the spin-5/2 Brillouin function and is an effective temperature. The Fermi energy is set by the constant number of electrons in the quantum well and is calculated by integrating the DOS with the Fermi-Dirac distribution function , and is calculated by numerically integrating
| (3) |
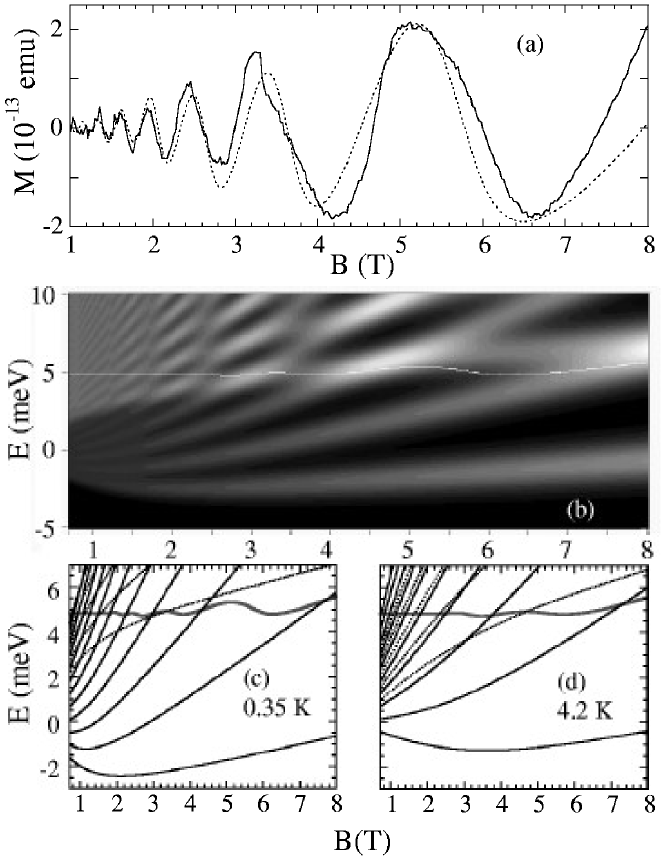
We model the DOS for electrons in the 2DEG using the energy levels of Eq.1 with a broadening due to disorder of width . This model is used to fit the magnetization of the 2DEG, which is proportional to the derivative of the free energy with respect to , and thus is sensitive to the DOS. The best fit parameters at 320 mK (Fig. 3(a)) of meV, K and cm-2 are in good agreement with magneto-photoluminescence measurements and low field Hall measurements. The broadening is assumed to be a gaussian, and fit with a width of meV. An example of the resulting DOS (at T = 0.32 K) is shown as a gray-scale plot in Fig. 3(b). Figures 3(c) and (d) show how the LL energy diagram changes with temperature. Remarkably, as shown for a single temperature in Fig. 3(a) and shown in extensive detail elsewhere,[13] this simple form reproduces the features of the field- and temperature-dependence of the magnetization without any additional parameters.
The extension of this calculation to simulate the magneto-resistance requires choosing a specific form for the density of extended states . We model this density by assuming a LL of index and spin has, at its center, a region of extended states given by a gaussian of width (independent of ). This form phenomenologically accounts for a finite energy spread of the extended states[18] and variable-range hopping conductivity through localized states. [4] The resistivity of each electron spin channel is then calculated independently and is given by
| (5) | |||||
where is the Fermi function and the total DOS and are determined from the magnetization measurements. The sheet resistance includes a prefactor which is assumed independent of the LL index and the spin . This model makes no attempt to account microscopically for the strong positive (at low field) and negative (at higher field) background magneto-resistance seen in all II-VI magnetic semiconductors and attributed to bound magnetic polarons [19] and exchange-enhanced electron-electron interaction effects.[11] The Hall resistance is essentially calculated by counting the number of LLs below and multiplying by the quantum of conductance. The resistance is determined by adding the conductances through each spin channel obtained by inverting the resistance tensor. By using this form for the resistance, we implicitly assume that LL mixing and floating of the extended states are unimportant in this regime, which will be justified by the close agreement of the data to the model. Figures 1(c) and (d) show the simulated and at various temperatures using = 7.2 meV, = 1.55 K, cm-2, and = 0.36 meV T-1/2 – all in good agreement with the parameters used for the magnetization. These parameters model the data well over the whole temperature range, without changing any other parameter. The model also provides a physical basis for understanding the various anomalies observed in the transport data. First, the unusual aperiodicity of the SdH oscillations arises simply from the variable overlap of the extended states as LLs for spin up and down electrons cross; the temperature-dependent shift of the SdH extrema can be traced to the temperature variation of the spin splitting (Eq. 2) which changes the LL spectrum. The negative differential Hall resistance seen at low magnetic fields is a consequence of the addition of conductivities of the two spin channels for conduction. The oscillation at 3.2 T is due to the LL crossing near the field where LL also crosses.[16] As temperature is increased, the spin up level crosses at a higher field due to the decreased spin splitting, allowing the oscillation to be more easily resolved (see Figs. 3(c) and(d)). This oscillation is much smaller than those due to spin down LLs because there are fewer spin up LL s below , causing to be large (Eq. 5). Hence, the spin up LLs contribute less to the overall conductivity than spin down LLs. This effect also explains why the spin up LLs crossing at lower field produce only a slight modulation of the SdH oscillations. The width of the extended states is best fit using widths of meV for spin down electrons and meV for spin up electrons. This difference suggests that the minority spin electrons are more localized than the majority spin electrons and this may influence the low-field positive and high field negative magneto-resistance. Decreasing the sheet density using the electrostatic gate lowers away from the region of the energy diagram where LL crossings occur. Hence, the anomaly at 3 T disappears and the overlap between LLs is decreased overall, leading to more regular SdH oscillations.
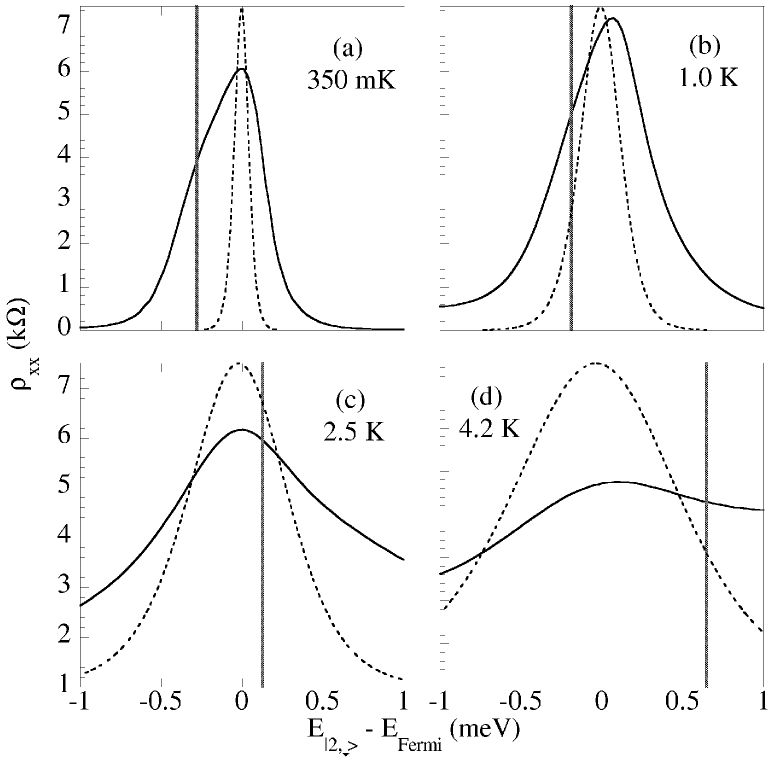
The complementary measurements of magnetization and transport in this study provide a powerful means to determine the shape of the distribution of the extended states. In the preceding discussion, we assumed a specific analytic form for the extended states; however, we can use the resistivity to approximately map out the conducting states directly. In the regime where a spin down LL crosses , the total resistance approximates the spin down channel resistance () and is proportional to the density of conducting states convolved with the derivative of the Fermi function (Eq.4). Using the knowledge of and the LL spectrum obtained from the magnetization, we transform into , where is the energy separation of the center of the LL from . Thus, the combination of data from the two experiments allows a spectroscopy of the conducting states as passes through a LL. Figure 4 shows the temperature dependence of through the LL (about 4.5 T). As the temperature is increased, the LL drops below in this region, leading to a displacement of the shoulder on this peak from low to high energy. The vertical line in each plot indicates the position of the level, i.e. at the point where , and clearly corresponds to the shoulder seen in the peak. As and become degenerate near , no shifting of the peak is seen from zero energy. Such a shift would be evidence for floating of the extended states.[7] The derivative of the Fermi function for each temperature is plotted for comparison, showing the resolution with which this floating of the extended states is excluded. This simple crossing of two LLs of opposite spin, well separated from others, is quite different than the case at low field where all LLs overlap.
Figure 4 also shows that – at low temperatures – a simple delta function for the extended states is not sufficient to explain the data, nor is a finite width to the extended states alone enough to reproduce the data. Variable-range hopping, which gives an exponential form to the conductivity away from the LL center,[20] must be included to give the peaks sufficient width with a shape which matches the data. This justifies the phenomenological gaussian form for used earlier. In a sample whose LL structure does not change with temperature (such as a GaAs/AlGaAs modulation doped quantum well), this method should allow the determination of the full form of the conduction through variable range hopping and extended state transport in the QHE regime.
In summary, measurements of the magneto-resistance and Hall effect in 2DEGs where the spin splitting is comparable to the Fermi level show the effects of accidental degeneracies as LLs cross near the Fermi level. The resulting anomalous SdH oscillations are well described using a model involving extended states centered at each Landau level and two-channel conduction for spin-up and spin-down electrons. The complementary measurement of magnetization and transport measurements on the same sample allow us to probe the location of the extended states away from the SdH minima. The crossing of the LLs at large field does not induce a shifting of the positions of the extended states – which one might expect for “floating” states.
We thank K. D. Maranowski and A. C. Gossard for growth of the GaAs/GaAlAs heterostructure, J. Gupta and I. Malajovich for taking the optical data and S. A. Crooker for help with numerical modeling. This work was supported by NSF grants NSF DMR-0071888 and -0071977, ONR N00014-99-1-0077 and -0071, and AFOSR #F49620-99-1-0033.
References
- [1] R. E. Prange and S. M. Girvin, The Quantum Hall Effect (Springer-Verlag, New York, NY, 1990), 2nd. ed.
- [2] H. W. Jiang et al., Phys. Rev. Lett. 71 1439 (1993); S. H. Song et al., ibid. 78, 2200 (1997).
- [3] I.P. Smorchkova et al., Phys. Rev. B 58, R4238 (1998).
- [4] M. Furlan, Phys. Rev. B 57, 14818 (1998).
- [5] F.D.M.Haldane and K. Yang, Phys. Rev. Lett. 78 ,298 (1997).
- [6] D. E. Khmelnstkii, JETP Lett. 38, 556 (1983); R.B. Laughlin, Phys. Rev. Lett. 52, 2304 (1984).
- [7] I. Glozman, C. E. Johnson, and H. W. Jiang, Phys. Rev.Lett. 74, 594 (1995); S. V. Kravchenko et al., Phys. Rev. Lett.75, 910 (1995).
- [8] X. Y. Lee, H. W. Jiang, and W. J. Schaff, Phys. Rev. Lett. 83, 3701 (1999).
- [9] U. Zeitler et al., Phys. Rev. Lett. 86, 866 (2001).
- [10] D. D. Awschalom and N. Samarth, J. Mag. Magn. Mater. 200, 130 (1999).
- [11] I.P. Smorchkova et al., Phys. Rev. Lett. 78, 3571 (1997).
- [12] R. Knobel et al., Physica E 6, 786 (2000).
- [13] J. G. E. Harris, R. Knobel, K. D. Maranowski, D. D.Awschalom, N. Samarth and A. C. Gossard (unpublished).
- [14] T. Dietl in Handbook on Semiconductors, Vol. 3b, edited by T. S. Moss (North-Holland: Amsterdam, 1994), and references therein.
- [15] For magnetic 2DEG samples with , [12] a qualitatively similar (but quantitatively smaller) shifting of SdH oscillations can result from a magnetic field induced variation in electron sheet density. In that case, the spin splitting significantly perturbs the self-consistent confinement potential for the 2D carriers and decreases as a function of magnetization, allowing more electrons to be drawn to the quantum well at equilibrium [A. B. Oparin and J. J. Quinn, Solid. State Commun. 98, 971 (1996)]. However, such variation in carrier density causes an overall negative curvature in which is not seen here.
- [16] A similar anomaly – also possibly related to a LL crossing – has been reported in a CdMnTe-based 2DEG – see J. Jaroszynski et al., Physica E 6, 790 (2000).
- [17] J. A. Gaj, R. Planel, G. Fishman, Solid State Commun. 29,435 (1979).
- [18] S. Das Sarma and Dongzi Liu, Phys. Rev. B 48, 9166 (1993); M. Hayne et al., Phys.Rev. B 56, 10446 (1997).
- [19] A. G. Petukhov, M. Foygel, Phys. Rev. B 62, 520 (2000).
- [20] D. G. Polyakov and B. I. Shklovskii, Phys. Rev. B 48, 11167 (1993).