Metastable states of a driven flux lattice in a superconductor with strong pins
Abstract
The flux lattice driven by a uniform driving force in a superconductor with hot, strong, sharp and randomly distributed pinning centers, with applied magnetic field half the matching field is simulated. At low temperature both a non activated regime, where flux motion occurs within a robust percolative flux flow channel, and an activated regime are obtained depending on the sample preparation. These two regimes exhibit distinct resistivity and magnetic induction. In the non activated regime, a clear fingerprint is observed in the autocorrelation function of the longitudinal resitivity, which oscillates at a frequency close to the inverse lattice diffusion time.
pacs:
PACS numbers: 74.60.GeI Introduction
High-temperature superconductors have revealed a complex static vortex lattice phase diagram in the temperature-magnetic field (or disorder strength) plane, and it is now well established, both theoretically and experimentally, that at least three distinct phases are present : the high temperature liquid phase, the quasi-ordered and the glassy solid phases at low temperature for low and high magnetic field respectively[1, 2, 3]. Introducing a driving force as a third axis, leads to the even more complex dynamic phase diagram of a driven vortex lattice. A theoretical insight on this situation has been given in refs. [4, 5, 7, 8, 9, 10]. The emerging picture is the existence, for increasing drive, of creep, plastic and moving solid regimes[6]. The moving solid, once thought a ’moving crystal’ within the perturbation theory[7], was found to be a ’moving glass’ in which vortices flow along elastically coupled channels[9, 10]. Such a theoretical work has widely benefited from the comparison with numerical experiments. Simulations first demonstrated the existence of a plastic flow regime within channels for the highly defective lattice[11, 12, 14], yielding non-linear I-V characteristics[5, 15]. Dynamic phase transitions or crossovers between the plastic regime and moving solids for lattices driven by a uniform external force were put into evidence in refs [7, 16, 17, 18, 19]. The case of the field gradient driven lattice (Bean state) was extensively studied by F. Nori et al (see e.g. ref. [20] and refs therein). Besides these effort to determine a univoque dynamic phase diagram for the driven lattice, some evidence exist for the existence of multiple metastable states. Indeed, the static glass is characterized by the existence of infinite barriers that prevent the exploration of the entire phase diagram and the existence of a degenerated ground state. As a consequence, one might also expect that the driven lattice can show multiple metastable states close to the static glassy phase, i.e. in the plastic regime. Such a behavior was observed in ref. [21], where it was shown at zero temperature that some filamentary flow channels are stable in a finite range of driving force. The transition between different flow channels structures as the driving force is varied was shown to result in steps in the curves. In the following, I show that a random distribution of strong pinning centers allows for the realization of metastable states of the disordered driven lattice at non zero temperature.
II Experimental details
A two dimensional lattice submitted to a uniform driving force in the presence of ’hot pins’ is simulated. A semi-infinite sample is considered. Two opposite edges of the sample are submitted to the external magnetic field, , which is simulated by an extra force acting on each vortex, perpendicular to the sides of the sample. The force acting on a vortex at a distance from the edge is the one imposed by a semi-infinite vortex lattice at a distance , where is the flux lattice spacing at the equilibrium. Whenever the force acting on a vortex situated at the sample edge is directed towards the inside of the sample, this new vortex is introduced. The other two edges of the sample are subject to a periodic boundary condition, thus simulating a semi infinite geometry.
Flux lines are assumed rigid rods. This correctly modelizes a layered superconductor with decoupled layers, or a three dimensional material with a large line energy. The force per unit length between vortices separated by a distance is[22]:
| (1) |
where is a Bessel function. This is a good approximation strictly only in the case of vortex lines (rods) and for 2D vortices a logarithmic interaction should be used. In the present case, the more rapid decrease of the Bessel function allows us to cut the interaction between vortices at a distance and save computation time.
Strong pinning centers are randomly distributed in the sample. The density of the pinning sites is , with the flux quantum and the ’matching field’ for which an equilibrium flux line lattice shows the density of flux lines . The pinning sites are assumed normal cylinders parallel to the applied field, with radius . The situation where, at low temperature, the vortex core radius is smaller than and pinning is due essentially to the reduction of the core energy when the line sits on the pin is considered. The force per unit length exerted by a pin at a distance to the line is given by:
| (2) |
where is the line energy, and . The pinning force is exactly balanced by the Lorentz force, , for . From eq. 1 and 2, the energy scale for vortex repulsion is and the one for pins attraction is .
The temperature in the whole sample is assumed zero, excepted on the pinning sites (’hot pins’ model). That is, thermally activated depinning from the pinning centers is present, while thermal fluctuations of the unpinned vortices are absent. Within such a model, there is no melting of the flux line lattice, and the contribution of the thermal fluctuations of the unpinned vortices to depinning is neglected. During the simulation, the force acting on the vortices, and the corresponding activation barrier for the lines which are pinned, are computed. The equation of motion:
| (3) |
is applied for a time step small enough so that vortex displacements within this interval are much smaller than . For the pinned vortices, escape from the wells proceeds according to the Arrhenius exponential probability. During the simulation, the vortices trajectories are registered, as well as the resistivity, normalized to its flux flow value :
| (4) |
In the rest, the driving current is normalized to and the thermal energy to the pinning energy . A sample of dimensions along the driving current and perpendicular to it was studied. The following superconducting parameters were used: , , , , yielding , and G. This situation, using the terminology in ref.[22], is the one of random, sharp () and strong () pins close to the matching field.
III Results and Discussion
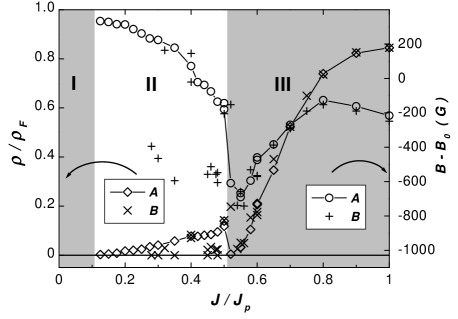
I have first computed the resistivity and the induction at using two different procedures (Fig.1). Both procedures start from a regular hexagonal lattice at equilibrium with the external magnetic field and . In the first procedure, the driving current is first set to . It is then decreased by steps down to . A steady state - characterized by a steady resistivity and induction - is allowed to settle at each step. In the second procedure, the driving current is directly set from zero the measuring value. I denote A and B these two procedures, and and the associated resistivity. From these experiments, it is possible to distinguish three regimes. I: for , and . II: for , and is found randomly on two branches, one of them coinciding with , the other being zero or close to zero. III: for , both procedures yield similar non zero values. The existence of a clear transition between regimes II and III is also clearly put into evidence by procedure A only, as both and the induction show a marked discontinuity (Fig.1). In regime II, the existence of two branches for procedure B mirrors in the induction which also splits into two distinct curves, one of them coinciding with the one obtained with procedure A. For all regimes, no Bragg peaks could be detected from the time-average structure factor and flux lines ordering is amorphous. Vortices trajectories in regimes II and III both consist in irregular channels, characteristic of plastic motion[11, 12, 13].
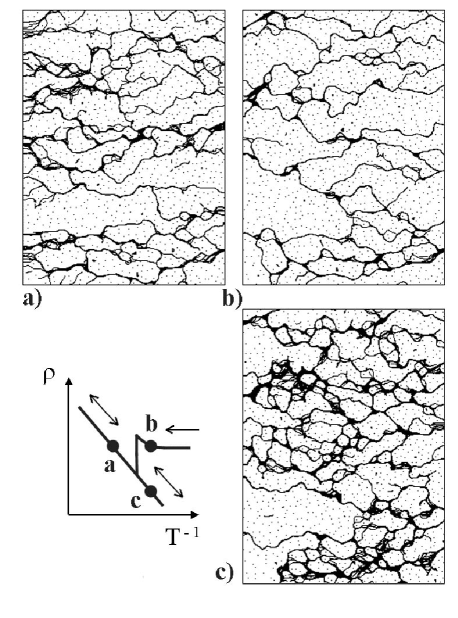
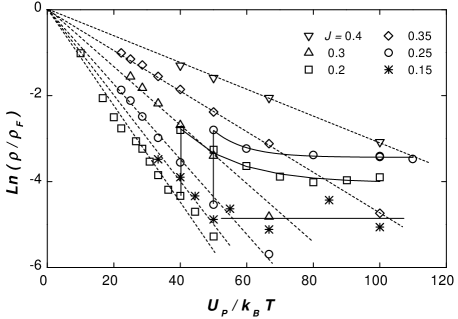
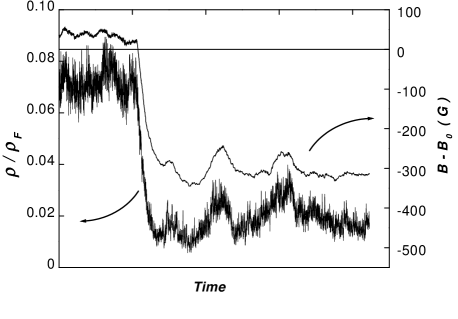
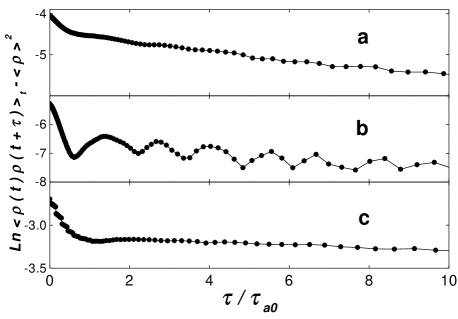
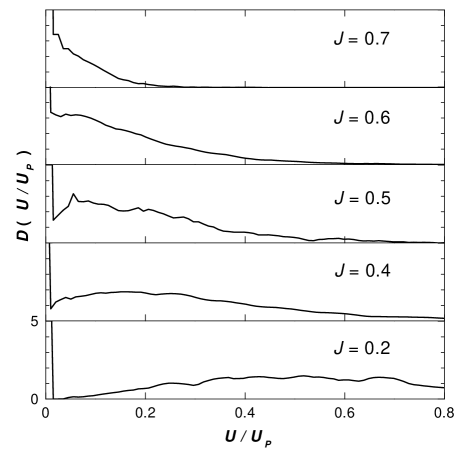
I now argue that the upper branch of the resistivity in regime II is anomalous with respect to thermal activation for depinning. Heating a sample with on the branch from to finite values yields an exponentially activated resistivity (Fig. 3). The activation energy is found up to one order of magnitude lower than the one in a one-dimensional model, , which is due to the inhomogeneous screening current in two dimensions. In a striking different way, the upper branch of the resistivity is found stable when temperature is increased, until the system switches to the activated branch. Comparison of the vortices trajectories for the activated regime and the non-activated one shows little difference (Fig. 2), but the autocorrelation function of the resistivity noise, , exhibits oscillations at a frequency close to the inverse lattice diffusion time, , in the case of the non-activated regime (Fig.5). This is the signature of the coherent motion of vortices within flux flow channels, whereas activated motion tends to randomize flux line motion. The distribution of the activation energy for single vortex depinning, as shown in Fig.6 (we are here only concerned by individual depinning, inherent to our thermal model), provides further indication that the upper branch of the resistivity could be stable against thermal depinning. It is clear from this data that, as one enters regime II, the distribution splits into a dirac function at for the unpinned vortices, and a wide component that peaks at a non zero value with a gap at low energy. It is then appealing to credit the observed stability at low temperature of the pinned ’edifice’ to the existence of this gap. On the other hand, I have observed that two different runs where the sample is heated from the branch can yield two slightly different temperatures for the switch to the activated regime. Also, as can be seen in Fig. 4, the system may spontaneously switch from the apparently stable non-activated regime to the activated one at a constant temperature. Whether the flux flow channels are truly stable upon thermal excitations or there is an increase beyond the experimental window of some relaxation time is thus an open question.
Clearly, the existence of regimes II and III is related to the possibility for the flux lattice to store elastic energy (proportional to in Fig.1) in the compression (II, ) or the extension mode (III, ), as the transition between these two regimes coincides with the one between these modes (Fig.1). In the same way, in regime II, the unactivated branch involves the compression mode, whereas the activated one involves the extension mode, as in regime III. This is also clearly seen in Fig.4, where bursts in the resistivity after the system has switched to the activated mode correlate with the ones of the induction. Then, both the existence of two distinct regimes and of the anomalous unactivated branch for the resistivity are a consequence of the applied field being close to the matching field: for lower ratio , I expect regime II to shrink.
Finally, the characteristic frequency for correlated motion within flux flow channels may be evaluated from the conventional Bardeen-Stephen expression for flux flow resistivity, yielding . I consider the case of 2H-NbSe2 which is a good candidate for the experimental realization of the above situation, as it exibits low depinning critical current for as-grown crystals, as well as a small line energy. We first need to evaluate the depinning current at the transition between regimes I and II, . At this point, the driving force on the flux flow channel is balanced by the shear force exerted on it by the pinned lattice : , i.e. . Using parameters in section II, we obtain , in reasonable agreement with the experimental data (Fig. 1). Going back to the case of 2H-NbSe2, using Oe, and cm for the normal state resistivity[24, 23], one obtains A cm-2 and kHz. For induction larger than a few G, is well above the critical current density usually observed for as-grown crystals[23], so that pinning by natural defects should not prevent the observation of flux motion within the channels. However, the characteristic frequency strongly exceeds the bandwidth of conventional four probes transport measurements.
In conclusion, it was shown that a random distribution of pinning centers with applied field close to the matching field allows for the preparation of two competitive regimes of the disordered driven flux lattice, within a large range of driving force. One of them involves non activated flux flow motion within channels, which are found robust against moderated thermal depinning. This regime shows characteristic oscillations of the autocorrelation function of the longitudinal resistivity at a frequency close to the inverse lattice diffusion time.
REFERENCES
- [1] M. Feigel’man, V. Geshkenbeim, A. Larkin and V. Vinokur, Phys. Rev. Lett. 63, 2303 (1989).
- [2] A. Houghton, R.A. Pelcovits and A. Sudbo, Phys. Rev. B 40, 6763 (1989).
- [3] T. Giamarchi and P. LeDoussal, Phys. Rev. B 55, 6577 (1997).
- [4] T. Nattermann, Phys. Rev. Lett. 64, 2454 (1990).
- [5] An-Chang-Shi and A.J. Berlinsky, Phys. Rev. Lett. 67, 1926 (1991).
- [6] U. Yaron, P.L. Gammel, D.A. Huse, R.N. Kleiman, C.S. Oglesby, E. Bucher, B. Batlogg, D.J. Bishop, K. Mortensen, K.N. Clausen, Nature. 376, 753 (1995).
- [7] A.E. Koshelev and V.M. Vinokur, Phys. Rev. Lett. 73, 3580 (1994).
- [8] L. Balents, M.P.A. Fisher, Phys. Rev. Lett. 75, 4270 (1995).
- [9] T. Giamarchi, P. Le-Doussal, Phys. Rev. Lett. 76, 3408 (1996).
- [10] P. LeDoussal and T. Giamarchi, Phys. Rev. B 57, 11356 (1998).
- [11] E.H. Brandt, Phys. Rev. Lett. 50, 1599 (1983).
- [12] H.J. Jensen, A. Brass and A.J. Berlinsky, Phys. Rev. Lett. 60, 1676 (1988).
- [13] H.J. Jensen, A. Brass, Y. Brechet and A.J. Berlinsky, Phys. Rev. B 38, 9235 (1988).
- [14] A. Brass, H.J. Jensen and A.J. Berlinsky, Phys. Rev. B 39, 102 (1989).
- [15] S. Bhattacharya and M.J. Higgins, Phys. Rev. B 49, 10005 (1994).
- [16] K. Moon, R.T. Scalettar and G.T. Zimanyl, Phys. rev. Lett. 77, 2778 (1996).
- [17] R. Seungoh, M. Hellerqvist, S. Doniach, A. Kapitulnik and D. Stroud, Phys. Rev. Lett. 77, 5114 (1996).
- [18] C.J. Olson,, C. Reichhardt and F. Nori, Phys. Rev. Lett. 81, 3757 (1998).
- [19] A.B. Kolton, D. Dominguez and N. Granbech-Jensen, Phys. Rev. Lett. 83, 3061 (1999).
- [20] C.J. Olson, C. Reichhardt, F. Nori, Phys. Rev. Lett. 80, 2197 (1998).
- [21] N. Gronbech-Jensen, A.R. Bishop and D. Dominguez, Phys. Rev. Lett. 76, 2985 (1996).
- [22] E.H. Brandt, J. Low Temp. Phys. 53, 41 (1983).
- [23] W. Henderson, E.Y. Andrei, M.J. Higgins and S. Bhattacharya, Phys. Rev. Lett. 77, 2077 (1996).
- [24] S. Bhattacharya, M.J. Higgins and T.V. Ramakrishnan, Phys. Rev. Lett. 73, 1699 (1994).