Thermodynamic and Transport Properties of Superconducting
Abstract
Transport and thermodynamic properties of a sintered pellet of the newly discovered superconductor have been measured to determine the characteristic critical magnetic fields and critical current densities. Both resistive transition and magnetization data give similar values of the upper critical field, , with magnetization data giving at the transition temperature of . Close to the transition temperature, magnetization curves are thermodynamically reversible, but at low temperatures the trapped flux can be on the order of one Tesla. The value of at is estimated to be about , a value similar to classical superconductors like Sn. Hence, the Ginsburg-Landau parameter . Estimates of the critical supercurrent density, , using hysteresis loops and the Bean model give critical current densities on the order of . Hence the supercurrent coupling through the grain boundaries is comparable to intermetallics like .
pacs:
74.25.Bt, 74.25.Fy, 74.25.Ha, 74.60.Ge, 74.60.JgI Introduction
With the discovery of superconductivity in at about by Akimitsu and co-workers,[1] there is an opportunity to study superfluid transport and phase locking of conduction electrons in a whole new class of materials. In early studies of the isotope effect,[2] Bud’ko and co-workers found the superconducting transition temperature, , increased from for to for giving a partial isotope exponent for the isotope relation where is the isotope mass. This is a clear indication that the phonons are playing an important role in the superconducting interaction. In addition, band structure calculations[3] indicate a rather isotropic electrical transport in spite of the very layered appearance of honeycombed boron and hexagonal magnesium networks in the material.
The purpose of this letter is to report measurements of the critical fields of this material to get an estimate of the characteristic length and energy scales for comparison with the classical superconductors like Nb and the high temperature superconductors, like . A second goal is to obtain some measure of the supercurrent transport through grain boundaries for comparison with the high temperature superconductors where there are serious weak link problems with the grain boundaries.
II Experiment
A sintered pellet of was made by sealing a stoichiometric mixture of and in a Ta tube and heating to for two hours.[2] Magnetization was measured with a Quantum Designs SQUID magnetometer with a scan length on a piece from the same batch of material reported previously.[2] Electrical resistance between and in applied magnetic field up to was measured in a Quantum Designs PPMS-9 apparatus on another piece from the same batch using standard four probe ac resistance technique at and a current density of . Electrical contacts were made with Epo-tek silver epoxy.
III Results and discussion
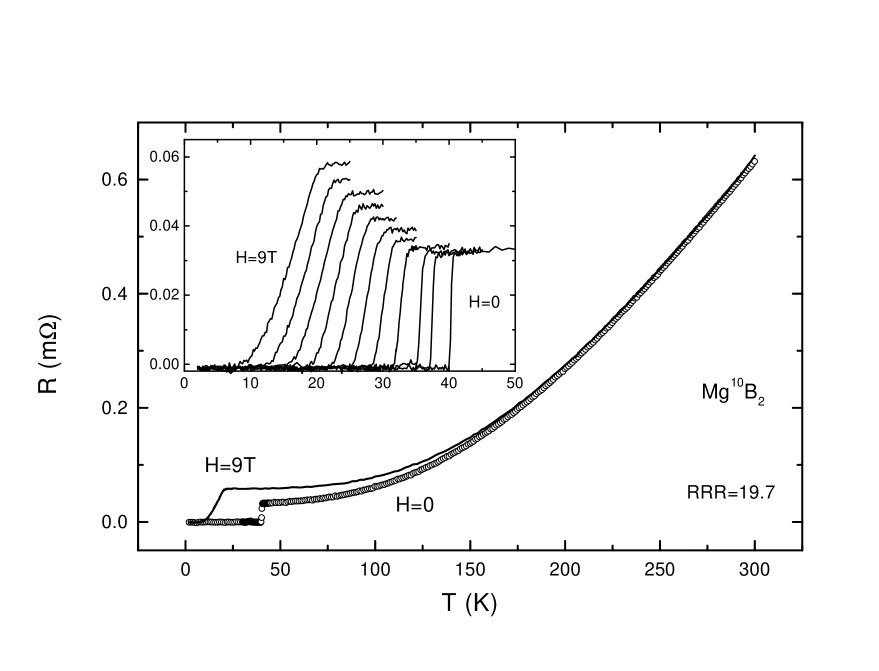
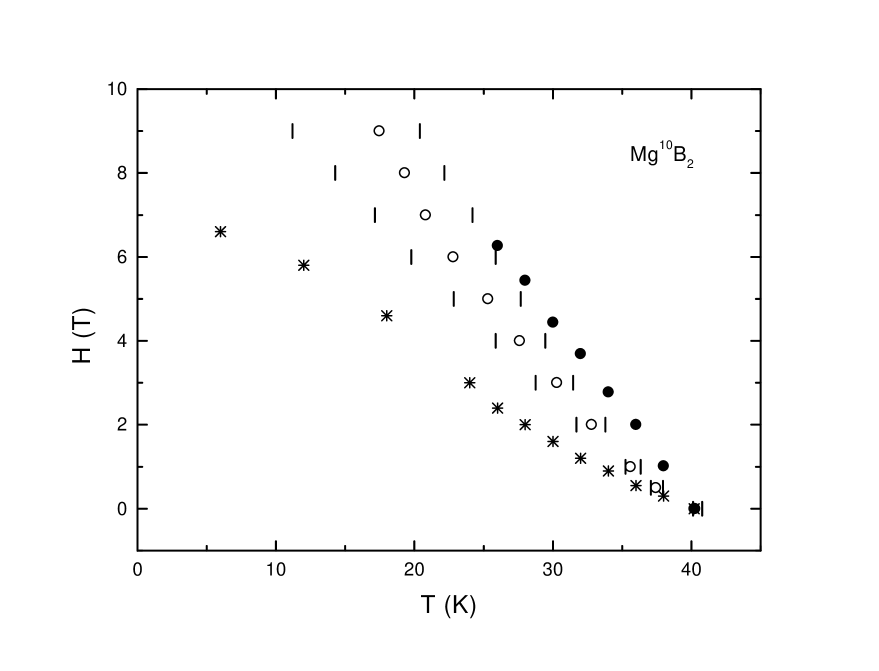
The temperature dependent electrical resistance of the material from to , shown in Fig. 1, roughly obeys power law in the normal state. The residual resistance ratio (RRR) is approximately , which is relatively high for a sintered polycrystalline sample. Near , the data show considerable flux-flow broadening as shown by the inset in Fig. 1 where the scans range from to . Transition widths gradually broaden from at field to at indicating a broad region of flux-flow resistivity.[4] The extent of this flux-flow regime is delineated by the onset and completion temperatures shown in Fig. 2 by the vertical dash lines.
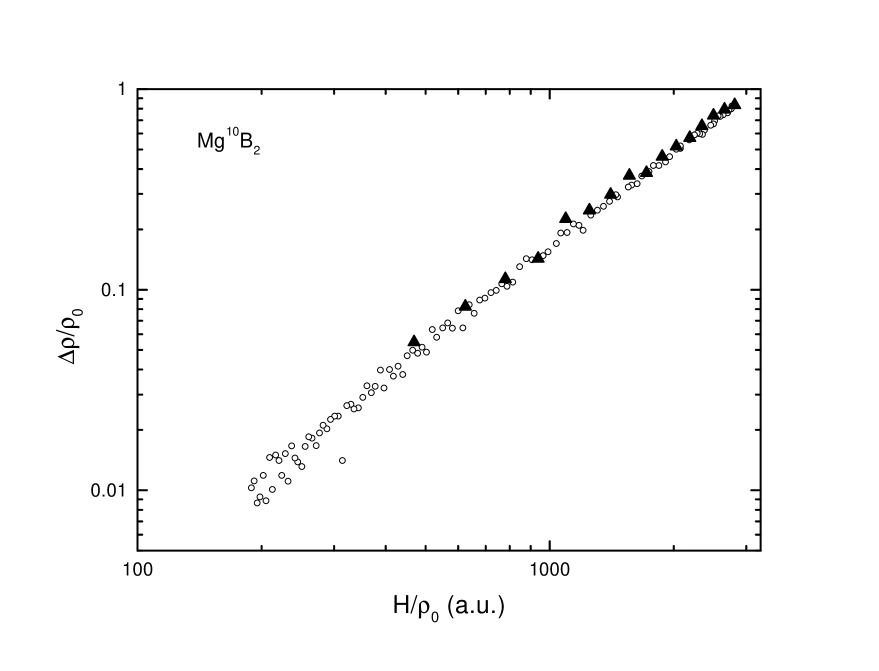
Possibly the most interesting aspect of these data is the strong magnetoresistance which shows the resistance at rising approximately percent in . If these data are plotted on a Kohler Plot shown in Fig. 3, the curve is a straight line for the change of temperature at constant field (open circles) and for changing field at constant temperature (solid triangles). This observation is consistent with the observed magnetoresistance being a band effect and intrinsic to the sample.
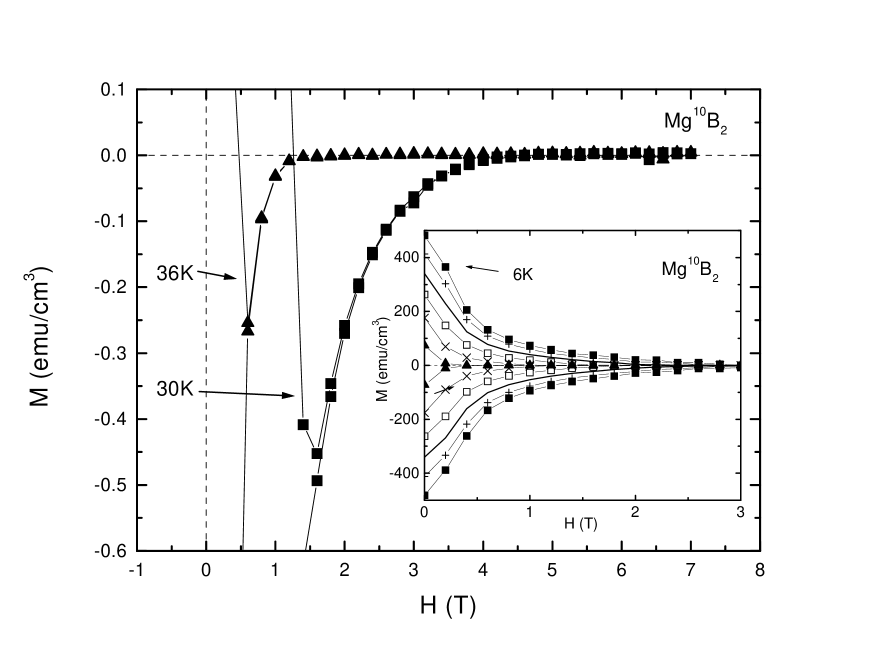
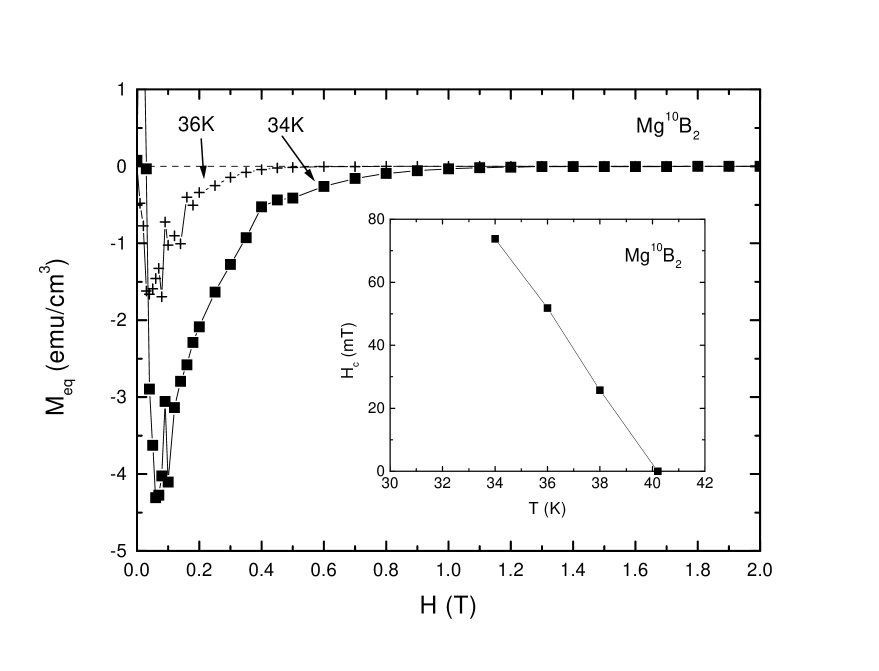
Magnetization data are exemplified by the and runs in Fig.4. For the run, the magnetization abruptly departs from the background at and is reversible to an accuracy of one percent of the magnetization down to . Because the background magnetization is very small, linear in magnetic field, and independent of temperature between and , this correction is easily made and and are fairly easy to measure. At , the magnitude of the background is about and the correction can be made to an accuracy of . The inset shows that the irreversible magnetization over a fuller temperature range. In the inset, the x-symbols show the data and show that about or about flux is trapped at zero field. At , shown by the solid squares of the inset, the trapped flux at zero applied field for this rather porous granular pellet is or over .
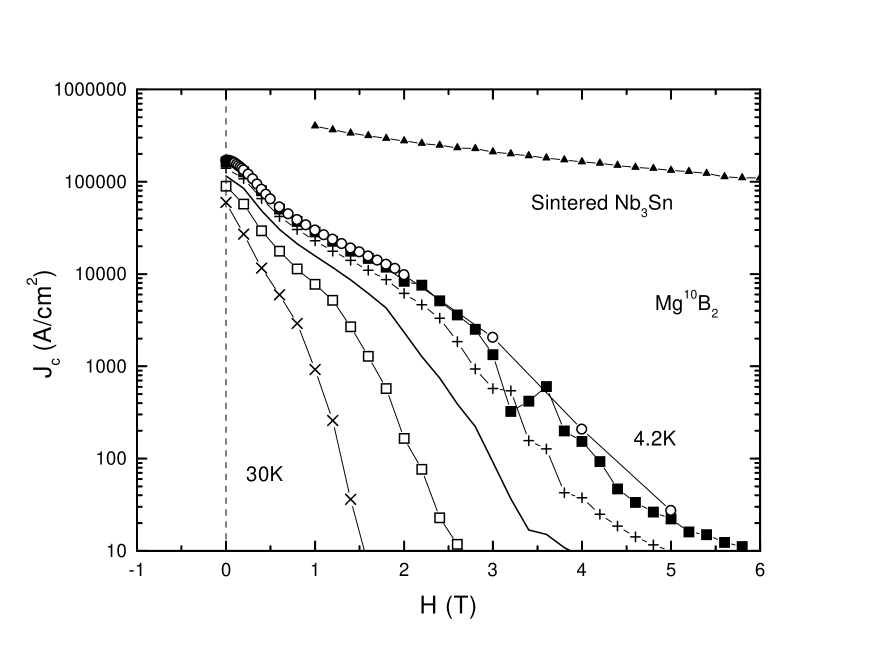
Using the Bean[5] model with , the critical current densities of Fig. 5 can be derived. Here, is in , in , and the sample radius, , in . These values are not as high as a sintered pellet of ,[5] but the grain-to-grain supercurrent coupling is rather promising. A scanning electron microscope picture of a fracture surface of the pellet shows grain size running from about to . The grains are somewhat faceted plates and many small grains are equiaxed. From the magnitude of the measured screening currents, it is clear that the proper to put in the Bean model is the full sample diameter and not the grain size. The sample radius is about .
Close to , there is a reasonable range of thermodynamic reversibility, so an estimate has been made of vs. . To do this, it is assumed that the flux pinning in decreasing magnetic field is the same as in increasing magnetic field and an equilibrium magnetization is defined as the average of the average of the increasing field magnetization and the decreasing field magnetization by . Willemin and co-workers[6] have shown the validity of this procedure. A plot of in Fig.6 shows behavior close to that predicted by Abrikosov.[7] Integrating the area under these magnetization curves gives the curve shown in the inset of Fig. 6. From the slope of , one can calculate the jump in specific heat at to be . This is consistent with the direct specific heat measurements published earlier[2] from which can be estimated to be about .
IV Conclusions
The transport and magnetization studies of give very consistent measures of for this material with magnetization data giving a slope at of . The magnetization agrees with the onset of the resistive transition, and the broadened resistive transitions seem to reflect a flux-flow resistivity phenomenon. Close to , the values of the can be estimated and the slope is found to be . This then means that the Ginsburg-Landau parameter, . By estimating to be , the low temperature coherence distance, is found to be . Using the relation , the penetration depth, .
The critical current densities for this rather porous sintered sample are on the order of at . This would seem to indicate that grain boundaries can transmit rather large supercurrents.
V Acknowledgments
We would like to thank M. J. Kramer and F. Laabs for the electron microscope pictures, and V. G. Kogan for useful discussions. C. Petrovic and C. E. Cunningham also made valuable contributions. Ames Laboratory is operated for the U. S. Department of Energy by Iowa State University under contract No. W-7405-ENG-82 and supported by the DOE, the Office of Basic Energy Sciences.
*On leave from Commissariat a l’Energie Atomique, DRFMC-SPSMS, 38054 Grenoble, France.
REFERENCES
- [1] J. Akimiitsu, Symposium on Transition Metal Oxides, Sendai, January 10, 2001; J. Nagamatsu, N. Nakagawa, T. Muranaka, Y. Zenitani, and J. Akimitsu (to be published).
- [2] S. L. Bud’ko, G. Lapertot, C. Petrovic, C. Cunningham, N. Anderson, and P. C. Canfield, Phys. Rev. Lett. (in press).
- [3] J. Kortus, I. I. Mazin, K. D. Belashchenko, V. P. Antropov, and L. L. Boyer, cond-mat/0101446.
- [4] Y. B. Kim and M. J. Stevens, Superconductivity, Ed. R. D. Parks, 1969, Marcel Dekker, Inc, New York, p 1149.
- [5] C. P. Bean, Phys. Rev. Lett. 8, 225 (1962).
- [6] M. Willemin, C. Rossel, J. Hofer, H. Keller, A. Erb, and E. Walker, Phys. Rev. 58, R5940 (1998).
- [7] A. A. Abrikosov, Zh. Eksp. Teor. Fiz. 32, 1442 (1957) [Sov. Phys. JETP 5, 1174 (1957)].