Far-Infrared Excitations below the Kohn Mode:
Internal Motion in a Quantum Dot
Abstract
We have investigated the far-infrared response of quantum dots in modulation doped GaAs heterostructures. We observe novel modes at frequencies below the center-of-mass Kohn mode. Comparison with Hartree-RPA calculations show that these modes arise from the flattened potential in our field-effect confined quantum dots. They reflect pronounced relative motion of the charge density with respect to the center-of-mass.
pacs:
71.45.Gm,78.55.Cr,78.66.-wAccording to the generalized Kohn’s theorem the far-infrared (FIR) response of a quantum dot with parabolic external potential in a magnetic field consists, independent of the number of electrons in the quantum dot, of only two modes with dispersion:Maksym90:108
| (1) |
Here describes the external potential, is the cyclotron frequency, the effective mass. One mode, , increases with increasing magnetic field and approaches the cyclotron frequency , the other mode, , decreases in frequency with decreasing magnetic field. Both modes represent rigid center-of-mass motion of all electrons in the dot. This behavior is actually very often observed in experiments on quantum dots which are prepared from semiconductor heterostructures.sikorski89.1 ; meurer92.2 The reason being the electrostatic environment causing the external potential to have a nearly perfect parabolic shape. In other experiments, in particular on etched quantum dots with a larger number of electrons and a more hard-wall type of external potential, one observes additional sets of modes at higher frequencies (see for example Ref.demel90.1, ). Such a mode spectrum can be calculated using a mean field approach and random phase approximation (RPA).Gudmundsson91:12098 They can be visualized in terms of ‘confined’ plasmon modes, for example in the model of Fetter fetter86.1 (See also below for details).
We have performed experiments on field-effect-confined quantum dots in AlGaAs/GaAs-heterostructures. We find in FIR experiments additional modes below the high-frequency Kohn mode, , which are, however, definitely higher than . The cyclotron resonance itself is not observed for these isolated dots. We compare our experiments with self-consistent Hartree calculations. From this comparison we find that the new modes arise from the flattened external potential in our field-effect-induced quantum-dot array. Our calculation shows that this new mode represents a dipole active charge-density oscillation involving strong relative motion of the electrons with respect to the center-of-mass.
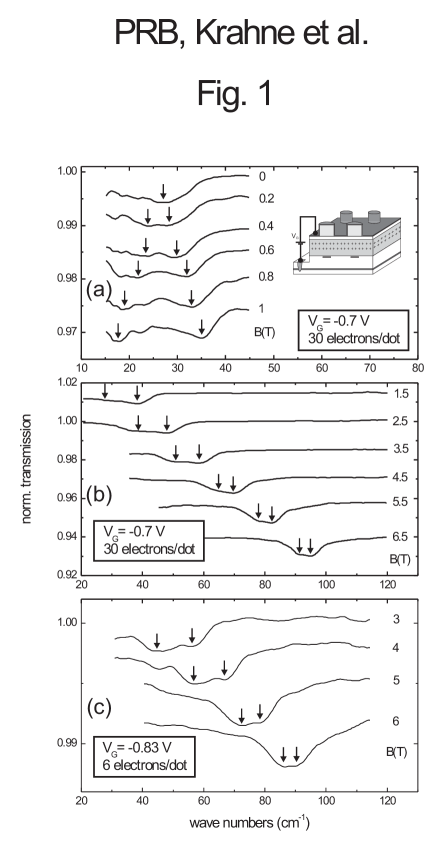
Quantum-dot arrays were prepared from modulation-doped Al0.33Ga0.67Al-GaAs heterostructures with a heterostructure interface-to-surface distance of 55 nm. A Si- doped layer was grown 300 nm underneath the AlGaAs-GaAs interface and served as a backgate to charge the quantum dots. The sample design is sketched in the inset of Fig. 1. The electron density and mobility at 1.8 K were cm-2 and cm2/Vs, respectively. A photoresist-dot array was prepared by holographic lithography onto the sample surface with a period of nm, the diameter of the photoresist dots was 150 nm and the height about 170 nm. A 7 nm semitransparent Ti gate with 3 mm diameter was evaporated onto the photoresist dot array. The gate voltage was applied between the topgate and the -doped backgate. The latter was contacted outside the active mesa where the AlGaAs-GaAs was removed by wet etching. The experiments were performed in a superconducting magnet cryostat connected by wave guides to a Fourier transform spectrometer. We show in the following the normalized transmission , where is the threshold value at which the electron system is totally depleted. The spectral resolution was set to 1 cm-1. The temperature was 1.8 K.
Experimental spectra for a dot array with = 30 electrons per dot are shown in Fig. 1. This electron number can be determined from the known oscillator strength at high magnetic fields ( T in our case), see for example Refs.sikorski89.1, and meurer92.2, . Spectra taken at small magnetic fields are displayed in Fig. 1(a). For T one resonance is observed which splits into two modes with increasing magnetic field. One mode increases with increasing , the other decreases. This behavior can be well understood by the rigid center-of-mass motion of the electrons in the dot described in the introduction. In Fig. 1(b) we find for higher magnetic fields clearly an additional resonance below the dominant mode. At smaller in the regime from 1.5 T to 3.5 T this additional feature at the low-energy side of the mode is very broad and might consist of one or more resonances. At higher magnetic fields T clearly a double-peak structure is observed, i.e., one mode in addition to the mode. For the lower mode we notice that it increases faster in frequency than the higher mode (i.e., they are not parallel) and that its resonance half width decreases with . Figure 1(c) shows spectra of the same sample at a gate voltage where we have 6 electrons per dot. Here again we observe, at high magnetic fields, a distinct double-peak structure where the energetically lower mode increases more rapidly in frequency with increasing . Since the behavior of the additional resonance is qualitatively the same for 30 and for 6 electrons we conclude that it is an intrinsic property of the electron system for our potential that does not depend significantly, at least at larger , on the electron number.
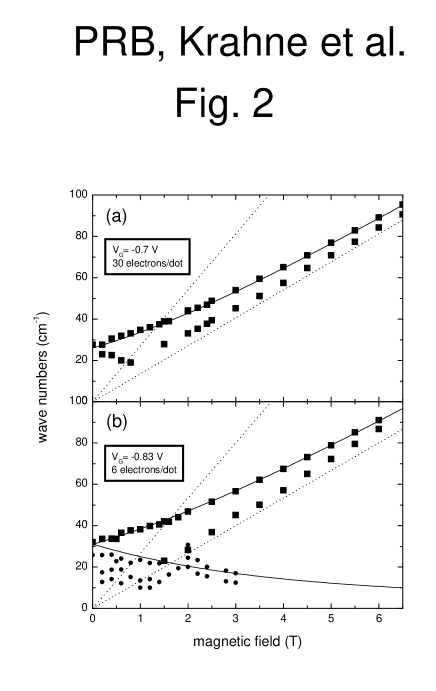
The magnetic-field dispersions extracted from the spectra are plotted in Fig. 2. We have fitted the lower branch and the sharper high-frequency branch with the dispersion expected from the Kohn theorem for a parabolic external potential according to eq. (1). From this equation we can also determine . The cyclotron resonance itself is, as expected for isolated dots, not observed. The new mode has a frequency, which is definitely larger than . The observation of a new mode, in addition to the Kohn modes, implies that the external potential is not parabolic. Actually, since the external potential is formed by the field effect of our modulated gate, we expect that it should be flattened at higher energies were it eventually overlaps with the neighboring dots of the array.
To confirm this explanation and to get a deeper microscopic insight into this new type of excitation we have performed self-consistent Hartree calculations for differently shaped potentials and calculated the dynamic response within the RPA. The details of the applied formalism have been described in a previous publication.gudmundsson95.1 We have modeled an external potential, with a soft bottom and a step that flattens for higher energy, by the expression
| (2) |
where is the radial coordinate scaled by the effective Bohr radius nm in GaAs and
| (3) |
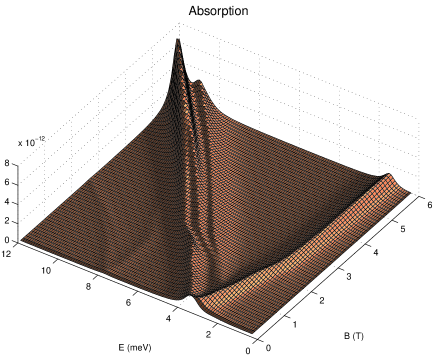
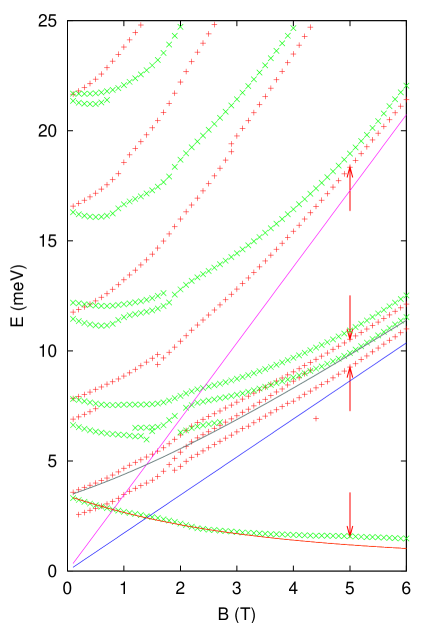
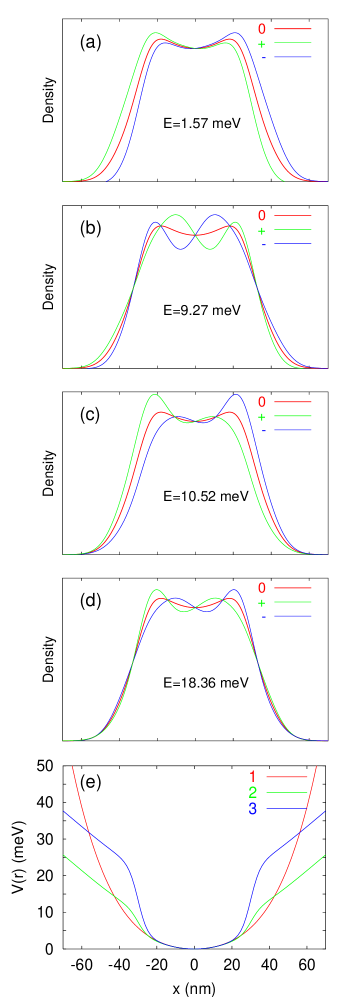
with . This potential for meV, meV, and meV will be shown later in Fig. 5. The calculated FIR absorption is plotted in a 3D plot in Fig. 3. The dispersions of modes with an oscillator strength larger than on the scale of Fig. 3 is plotted in Fig. 4. We see from these figures that the absorption is dominated by the strong Kohn modes.
In the regime between 1 to 2 T we have obtained in the calculation a very complex mode spectrum. In this regime interaction with Bernstein modes occurs which has been extensively discussed previously.gudmundsson95.1 We will not elaborate on this here. We note that indeed also the experimental dispersion, see Fig. 2(b) at small , shows a complex mode spectrum which seems to be very sensitive on the electron number, in particular whether or not we have partially or completely filled shells, and on the shape of the potential. So it is very hard to develop a detailed picture here. However, with increasing magnetic field the new mode is clearly resolved both in the experiment and the calculation. To get a microscopic insight into this new mode we have calculated in Fig. 5 the equilibrium density and the induced density. The latter is the density induced by the FIR dipole field in a certain moment of time. The induced density for the and modes shows indeed a nearly perfect rigid displacement which justifies that we call these modes still ‘Kohn modes’. However, the new mode represents a complex charge oscillation with several nodes. This is clearly an internal relative motion of the involved electrons.
In many other experiments, in particular on quantum dots defined in etched structures, also additional modes have been observed, however, with frequencies higher than the Kohn mode (see for example Ref.demel90.1, ). They follow approximately the dispersion given by the model of Fetterfetter86.1 , who finds for a circular disk of a two-dimensional electron system (2DES) with density :
| (4) |
with
| (5) |
where is the radius of the disk and the effective dielectric function of the surrounding media.
These modes might be visualized in the model of ‘confined’ plasmons. Actually, if one looks into the calculated absorption in Fig. 3, one sees, very faintly, but clearly resolved on an enlarged scale, modes which start at about 8 meV at and split with increasing , as expected from eq. (4) and (5). Obviously, both experiments and calculations show that such excitations are very weak in potential with a flattened profile. We have also calculated the induced density for these ‘confined’ plasmons, see Fig. 5(d). This mode of course also involves relative electron motion. However, this motion is different from the one of the new mode, with 9.27 meV in Fig. 5(b), it has additional nodes in the lower part of the flanks.
We have calculated the absorption strengths for several differently shaped potentials in order to understand under which conditions pronounced low-frequency modes or high-frequency ‘confined’ plasmon modes occur. We have calculated the FIR absorption for a potential with a large value of meV. We find that such a potential produces, except for coupling with Bernstein modes, nearly only the two Kohn modes, no lower frequency mode and extremely weakly the higher-frequency ‘confined’ plasmon modes. It was already pointed out by Ye and Zaremba Ye94:17217 that the observation of only the Kohn modes is not a good test to rule out terms in the potential. We have also performed calculations for our potential with a steeper step, = 18 meV in eq.(3). For 5 and 6 electrons we find stronger high frequency modes, but also very pronounced below-Kohn modes. From the experimental experience it seems to be necessary to have a quantum dot with a larger number of electrons, which usually requires also a dot of larger size, to observe the higher frequency ‘confined’ plasmons. One reason of course is that, since the intensity of these modes is very weak, for example 0.03 of the Kohn mode in Ref.demel90.1, , one needs a large number of electrons to have enough signal strength to observe these resonances. Under these conditions one has, at least so far, not observed the below-Kohn mode. Perhaps, the large number of electrons has then changed the electrostatic environment of the dots in a way that does not allow the formation of these modes.
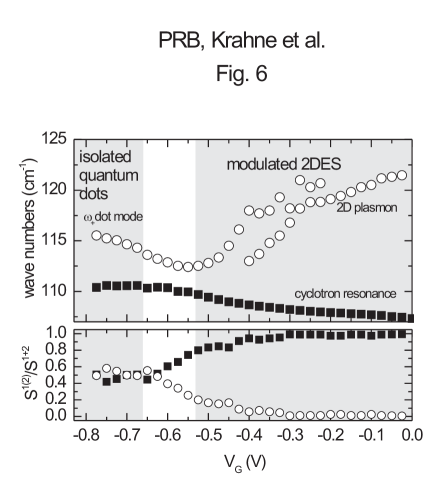
Finally we would like to discuss an additional interesting finding for the new mode. In the upper panel of Fig. 6 we show the resonance positions extracted from spectra taken at a fixed magnetic field = 8 T for different gate voltages. In the lower panel we have plotted the relative absorption strength, , = 1,2, where and are the integrated experimental absorption strengths of, respectively, the upper and lower mode. At = 0 we have a continuous 2DES and observe the cyclotron resonance at the frequency and additionally a magnetoplasmon resonance at a slightly higher frequency. Also at = 0, we have a small density modulation of the 2DES with period . Due to the grating-coupler effect of this periodic modulation, 2D plasmons with wave vector are excited. With decreasing gate voltage and correspondingly decreasing averaged 2D density the plasmon frequency decreases. In the regime from = -0.5 V to -0.25 V the dispersion undergoes several anticrossing with Bernstein modes. At about -0.55 V the dispersion increases again. Here isolated dots are formed and the resonance develops into the Kohn mode of the quantum dot. At the same time, the cyclotron resonance increases in frequency and, interestingly, develops into the new below-Kohn mode that we have discussed here. So in this interpretation one could say that the below-Kohn mode has its origin in the cyclotron resonance. However, one can interpret the disperion also in the following way. The high-frequency 2D plasmon undergoes, with decreasing gate voltage, an anticrossing with the increasing cyclotron resonance which develops, in this picture, into the Kohn mode. This picture is supported by the observation that the high oscillator strength of the lower-frequency cyclotron resonance is transferred to the high-frequency Kohn mode. Such an transfer of oscillator strength is typical for an anticrossing behavior.
Although, we want to be cautious in drawing a conclusive interpretation concerning the character of the below-Kohn mode from the interesting gate voltage dependence in Fig. 6, there are other experimental findings supporting the anticrossing hypothesis for the data in Fig 6: At high magnetic fields the induced density of the new mode (Fig. 5b) is reminiscent of that of the first confined plasmon in an electron slab with hard boundaries;Dempsey92:1719 The dipole moment originates essentially from the portion of the density distribution in the center part of the dot just before the steeper edges. The induced density that is relevant to the restoring force is therefore sampling an average potential curvature of the dot near the center. In contrast to this, the Kohn mode is sampling an average potential curvature that includes the edges, leading to a higher energy.
In summary, we have investigated field-effect-confined quantum-dot arrays. We find new modes below the Kohn mode. From comparison with Hartree-RPA calculations we can trace the origin of this excitation back to the flattened potential in this field-effect-confined quantum dots. We show that microscopically this excitation involves a complex relative motion of the electrons in the dot. Interestingly, related phenomenons have been reported in the far-infrared absorption in a non-parabolic one-dimensional quantum well wire with steep edge boundaries.Wixforth94:215
We gratefully acknowledge support from the German Science Foundation DFG through SFB 508 “Quanten-Materialien”, the Graduiertenkolleg “Nanostrukturierte Festkörper”, the Research Fund of the University of Iceland, and the Icelandic Natural Science Council.
References
- (1) P. A. Maksym and T. Chakraborty, Phys. Rev. Lett 65, 108 (1990).
- (2) C. Sikorski and U. Merkt, Phys. Rev. Lett. 62, 2164 (1989).
- (3) B. Meurer, D. Heitmann, and K. Ploog, Phys. Rev. Lett. 68, 1371 (1992).
- (4) T. Demel, D. Heitmann, P. Grambow, and K. Ploog, Phys. Rev. Lett. 64, 788 (1990).
- (5) V. Gudmundsson and R. Gerhardts, Phys. Rev. B 43, 12098 (1991).
- (6) A. L. Fetter, Phys. Rev. B 33, 3717 (1986).
- (7) V. Gudmundsson, Arne Brataas, Peter Grambow, Bernd Meurer, Thomas Kurth and Detlef Heitmann, Phys. Rev. B 51, 17744 (1995).
- (8) Z. L. Ye and E. Zaremba, Phys. Rev. B 50, 17217 (1994).
- (9) J. Dempsey and B. I. Halperin, Phys. Rev. B 45, 1719 (1992).
- (10) A. Wixforth et al., Semicond. Technol. 9, 215 (1994).