Phonon anomalies and electron-phonon interaction in RuSr2GdCu2O8 ferromagnetic superconductor: Evidence from infrared conductivity.
Abstract
Critical behavior of the infrared reflectivity of RuSr2GdCu2O8 ceramics is observed near the superconducting = 45 K and magnetic = 133 K transition temperatures. The optical conductivity reveals the typical features of the -axis optical conductivity of strongly underdoped multilayer superconducting cuprates. The transformation of the Cu-O bending mode at 288 cm-1 to a broad absorption peak at the temperatures between = 90 K and is clearly observed, and is accompanied by the suppression of spectral weight at low frequencies. The correlated shifts to lower frequencies of the Ru-related phonon mode at 190 cm-1 and the mid-IR band at 4800 cm-1 on decreasing temperature below are observed. It provides experimental evidence in favor of strong electron-phonon coupling of the charge carriers in the Ru-O layers which critically depends on the Ru core spin alignment. The underdoped character of the superconductor is explained by strong hole depletion of the CuO2 planes caused by the charge carrier self-trapping at the Ru moments.
pacs:
74.25.Kc,74.72.Jt,75.50.-y,71.38.HtI Introduction
The layered ruthenate-cuprate compound RuSr2GdCu2O8 (Ru-1212 ) is a subject of intense interest as a unique model system to study the interplay between superconductivity and ferromagnetism. A ferromagnetic (FM) moment of the Ru-O layers coexists with superconductivity originating from the Cu-O bilayers over a broad temperature range.[1, 2, 3, 4, 5] Long-range magnetic-order in Ru-1212 is established at TM = 133 K. Recent neutron-diffraction and magnetization studies[6, 7] display that in zero external magnetic field the magnetic order of the Ru moments is predominately antiferromagnetic along the -axis with spin canting in the -plane. The net in-plane magnetic moment is most likely due to the rotations of the RuO6 octahedra. It is suggested that there is a field-induced spin reorientation, and that already at moderate fields the order becomes predominately ferromagnetic. At the same time transport and heat-capacity measurements show that Ru-1212 behaves like a typical underdoped cuprate superconductor with the onset of superconductivity at = 45 K and clearly exhibits a number of features arising from the presence of a normal state pseudogap. [5]
The importance of -axis charge dynamics for the high superconductivity still remains controversial.[8, 9] Many aspects of the -axis transport properties of superconducting (SC) bilayer compounds like YBa2Cu3O7-δ (Y-123) have been explained with a model invoking the onset of inter- and intrabilayer Josephson junctions.[8, 10, 11] From this point of view, Ru-1212 presents a unique opportunity to investigate, how the SC Cu-interbilayer coupling propagates through magnetic Ru-layers.
A more specific question concerns the hole doping of the CuO2 planes required for the superconductivity in Ru-1212 compound. The hole doping obtained from bond-valence summations based on the refined crystal structure amounts 0.4 per Cu atom, and results from an overlap of the Ru: and the Cu:3d bands. [3] However, the hole doping of the CuO2 planes derived from transport and heat-capacity measurements points towards 0.1.[5] This discrepancy probably reflects hole-trapping and/or strong scattering by the ferromagnetic Ru moments.
The present work aims to address these issues by studying the critical behavior in the infrared (IR) optical conductivity of the Ru-1212 ceramics near the superconducting () and magnetic () transition temperatures. The optical conductivity of Ru-1212 reveals the typical features of the -axis optical conductivity of underdoped multilayer superconducting cuprates: Namely, the transformation of the Cu-O bending mode into an additional broad absorption peak below a characteristic temperature = 90 K, significantly above , which is accompanied by the relative suppression of the optical conductivity spectral weight at low frequencies. In addition, a distinct polaron-shaped band at about 4800 cm-1 dominates the mid-IR conductivity. On decreasing temperature the increase of the total spectral weight associated with the intraband transitions is significantly enhanced below . The correlated shifts of the phonon mode at 190 cm-1 and the mid-IR band to lower frequencies below = 133 K provide experimental evidence in favor of strong electron-phonon coupling of the charge carriers in the Ru-O layers which is governed by the magnetic order.
II Experimental
Polycrystalline Ru-1212 samples were synthesized by solid-state reaction from high purity RuO2, SrCO3, Gd2O3, and CuO powders, as described in details elsewhere.[12, 5] At the final stage of the preparation the sample in the form of a pressed pellet was annealed at 1060 ∘C for 6 days in flowing oxygen and was polished to optical quality. X-ray diffraction confirms that the sample is single-phased with a tetragonal structure. The temperature-dependent magnetization[12] of the Ru-1212 samples reveals a magnetic transition temperature = 133 K. A large value of diamagnetic shielding is seen below 28 K. The resistivity is similar to that reported recently by Tallon et al.,[5] and shows the onset of a superconductivity at = 45 K with zero resistivity below 32 K. The temperature dependence of the resistitvity above exhibits two different regimes with for and for with a crossover temperature 90 K.
Near-normal incidence reflectivities in the far-IR region from 30 to 750 cm-1 were measured using a ”Bruker” IFS 133v spectrometer with the newly designed Ge-coated 6 mylar beamsplitter. This significantly increased the signal-to-noise ratio and avoided to merge the spectra at phonon frequencies. To extend the reflectivity measurements to higher frequencies, a ”Bruker” IFS 66v/S spectrometer was used covering the frequency range from 600 to 16000 cm-1 , the higher frequency limit being restricted by calibrating the reflectivity against the gold-coated sample. The sample was mounted in the ”Oxford Optistat” He bath cryostat for the measurements from 10 to 300 K.
III Experimental results and discussion
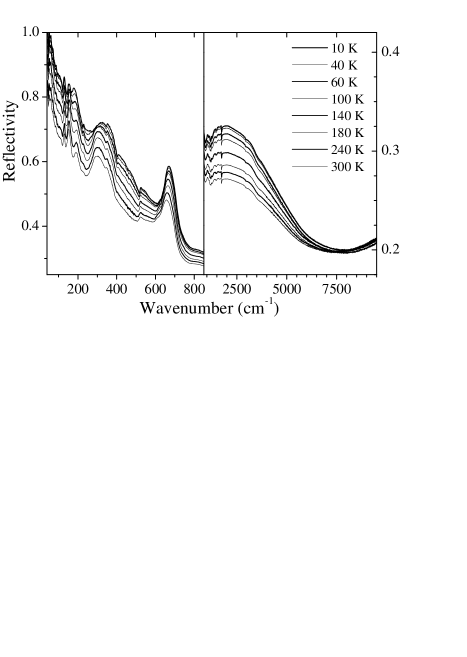
The reflectivity spectra of Ru-1212 for wavenumbers up to 9000 cm-1 and for different temperatures from 10 K to 300 K are shown in Fig. 1. As the temperature decreases from 300 to 10 K, the reflectivity displays a gradual increase, consistent with an increase of the sample conductivity. Below the SC transition temperature the far-IR reflectivity is noticeably enhanced. This increase is reproducible and amounts 3%. The reflectivity becomes close to unity at frequencies below 70 cm-1 in the SC state. Comparing to the reflectivity spectra of Ru-1212 ceramics reported recently by Litvinchuk et al.,[13] our data show a noticeably higher (up to 10 - 20 %) reflectivity level in the spectral range under investigation. At all temperatures investigated five optical phonon modes near 128, 151, 190, 288, and 654 cm-1 are clearly observed. It is well established[13, 14, 15] that the modes appearing in the spectra of anisotropic ceramics correspond to phonon modes polarized along -axis. The -plane response from phonons in the reflectivity spectra (left panel, Fig. 1) becomes apparent as additional small step-like features at 225, 352, and 520 cm-1 .
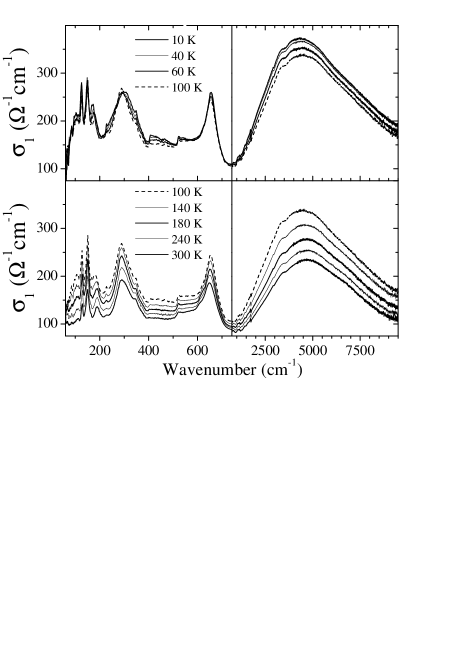
To obtain the optical conductivity via Kramers-Kronig analysis, we used a continuous low-frequency extrapolation of the reflectivity to , utilizing the formula , with . The lower and upper limits of correspond to the Hagen-Rubens extrapolation for the normal state and the extrapolation for the SC state, respectively. However, there is no influence of the different extrapolations on the resulting optical conductivity for wavenumbers 70 cm-1 . For wavenumbers higher than 16000 cm-1 , an extrapolation using a frequency dependence was used. The real part of the optical conductivity of Ru-1212 for different temperatures is shown in Fig. 2 (: upper panels; : lower panels). At room temperature the five distinct IR-active phonon modes at 128, 151, 190, 288, and 654 cm-1 are superimposed on a featureless electronic background of 100 cm-1 , consistent with the room temperature conductivity value. The electronic background extends to higher frequencies and a broad mid-IR band appears at 4800 cm-1 .
The infrared-active phonons observed in the Ru-1212 ceramics (Fig.2, left panels) can be assigned similarly as reported for the -axis optical phonons in Y-123 crystals.[14, 15, 16] Indeed, Ru-1212 is structurally similar to the rare-earth cuprate superconductors like Y-123 except that the Cu-O chain layers are replaced by RuO2 square planar layers. Ignoring the rotations of the RuO6 octahedra, an approximate structure is then of tetragonal symmetry . A comparison with the IR-spectra of Y-123 suggests that the phonon mode at 654 cm-1 involves primarily the apical oxygen vibrations, whereas that at 288 cm-1 is related to the Cu-O bending mode which involves vibrations of the oxygen ions of the CuO2 planes. We suggest the three low-frequency modes at 128, 151, and 190 cm-1 to be assigned to the displacements of Cu, Gd, and Ru, respectively. Indeed, the Cu-related mode at 128 cm-1 is close in frequency to the in-plane Cu vibrations at 104 cm-1 in Y-123 crystals. The eigenfrequency of the Gd mode at 151 cm-1 agrees with that of rear-earth (R) related phonon mode in R-123 cuprates, where it is strongly R-dependent decreasing from 193 cm-1 in Y-123 to 162 cm-1 in Er-123 in accordance with mass ratio of the R ion. The assignment is confirmed by shell-model calculations for Ru-1212 with a space group, reported recently by Litvinchuk et al..[13] These model calculations also suggest that the mode at 190 cm-1 involves primarily Ru-ion vibrations against the Cu ions.
In order to determine the resonant frequencies of the observed phonon modes and the mid-IR band parameters at all temperatures, we applied a quantitative dispersion analysis by fitting both the reflectivity and optical conductivity spectra. The model dielectric function consists of a sum of Lorentzian functions, accounting for the contributions from the low-frequency phonon modes at 128, 151, and 190 cm-1 and the mid-IR band as well. Additionally, the almost featureless electronic background at frequencies below 800 cm-1 was included in a Kramers-Kronig consistent way into the fitting procedure using a sum of five broad Lorentzian bands with halfwidths more than 150 cm-1 . We have found that the two high-frequency phonon modes, mostly related to oxygen vibrations, are noticeably asymmetric in shape. The asymmetric phonon feature at 654 cm-1 can be described by the Fano profile (see e.g. Ref.[17]), given by , with , and are the line-width and the resonant frequency, and denotes the amplitude which is related to the oscillator strength as . The dimensionless Fano parameter is a measure of the asymmetry of the peak and for a Lorentzian line shape is recovered. The asymmetry of the band at 654 cm-1 yields 0.19 at all temperatures in accordance with the Fano-profile description. A single resonance description fails for the strongly asymmetric phonon feature around 288 cm-1 , and we used two Lorentzian profiles to describe this band. The complex nature of the asymmetric structure involving the Cu-O bending mode at 288 cm-1 will be verified by a detailed analysis of its temperature dependence.
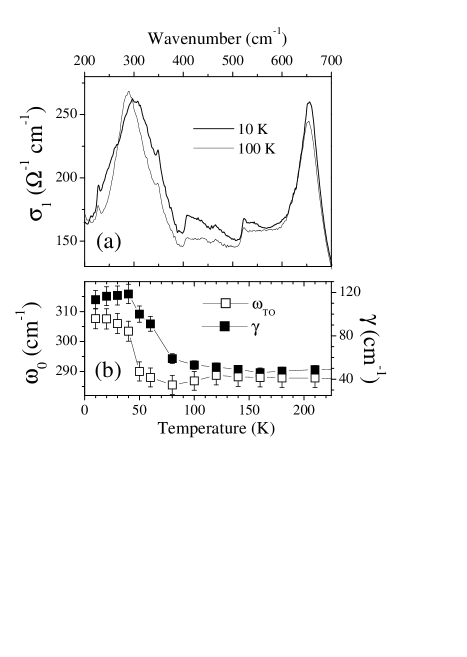
Analyzing the temperature dependence of the optical conductivity of Ru-1212 , we emphasize its striking resemblance of the -axis conductivity of strongly underdoped SC Y-123 cuprates. Figure 3 shows the most apparent feature related to the onset of superconductivity which is the transformation of the bending mode at 288 cm-1 (light solid curve in Fig. 3(a): = 100 K) to a broad band centered at 308 cm-1 (heavy solid curve in Fig. 3(a): = 10 K). Figure 3(b) shows the detailed temperature dependence of the peak position of the asymmetric structure involving the 288 cm-1 mode and of the Lorentzian damping factor of the fitting curve, which properly describes the low-frequency wing of the structure. The transformation of the band profile starts at around 90 K, close to defined above, being well below the magnetic transition temperature = 133 K, but also well above = 45 K. The most pronounced changes are observed at , as can be clearly seen from the temperature dependence of the band position (open squares in Fig. 3(b)). This behavior involving an anomaly of the Cu-O bending mode, accompanied by the formation of an additional broad absorption band at phonon frequencies, is well studied in the -axis IR-conductivity of underdoped layered cuprates.[10, 11, 18, 19] The mechanism of this phenomenon is a subject of ongoing discussions.[8, 9, 10, 19] The most favored explanation is based on a model where the bilayer cuprate compounds are treated as a superlattice of inter- and intrabilayer Josephson junctions.[8, 10, 11] In this model the additional absorption peak is related to the transverse bilayer plasmon, while the anomalous softening and the loss of the spectral weight of the Cu-O bending mode are explained to be due to the drastic changes of the local electrical fields acting on the in-plane oxygen ions as the Josephson current sets in. The gradual onset of the anomalies above is explained due to the persistence of a coherent superconducting state within the individual copper-oxygen bilayers, whereas the steep and sudden changes at occur when the macroscopically coherent superconducting state forms. This effect is strongly dependent on the doping level and is not observed in the optimally doped and overdoped Y-123 samples. For the strongly underdoped YBa2Cu3O6.45, the transverse optical plasmon and the bending mode merge, forming a single highly-asymmetric peak. Comparing the temperature dependence of the asymmetric peak in Ru-1212 at 288 cm-1 with the data reported by Munzar et al. for YBa2Cu3O6.45 (see Fig. 3 of Ref.[10]) we find a striking similarity. The present observation suggests a strongly underdoped character of the weakly coupled cuprate biplanes and a strong anisotropy of the Ru-1212 compound. At the same time, the pronounced anomaly of the bending mode observed right at implies that the Ru-1212 is a bulk superconductor at lower temperatures. This experimental evidence is important seeing the onset of a bulk superconductivity in Ru-1212 is still very much disputed.[2, 21]
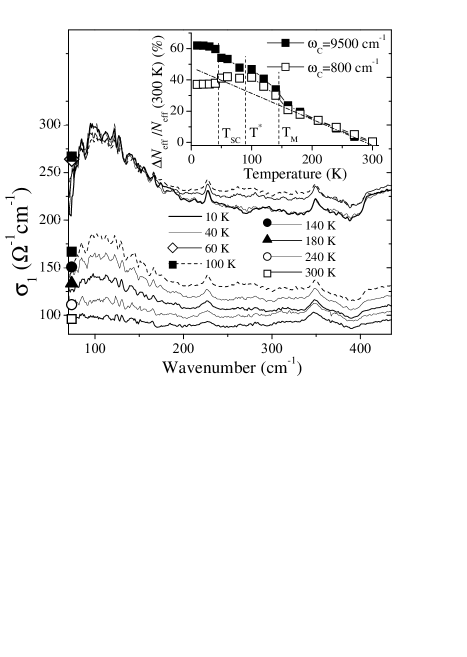
Another well-known feature of the underdoped cuprate superconductors is a suppression of spectral weight (SW) at low frequencies already above due to the opening a normal state pseudogap.[20] This feature is not clearly observed in Ru-1212 . On the contrary, as shown in the left panels of Fig. 2 the electronic background at low frequencies increases continuously as the temperature is lowered from 300 K to 100 K, and remains almost constant below 100 K. The weak suppression in the electronic background conductivity below 400 cm-1 for 100 K is shown in Fig. 4. However, the actual value of the effect depends on the assumptions made when the phonon-related features are subtracted. The relative suppression of the low frequency SW (LSW) evaluated below 800 cm-1 becomes more evident when compared with the total SW (TSW) evaluated up to frequencies of 9500 cm-1 . The inset of Fig. 4 shows the relative changes of the SW with decreasing temperature from 300 K, expressed in terms of the effective electron density per unit cell
| (1) |
where is the IR conductivity after subtraction of the phonons and the volume of the unit cell () is . The effective carrier densities with = 9500 cm-1 and = 800 cm-1 evaluated at 300 K are 0.12 and 0.005, respectively. As shown in the inset of Fig. 4, the temperature dependence of the LSW fully reproduces that of TSW for . On further decreasing temperatures the TSW continues to increase, whereas the LSW remains constant or even slightly decreases. We suggest that the discrepancy in the temperature dependences of the LSW and TSW reflects the opening of the pseudogap in Ru-1212 superconductor. However, the effect is not very pronounced because of a significant contribution from the polaron-like mid-IR band to the LSW.
The mid-IR band reveals the shape of a small polaron with a clearly resolved maximum at 4800 cm-1 at 300 K corresponding to a polaron binding energy of about 0.3 eV. The most remarkable features of this band are the anomalies which occur at the onset of ferromagnetic order within the Ru-O layers at = 133 K, namely, the shift to lower energies from 4800 cm-1 at K to 4400 cm-1 at K and a strong increase in the SW. The inset of Fig. 4 shows that the TSW contributed mainly from the mid-IR band increases continuously on decreasing temperature and reveals an anomaly at , as indicated by a significant deviation from the guideline which roughly approximates the high-temperature dependence. The ferromagnetism in Ru-O layers is believed to have the same origin as in SrRuO3, which, in turn, is explained by itinerant-electron ferromagnetism based on band theory.[22] The Ru ion in SrRuO3 is in a tetravalent low-spin state ( = 1). The ferromagnetic coupling between Ru ions is transmitted via the itinerant electrons of the minority band, the charge carrier transport being strongly dependent on the core spin alignment. In Ru-1212 the minority band is partially occupied due to the hole doping of the CuO2 biplanes resulting in weak itinerant ferromagnetism. Assuming that the mid-IR band is associated with the hopping conductivity of the minority electrons, the strong carrier-spin interaction can naturally explain the temperature behavior of the band. As T is decreased below the resulting onset of ferromagnetic correlations leads to an increase of the kinetic energy of the charge carriers, which, in turn, results in a decrease of the effective electron-phonon coupling. As a result, an increase in the TSW and a shift of the polaronic band to lower frequencies are observed. Note that this behavior of the SW is typical of magnetoresistive FM compounds like the doped manganites,[23] and has been discussed in terms of a temperature-dependent competing effects between electron-phonon coupling and double-exchange interaction of core spins mediated by itinerant electrons.[24]
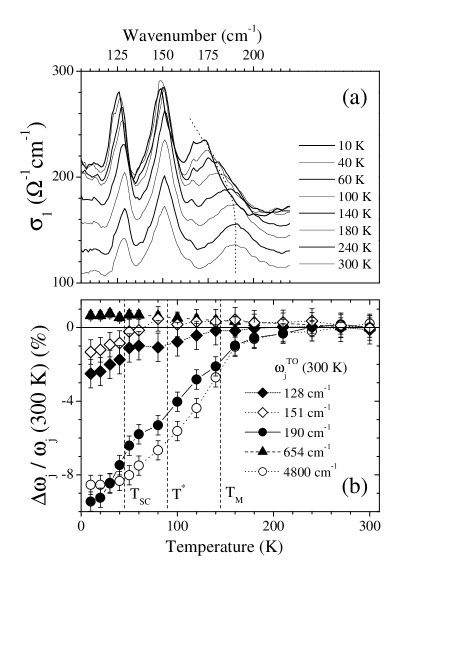
A further important feature associated with the magnetic transition in Ru-1212 is the anomalous shift of the Ru-related phonon mode at 190 cm-1 as shown in Fig. 5(a). In Fig.5(b) we show the relative shifts of the low-frequency phonon modes at 128, 151, and 190 cm-1 along with the shift of the apical oxygen phonon mode at 654 cm-1 and the broad mid-IR band at 4800 cm-1 observed on decreasing temperature from 300 K. Among all phonon modes, only the apical oxygen mode exhibits the classical inharmonic increase of the eigenfrequency on decreasing temperature, revealing anomalies neither at nor at . At the same time the low-frequency phonon modes show a characteristic softening at as observed in Y-123 related compounds, and as discussed in terms of the resonance-frequency renormalization of the phonon modes lying below the SC gap.[14] However, the most pronounced effect is the anomalous softening of the mode at 190 cm-1 which is related to the magnetic transition temperature in Ru-1212 compound, as shown in Fig. 5. The anomalous shift of the phonon mode at 190 cm-1 , reaching a relative value of 10% at the lowest temperatures, cannot be explained by structural changes of the bond lengths observed in Ru-1212 ,[4] all being less than 0.5%. This fact indicates that the Ru-related phonon mode is strongly affected by the interaction with the electronic system. It is important to note that the shifts of the phonon mode at 190 cm-1 and the polaronic band at 4800 cm-1 exhibit apparently correlated character, indicating a strong coupling of this phonon mode to the low-energy electronic excitations, as clearly demonstrated in Fig. 5(b) The onset of this effect at the magnetic transition temperature and the decrease of the electron excitation energy on lowering temperature below TM can be explained by the renormalization of the electron-phonon coupling: The kinetic energy of the itinerant electrons increases due to the onset of the ferromagnetic correlations in the Ru-O layers. This scenario can in turn explain the underdoped character of the stoichiometric Ru-1212 superconductor, where the strong hole depletion of the cuprate bilayers is caused by the charge carrier self-trapping on the Ru moments. We should note finally that as seen in Fig 5(b), the 4800 cm-1 band has the anomaly at on decreasing temperature with saturation below , while the 190 cm-1 mode exhibits a singularity at about 90 K and further steep softening associated with the SC transition. This suggests that the bilayer plasmon-phonon coupling responsible for the anomaly of the Cu-O bending mode could also play a role in the softening of the 190 cm-1 mode. To shed light on the origin of the predominant contribution, the detailed analysis of the mode eigenvectors is necessary, as well as of the temperature dependence of the oscillator strength and the damping factor. The accurate analysis of the temperature dependences will be possible after Ru-1212 single crystals have been prepared. On the other hand, the Ru-1212 system could provide an intriguing opportunity to develop the model of the bilayer Josephson plasmon for the case when the ferromagnetic moment is in the insulating RuO2 plane mediated the cuprate bilayers. Further investigations of the phonon anomalies in Ru-1212 is promising to study the effect of the Ru magnetic moment ordering tuned by applying an external magnetic field on the interbilayer coupling.
IV Conclusions
In conclusion, we have investigated the optical conductivity of Ru-1212 . The transformation of the Cu-O bending phonon mode at 288 cm-1 in the normal state to an absorption ”bump” at 308 cm-1 in the SC state has been observed. This observation strikingly resembles data reported recently for the strongly underdoped YBa2Cu3O6.45 crystals, which were explained with a model invoking the onset of interbilayer and intrabilayer Josephson junctions. The present observation evidences a strongly underdoped character of the bulk superconductivity originated in weakly coupled cuprate biplanes. The optical conductivity of Ru-1212 is discussed in terms of a two-fluid model, the far-IR and conductivity being predominantly associated with the conductivity in the CuO2 planes, whereas the mid-IR conductivity being associated with the hopping conductivity in the Ru-O layers. The correlated anomalous shifts of the Ru-related phonon mode at 190 cm-1 and the polaron band at 4800 cm-1 to lower frequencies have been observed on decreasing temperature below the = 133 K. The underdoped character of the stoichiometric Ru-1212 superconductor is explained by the strong hole depletion of the cuprate bilayers caused by the charge carrier self-trapping on the Ru moments.
Acknowledgements.
This work has been supported by the BMBF/VDI via contract number EKM/13N6917, partly by the Deutsche Forschungsgemeinschaft via the Sonderforschungsbereich 484 (Augsburg) and partly by the DAAD.REFERENCES
- [1] C. Bernhard et al., Phys. Rev. B59, 14099 (1999).
- [2] C. Bernhard, J. L. Tallon, E. Brücher and R. K. Kremer, Phys. Rev. B61, R14960 (2000).
- [3] A. C. McLaughlin et al., Phys. Rev. B60, 7512 (1999).
- [4] O. Chmaissam et al., Phys. Rev. B61, 6401 (2000).
- [5] J. L. Tallon, J.W. Loram, G. V. M. Williams, C. Bernhard, Phys. Rev. B61, R6471 (2000).
- [6] J. W. Lynn et al., Phys. Rev. B61, R14964 (2000).
- [7] G. V. M. Williams, S. Krämer, Phys. Rev. B62, 4132 (2000).
- [8] M. Grüninger, D. van der Marel, A. A. Tsvetkov, and A. Erb, Phys. Rev. Lett. 84, 1575 (2000).
- [9] L. B. Ioffe and A. J. Millis, Phys. Rev. B 61, 9077 (2000).
- [10] D. Munzar et al., Solid State Commun. 112, 365 (1999).
- [11] C. Bernhard et al., Phys. Rev. B 61, 618 (2000).
- [12] J. Hemberger et al., preprint.
- [13] A. P. Litvinchuk et al., Phys. Rev. B 62, 9709 (2000).
- [14] A. P. Litvinchuk, C. Thomsen, and M. Cardona, in Physical Properties of High Temperature Superconductors IV, edited by D. M. Ginsberg (World Scientfic, Singapore, 1994), p. 375 and references therein.
- [15] R. Henn, T. Strach, E. Schönherr, and M. Cardona, Phys. Rev. B 55, 3285 (1997).
- [16] J. Schützmann et al., Phys. Rev. B 52, 13665 (1995).
- [17] A. Damascelli, K. Skulte, and D. van Marel, A. A. Menovsky, Phys. Rev. B 55, R4863 (1997).
- [18] C. C. Homes et al., Physica C 254, 265 (1995).
- [19] R. Hauff, S. Tajima, W.-J. Jang, and A. I. Rykov, Phys. Rev. Lett. 77, 4620 (1996).
- [20] Tom Timusk and Bryan Statt, Rep. on Progress in Phys. 62, 61 (1999).
- [21] Jian-Xin Zhu, C.S. Ting, and C.W. Chu, Phys. Rev. B 62, 11369 (2000).
- [22] S.C. Gausepohl et al., Phys. Rev. B 52, 3459 (1995); I.I. Mazin, D.J. Singh, Phys. Rev. B 56, 2556 (1997); J.S. Dodge et al., Phys. Rev. B 60, R6987 (1999).
- [23] A.V. Boris et al., Phys. Rev. B 59, R697 (1999).
- [24] A.J. Millis, R. Mueller, and Boris. I. Shraiman, Phys. Rev. B 54, 5405 (1996); A. Chattopadhyay, A.J. Millis, S. Das Sarma, Phys. Rev. B 61, 10738 (2000).