[
Phys.Rev.Lett. 86, 3108 (2001)
High Pressure Insulator-Metal Transition in Molecular Fluid Oxygen
Abstract
We report the first experimental evidence for a metallic phase in fluid molecular oxygen. Our electrical conductivity measurements of fluid oxygen under dynamic quasi-isentropic compression show that a non-metal/metal transition occurs at 3.4 fold compression, 4500 K and 1.2 Mbar. We discuss the main features of the electrical conductivity dependence on density and temperature and give an interpretation of the nature of the electrical transport mechanisms in fluid oxygen at these extreme conditions.
PACS numbers: 71.30.+h, 62.50.+p, 72.20.-i, 77.22.Ej
]
The transition of condensed matter between electrically conducting and insulating states is a topic of wide scientific interest, whose relevance ranges from superconductivity to collosal magnetoresistance [2], to more recently thermoelectricity [3]. The metal/insulator transition has received renewed attention during the past decade in the context of high pressure research [4]. Although much progress has been made in developing experimental, theoretical and computational tools appropriate for the study of the metal/insulator transition at extreme conditions, our present understanding is mostly phenomenological and still incomplete. Given the “simple” nature of their interactions, the homonuclear diatomic molecular species, e.g. hydrogen [5, 6, 7], oxygen [8, 9, 10], nitrogen [11] and the halogens [12], have been intensively studied using both static and dynamic high pressure techniques.
We report in this letter the first experimental evidence for a non-metal/metal transition in the molecular fluid phase of oxygen under high dynamic compression. Oxygen has very rich physics at high pressure. Since dramatic color changes were reported in the pressure range [13], the high pressure solid phases of oxygen have been extensively investigated using structural [14, 15, 16], optical [8, 9] and transport techniques [10]. A metallic state and evidence for superconductivity have been identified in the solid around at very low temperatures [9, 10]. The properties of the liquid on the other hand have not been explored much, due to experimental difficulties and also technical and conceptual challenges for theory.
New insights on the physics of warm dense matter were provided by dynamic compression experiments on hydrogen [6, 7]. We present the first electrical conductivity measurements of fluid oxygen under dynamic quasi-isentropic compression between and . In our experiments fluid oxygen reaches up to 4-fold compression and temperatures below , conditions never before reached experimentally. We note that these conditions are similar with the ones found in the interiors of the giant planets, where oxygen is a major constituent, and that these conductivity measurements may be instrumental in explaining the origins of the planetary magnetic fields.
We measured the electrical resistance of quasi-isentropically compressed oxygen starting from high purity (), disk shaped liquid samples [17] of density at and atmospheric pressure. The high pressures were generated by multiple reflections of a shock wave between two single-crystal sapphire anvils which enclose the sample. The initial shock wave was produced by the impact between a high velocity projectile onto a stationary target containing the sample. The gradual increase in pressure produced by this technique yields quasi-isentropic compression. The experiments were designed to achieve and maintain thermodynamic steady state conditions at the final pressure and density for time durations of the order , during which the measurements were taken. We optimized the target geometry and electrodes size and position in order to achieve homogeneous samples of macroscopic size. The shock sensors which provide the trigger for the data acquisition were placed outside the sample cavity in order to preclude any interference with the measurements. Other details of the shock reverberation technique, cryogenic target construction and electrical circuitry were similar to those of Ref. [6].
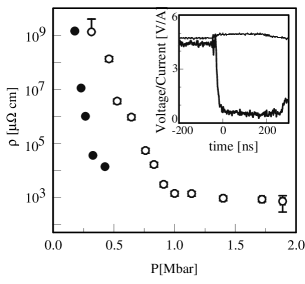
The equilibrium pressure is determined with a accuracy from the measured projectile velocity, using the shock impedance matching technique [18]. Densities were calculated using a one dimensional hydrodynamic code in which the projectile, anvils and sample materials were modeled by Mie-Gruneisen and ratio of polynomials equations of state (EOS). The EOS’s were derived based on extensive experimental results of Ref. [19, 20]. Temperatures were obtained by chemical equilibrium calculations similar with those in [21]. The sample resistance was extracted from accurate measurements of steady voltage and current intensity signals (see Fig.1 - inset, for an example), taken during thermodynamic steady state conditions lasting . The electrical resistivity was calculated from the sample resistance using where represents the geometrical factor. The geometrical factor, or cell constant, was computed as a finite element solution to the Maxwell equations for the experimental geometry with appropriate boundary conditions. The calculations spanned a wide range of sample thicknesses (between and ), and were verified by direct measurements performed on materials with known conductivities.
The measured resistivity of fluid oxygen ranges from at , down to at . As seen in Fig.1 these resistivity values are four to five orders of magnitude larger than the resistivities observed along the principal shock Hugoniot by Hamilton et al. [22] at the same pressure. Such a big difference can be explained by the fact that the high-pressure states achieved using the shock reverberation technique are at significantly lower temperatures ( at ) than those on the Hugoniot ( at [22]). In the single shock (Hugoniot) technique, between and the densities increase by whereas the temperatures nearly triple. It can be inferred therefore that the resistivity measured along the principal Hugoniot is mainly due to a much higher degree of thermal excitation of the carriers.
We distinguish two main regimes for the pressure and density dependence of the electrical resistivity. At pressures up to , there is a rapid drop of the resistivity of the compressed material which encompasses six orders of magnitude. Between and the electrical resistivity shows little sensitivity to pressure and density variations. In order to understand this behavior we need to analyze the changes produced by compression on the electronic configuration and chemical bonding in the warm fluid. The highest occupied electronic state in the oxygen molecule at ambient conditions is below the continuum. In a crystalline solid the energy levels of the isolated molecule split and widen to form sharply separated, alternating bands of allowed and prohibited electronic states. In a fluid, due to the inherent structural “disorder”, the energy levels broaden to form bands and the band edges spread into “tails”.
Nonetheless, as our experiments also show, liquid oxygen at and is a wide gap electrical insulator. As pressure increases the energy bands broaden further and create a non-zero electronic density at the Fermi level. Most of the states in the tails of the valence and conduction bands and at the Fermi level are localized, as demonstrated by Mott [23]. We postulate the existence of an activation energy (mobility gap), i.e. the minimum energy that a valence electron needs to acquire to move into a delocalized state and participate in conduction, and use an activation model for the electrical conductivity variation with temperature :
| (1) |
| (2) |
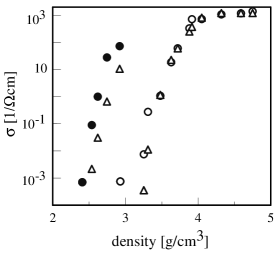
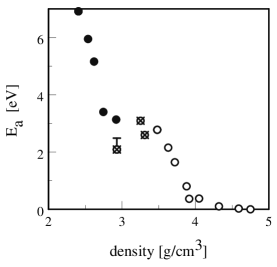
where and are the electrical conductivity and density at the transition into the metallic state respectively, and is the Heaviside step function. We assume a linear dependence of the activation energy on the distance between neighboring molecules, Eqn. 2, and zero value above the non-metal/metal transition. This approximation should work best in the vicinity of the transition, as it represents the first order expansion of the mobility gap in the deviation from the electronic wave-function overlap at metallization. The fit results are shown as triangles in Fig.2. The parameters at which the activation energy vanishes are , and . Using the fitted we extract the activation energy from the data, Fig.3. Although the activation energy effectively vanishes around , it becomes in fact comparable to the thermal excitation energy at somewhat lower pressures which is consistent with the observed change in slope of the experimental data. The conductivity at the transition, , is interpreted as the Ioffe-Regel limit [24], corresponding to a scattering length (mean free path) of the electrons of the order of the intermolecular distance. Using the Drude model, we compute the effective electronic density , where is the typical electronic speed, . We find that the effective number of conduction electrons per molecule is (for a good metal, e.g. copper at ambient conditions, this number is ).
The fact that the electrical conductivity does not appear to saturate in the metallic state is not unexpected. The “resistivity saturation” concept has been introduced by Fisk and Webb in order to explain the behavior of strongly interacting, disordered systems [25]. However, there is both experimental and theoretical [26] evidence in support of the absence of saturation. Just as found by Millis et al. in the study of a simple representative
system of electrons strongly coupled to phonons [26], in the case of compressed fluid oxygen there is a smooth crossover, as the density is increased, from activated conduction to a transport regime which is dominated by hopping between nearest neighbors whose separation distance decreases with further increments of pressure.
In the lower density regime, see Fig.2, there are significant deviations of the model from the measured conductivities (see also Fig.3, the activation energy dependence on density). Linear extrapolation of the oxygen melting curve from Ref. [20] indicates that up to approximately the states achieved by quasi-isentropic compression fall into the solid region of the phase diagram. We believe that, due to the short time-scales of the experiments, the system does not crystallize but rather reaches a glassy state. The temperature and density calculations that we perform using the EOS of the liquid should still describe the system reasonably well. However, as the oxygen molecule is rather elongated, the glassy states so obtained may contain a significant degree of orientational order “frozen in”. We speculate that these correlations lead to increased delocalization of the electrons and therefore better conduction.
The model deviations from the single-shock Hugoniot conductivity measurements are consistent with our expectations that as the density is decreased higher order terms in the activation energy () expansion become important. Also due to the fact that the Hugoniot states are much hotter, it is expected that the fluid would dissociate and contributions to the conductivity would arise from the atomic species as well. Chemical equilibrium calculations similar with those in [21] yield an estimate of the degree of dissociation in the regime of interest. For example, in our experiments, at a density of , and approximately of the molecules break-up. Also, at and the shock-reverberated states have a dissociation fraction of less than as compared with the along the principal Hugoniot at the same pressure and . We conclude therefore that the fluid undergoing quasi-isentropic compression is mostly molecular.
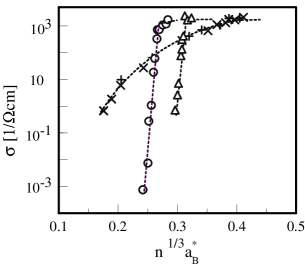
We analyze the crossover to the metallic regime from the perspective of the Mott principle, which states that an insulator/metal transition may occur when the separation distance between the centers, of number density , that produce charge carriers becomes comparable with the spatial extent of the electronic wave functions [23]. Upon sufficient overlap of the wave functions the outermost electrons become delocalized and participate in conduction. This is predicted to occur at a critical number density , that satisfies , where is a generalized Bohr radius, i.e. the radius where the probability of finding a valence electron is maximum. In order to estimate for the molecule we calculated its electronic charge density as a function of position using the GAMESS package. We performed restricted open shell Hartree-Fock calculations using Gaussian basis sets to determine the electronic structure of the ground state oxygen molecule. The molecule is elongated in the direction of the bond. Since in the warm fluid the angular correlations between molecules should be relatively small, we calculated an effective electronic charge density as an average of over the solid angle. We found that for oxygen as a function of distance has a maximum at , which was taken to be the generalized Bohr radius, .
The electrical conductivity dependence of liquid oxygen on the Mott scaling parameter is shown in Fig.4. Also shown are the results for hydrogen, cesium and rubidium, which are believed to undergo insulator/metal Mott transitions at high pressures [6, 27]. It is remarkable that for the two molecular fluids as well as the two alkalis there are obvious changes in the conductivity at values of the Mott scaling parameter which are close to the predicted value for the Mott transition. The slower increase of the conductivity in the case of the alkali metals, which have only one relatively weakly bound valence electron, can be attributed to the spatially extended nature of their electronic wave functions.
The transition of fluid oxygen to a metallic state should be accompanied by the divergence of the dielectric susceptibility , also known as the Goldhammer-Herzfeld criterion [28]. Given the limitations of the Clausius-Mossoti equation [29], ( is number density and is the molecular polarizability), we use it only to gain a qualitative understanding. We find that at metalization, at a density , , a factor of two bigger than the measured polarizability of molecular oxygen at standard ambient conditions [30]. A similar effect has been observed in diatomic liquid mercury [27]. We interpret the enhancement of the molecular polarizability as an indication that the molecules at these conditions are distorted.
Although, to our knowledge, there are no theoretical studies of fluid oxygen in the Mbar pressure range, several predictions have been made [16] for the solid in conjunction with the reported metallization of solid oxygen under static high pressure [9, 10]. The reported metallization pressure for the low temperature solid, , is very close to the onset of the metallic conduction in the fluid around . However, the mechanisms that lead to the non-metal/metal transition in the fluid are fundamentally different from the solid. In the fluid we observe a Mott transition where density driven band closure and disorder play the fundamental roles. In the solid, on the other hand, the metallization is associated with a structural phase transition [15].
We would like to thank N. Ashcroft, M. Nicol, G. Galli, S. Bastea and A.J. Millis for useful discussions, D. Young for the oxygen EOS table, J. Reaugh for the hydrocode and N. Winter for help with the GAMESS code. We gratefully acknowledge the LDRD office for financial support. We also thank S. Caldwell, W.P. Hall, N.Hisey, K. Stickle, L. Raper and T. Uphaus for assistance at the gas-gun facility. This work was performed under the auspices of the U. S. Department of Energy by University of California Lawrence Livermore National Laboratory under Contract No. W-7405-Eng-48.
REFERENCES
- [1] To whom correspondence should be addressed: bastea1@llnl.gov
- [2] Metal-Insulator Transitions Revisited, Taylor Francis (1995); M. Imada, A. Fujimori and Y. Tokura, Rev. Mod. Phys. 70, 1039 (1998).
- [3] G. Palsson, G. Kotliar, Phys. Rev. Lett. 80, 4775 (1998).
- [4] R.J. Hemley, N.W. Ashcroft, Phys. Today 51, No. 8, 26 (1998).
- [5] I.F. Silvera, Metallic Hydrogen in Metal-Insulator Transitions Revisited (Ref. [1]), p. 21.
- [6] S. Weir, A.C. Mitchell and W.J. Nellis, Phys. Rev. Lett. 76, 1860 (1996).
- [7] P.M. Celliers et al. Phys. Rev. Lett. 84, 5564 (2000).
- [8] M. Nicol and K. Syassen, Phys. Rev. B 28, 1201 (1983).
- [9] S. Desgreniers, Y.K. Vohra, A.L. Ruoff, J. Phys. Chem., 94, 1117 (1990).
- [10] K. Shimizu et al. Nature, 393, 767 (1998).
- [11] A.F. Goncharov et al. Phys. Rev. Lett. 85, 1262 (2000); C. Mailhiot, L.H. Yang and A.K. McMahan, Phys. Rev. B 46, 14419 (1992).
- [12] A.S. Balchan, H.S. Drickamer, J. Chem. Phys. 34, 1948 (1961); Y. Fuji et al, Phys. Rev. Lett. 58, 796 (1987); R. Reichlin et. al. Phys. Rev. B 49, 3725 (1994); K. Shimizu et al, J. Supercond., 7, 921 (1994).
- [13] M. Nicol, K.R. Hirsch and W.B. Holzapfel, Chem. Phys. Lett. 68, 49 (1979).
- [14] H. d’Amour, W.B. Holzapfel, M. Nicol, J. Phys. Chem, 85, 130 (1981); D. Schiferl, S.W. Johnson and A.S. Zinn, High Pressure Res. 4, 293 (1990) and references therein.
- [15] Y. Akahama et al. Phys. Rev. Lett. 74, 4690 (1995).
- [16] S. Serra et al. Phys. Rev. Lett 80, 5160 (1998); F.Gorelli et al. Phys. Rev. Lett. 83, 4093 (1999).
- [17] The samples have a diameter of and initial thicknesses of to .
- [18] A.C. Mitchell, W.J. Nellis, Rev. Sci. Instrum. 52, 347 (1981).
- [19] S.P. Marsh, LASL Shock Hugoniot Data, Berkeley : Univ. of California Press (1980).
- [20] D.A. Young et al. Phys. Rev. B 35, 5353 (1987).
- [21] M. van Thiel and F.H. Ree, J. Chem. Phys. 104, 5019 (1996) and references therein on the code CHEQ.
- [22] D.C. Hamilton et al. J.Chem. Phys. 88, 5042 (1988).
- [23] N.F. Mott and E.A. Davis, Electronic Processes in Non-Crystalline Materials, Clarendon Press: Oxford (1971).
- [24] A.F. Ioffe, A.R. Regel, Prog. Semicond. 4, 237 (1960).
- [25] Z. Fisk and G.W. Webb, Phys.Rev.Lett. 36, 1576 (1976).
- [26] A.J. Millis, J. Hu and S. Das Sarma, Phys. Rev. Lett. 82, 2354 (1999) and references therein.
- [27] F. Hensel and W.W. Warren, Jr., Fluid Metals, Princeton NJ: Princeton University Press (1999).
- [28] D.A. Goldhammer, Dispersion und Absorption des Lichtes, Leipzig: Teubner (1911); K.F. Herzfeld, Phys. Rev. 29, 701 (1927).
- [29] I. Souza, R.M. Martin, Phys. Rev. Lett. 81, 4452 (1998).
- [30] A.C. Newell, R.C. Baird, J. Appl. Phys. 36, 3751 (1965).