[
Disorder Driven Melting of the Vortex Line Lattice
Abstract
We use Monte Carlo simulations of the 3D uniformly frustrated XY model, with uncorrelated quenched randomness in the in-plane couplings, to model the effect of random point pins on the vortex line phases of a type II superconductor. We map out the phase diagram as a function of temperature and randomness strength for fixed applied magnetic field. We find that, as increases to a critical value , the first order vortex lattice melting line turns parallel to the axis, and continues smoothly down to low temperature, rather than ending at a critical point. The entropy jump across this line at vanishes, but the transition remains first order. Above this disorder driven transition line, we find that the helicity modulus parallel to the applied field vanishes, and so no true phase coherent vortex glass exists.
pacs:
74.60.Ge, 64.60-i, 74.76-w] Experimental [1, 2, 3], theoretical [4, 5, 6] and numerical [7, 8] studies have argued that the effect of intrinsic point impurities on otherwise clean single crystal samples of high superconductors leads to a phase diagram with the following generic form. At low magnetic fields , an elastically distorted vortex lattice (the “Bragg glass” [4]) undergoes a first order melting transition to a vortex liquid as temperature is increased. This melting line continues as is increased, until an “upper critical point,” , is reached above which sharp discontinuities in measured quantities become smeared. Upon increasing at lower temperatures, , the vortex lattice undergoes a transformation to a disordered vortex state along a line, , characterized by the “second magnetization peak” where critical currents show a sharp increase. As increases, the line continues to the vicinity of . In BSCCO, is only weakly dependent on [2]. Very recently, several experiments [9] have provided strong evidence that the line in BSCCO is associated with a thermodynamic first order phase transition. Whether the disordered state above is a “vortex glass” [5], characterized by true superconducting phase coherence and separated from the vortex liquid by a sharp phase transition, or whether it is a dynamically frozen state that smoothly crosses over to the vortex liquid, remains a topic of controversy [10].
Since many of the experimental and numerical studies focus on dynamical probes, from which it can sometimes be difficult to infer a true equilibrium phase transition, and analytical models must resort to Lindemann or other simplifying approximations, it is important to establish the true equilibrium phase diagram within a realistic model system. Towards this end we have carried out extensive Monte Carlo (MC) studies of the uniformly frustrated three dimensional (3D) XY model [11], with uncorrelated quenched random couplings to model point impurities. Applying a fixed magnetic field we map out the phase diagram as a function of disorder strength and temperature . Increasing at fixed is believed to play a similar role as the more physical case of increasing at fixed . Taking great care to achieve proper equilibration, and measuring thermodynamic derivatives of the free energy, we find in our model a single first order phase boundary. At small , the transition, , is a thermally driven melting of the vortex lattice. Increasing , there is a maximum critical above which disorder destroys the vortex lattice; when , the transition line turns parallel to the axis and smoothly continues down to low . No critical point is found to separate the thermal from the disorder driven sections of the phase boundary. For we find no evidence for a true phase coherent vortex glass.
The model we study is given by the Hamiltonian
| (1) |
where is the phase of the superconducting wavefunction on site of a 3D periodic cubic grid of sites, the sum is over all bonds in directions , and is the integral of the magnetic vector potential across bond , where is a fixed uniform magnetic field in the direction. To model uncorrelated random point vortex pinning in the planes, we take,
| (2) |
The coupling between planes is uniform, while each bond in the plane is randomly perturbed about the constant value ; the are independent Gaussian random variables with , . The parameter controls the strength of the disorder. For computational convenience we choose , with a vortex line density of , where is the grid spacing in the plane, and is the flux quantum. Our system size is , with . To check finite size effects, we have also considered and for certain cases. Our runs are typically MC sweeps through the entire lattice near transitions. Our results below are for a single realization of the disorder only. The extremely time consuming nature of our simulations excluded any serious attempt at disorder averaging. We have, however, carried out similar analyses for two other realizations of the disorder and have found qualitatively the same behavior.
In the pure model, , the low temperature vortex line lattice has a first order melting transition to a vortex line liquid [12]. To map out this melting transition line in the plane we fix the disorder strength , and cool down from high , until we reach a temperature at which we observe repeated hopping back and forth between coexisting vortex liquid and lattice phases. To detect the vortex lattice, we measure the in-plane vortex structure function (normalized for convenience so that ),
| (3) |
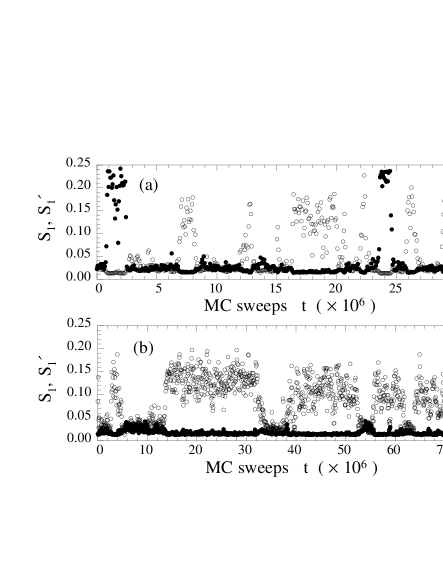
where is the vorticity in the plane, and . will have Bragg peaks at the reciprocal lattice vectors of the vortex lattice. We find that the vortex lattice always orders into the same periodicity as that of the pure case, where there are two possible lattice orientations related by a rotation. Defining as the average of over the six smallest non-zero for one lattice orientation, and as that for the other orientation, we identify the vortex lattice as states in which either or is large, according to which of the two lattice orientations has formed; in contrast, in the vortex liquid, both and are small. In Fig. 1 we plot and vs. MC simulation time at for two disorder strengths. For the weaker disorder, , we see both orientations of lattice coexisting with the liquid. For the stronger , the disorder sufficiently breaks the degeneracy of the two lattice orientations, so that we see only coexistence between one particular lattice orientation and the liquid. The repeated hopping between lattice and liquid in Fig. 1 verifies that we are well equilibrated. In this manner, by varying , we determine the melting phase boundary shown in Fig. 2. We include in Fig. 2 several data points for systems with , showing only a small shift in the phase boundary as increased.

We now determine if the melting transition remains 1st order, as increases. First order transitions are characterized by discontinuous jumps in thermodynamic quantities. Here we consider the average energy per site (the conjugate variable to temperature ), and a variable defined to be conjugate to the disorder strength ,
| (4) | |||||
| (5) |
where is the total free energy.
To see if there is a discrete jump in or at , we use the values of and to sort microscopic states as either vortex lattice or liquid. We can then compute the properties of each phase separately. In Figs. 3a and 3b we show semilog plots of the histograms of values of encountered during our simulation at , for the two cases of Fig. 1. In Fig. 3a, for , we see separated peaks for the liquid at , and for the two lattice orientations at finite positive and negative values of . In Fig. 3b, for the stronger , we see only peaks for the liquid and one of the two lattice orientations. Fitting these peaks to empirical forms (Gaussian for the lattice, exponential for the liquid; these are the solid lines in Figs. 3a,b), we determine the relative probability for a state with a given value of to belong to the liquid phase, or either of the two orientations of the lattice phases. Sorting though our microscopic states we probabilistically assign each to one of these three phases. We then plot the histograms of and values separately for each phase.
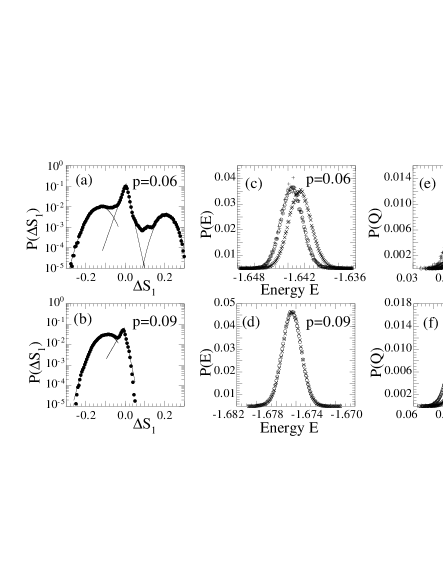
In Fig. 3c we show the histograms for . While the two lattice orientations have the same energy distribution, there is a clear difference between the liquid and lattice. This results in a finite energy jump , and hence a finite entropy jump , between the liquid and lattice. The melting transition is clearly first order. The histograms for are shown in Fig. 3e, where we also see a finite jump between liquid and lattice; for the disorder also couples differently to the two lattice orientations.
In Fig. 3d we show the histograms for the more strongly disordered , where only one lattice orientation is found. In contrast to Fig. 3c, we find that the energy distributions of the liquid and the lattice are now identical! Thus there is no energy jump, and hence no entropy jump, and moreover no specific heat jump, in going from liquid to lattice. However the histograms of plotted in Fig. 3f remain clearly different for liquid and lattice, and so there remains a finite jump at the melting transition. The transition at therefore remains first order, even though the entropy jump has vanished. Combining with the Clausius-Clapeyron relation, we conclude that the melting line must now be perfectly parallel to the temperature axis [13], and the transition becomes disorder, rather than thermally, driven. As shown in Fig. 2, we have been able to follow the melting line from where it first turns parallel to the axis, down to several lower temperatures.
In Fig. 4 we plot and vs. along the melting line. That and never simultaneously vanish, indicates that no critical point exists along the melting line.
Although our simulations are for a specific fixed value of , if we assume that the above result continues to hold for general values of , then it must be true that the phase diagram in the plane at fixed must similarly turn parallel to the axis at low temperatures. The point where the melting line first turns parallel to the axis has many features in common with an “upper critical point”; discontinuities as varies across the melting line below this point, will cease to exist as varies above this point. Yet there is no true critical end point and the first order melting line extends continuously down to lower temperatures.

Next, we investigate the superconducting phase coherence in our model, by computing the helicity modulus [11], , parallel to the applied magnetic field. indicates the absence of phase coherence. In Fig. 5a we show vs. , for two different disorder strengths , comparing systems with and . In both cases we see a discontinuous jump in at the melting transition (at we compute separately for the coexisting lattice and liquid phases, using the decomposition of our states according to ). As is increased, we see that vanishes in the vortex liquid; the vortex lattice melting thus marks the loss of superconducting phase coherence.
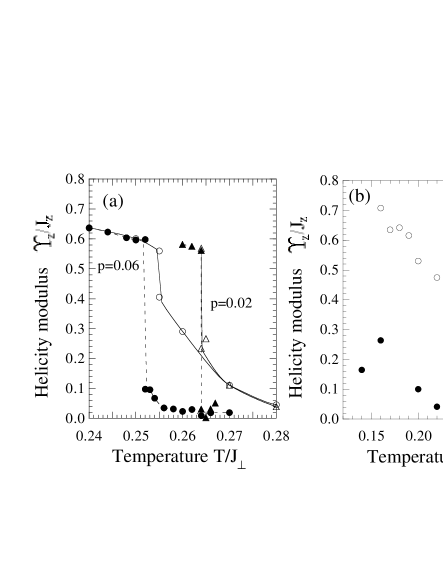
We now consider to see if a phase coherent vortex glass state might exist above the disorder driven melting of the vortex lattice. In Fig. 5b we show vs. for and system sizes and . Although it becomes extremely difficult to equilibrate our system at such low , we see a dramatic finite size effect strongly suggesting that decreases to zero as increases. We therefore find no evidence for a true phase coherent vortex glass. Our result agrees with conclusions from dynamical simulations of an interacting vortex line model by Reichhardt et al [8]. In contrast, recent work by Kawamura [14] found a finite vortex glass in numerical studies of a model similar to Eq.(1), but at a higher field density and uniformly distributed on . It is not clear if this disagreement is due his much stronger random pin strengths, or possible finite size effects in his systems of . A vortex glass transition has also recently been found for an interacting vortex line model with and very strong pinning [15].
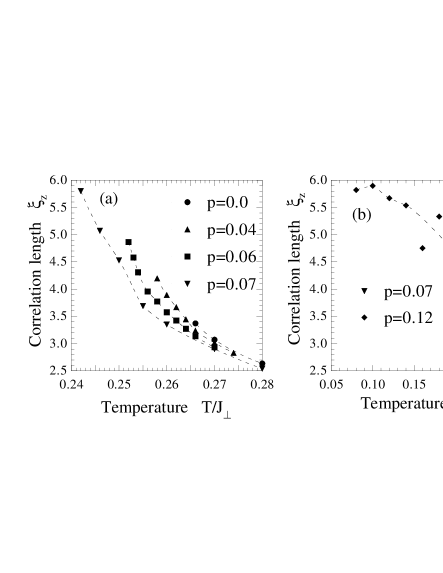
Finally, in Fig. 6 we plot the longitudinal phase angle correlation length, , in the liquid , as determined by fitting the correlation function,
| (6) |
to an exponential decay for . We see that for fixed , decreases as increases. However, since decreases as increases, the value at melting increases as increases. Even in the disordered state above we find that can be as large as in the liquid just above the thermally driven melting line. This suggests that the disorder driven melting should not be thought of as a layer decoupling transition.
As we were finishing this work, we learned of similar work by Nonomura and Hu [16], using the same model (1) with a slightly different scheme for the point randomness and a much weaker inter-planar coupling, . Using different methods they too find a disorder driven 1st order vortex lattice melting line nearly parallel to the axis at low . However they also claim to find a 1st order “vortex slush” to liquid transition extending to higher disorder from the thermally driven melting line, as well as a vortex glass to vortex slush transition at lower . We too find a peak in specific heat for that lies at a in the vicinity of the thermally driven melting line, however we have interpreted this as a smooth crossover rather than a true phase transition.
We would like to thank C. Marcenat for a valuable discussion. This work was supported by the Engineering Research Program of the Office of Basic Energy Sciences at the Department of Energy grant DE-FG02-89ER14017, the Swedish Natural Science Research Council Contract No. E 5106-1643/1999, and by the resources of the Swedish High Performance Computing Center North (HPC2N). Travel between Rochester and Umeå was supported by grants NSF INT-9901379 and STINT 99/976(00).
REFERENCES
- [1] R. Cubitt et al. Nature 365, 407 (1993).
- [2] B. Khayhovich et al., Phys. Rev. Lett. 76, 2555 (1996), Phys. Rev. B 56, R517 (1997).
- [3] T. Nishizaki et al., Phys. Rev. B 61, 3649 (2000).
- [4] T. Giamarchi and P. Le Doussal, Phys. Rev. Lett. 72, 1530 (1994) and Phys. Rev. B 52, 1242 (1995); T. Nattermann, Phys. Rev. Lett. 64, 2454 (1990); D.S. Fisher, Phys. Rev. Lett. 78, 1964 (1997); T. Nattermann and S. Scheidl, Adv. Phys. 49, 607 (2000).
- [5] D. S. Fisher, M. P. A. Fisher, and D. A. Huse, Phys. Rev. B 43, 130 (1991).
- [6] D. Ertaş and D.R. Nelson, Physica C 272, 79 (1996); Kierfeld, T. Nattermann and T. Hwa, Phys. Rev. B 55, 626 (1997); T. Giamarchi and P. Le Doussal, Phys. Rev. B 55, 6577 (1997); A.E. Koshelev and V.M. Vinokur, Phys. Rev. B 57, 8026 (1998); B. Horowitz and T.R. Goldin, Phys. Rev. Lett. 80, 1734, (1998); J. Kierfeld and V. Vinokur, Phys. Rev. B 61, R14928 (2000).
- [7] S. Ryu, A. Kapitulnik and S. Doniach, Phys. Rev. Lett. 77, 2300 (1996); N.K. Wilkin and H.J. Jensen , Phys. Rev. Lett 79 4354 (1997); A. van Otterlo, R.T. Scalettar and G.T. Zimányi, Phys. Rev. Lett. 81 1497 (1998).
- [8] C. Reichhardt, A. van Otterlo and G.T. Zimányi, Phys. Rev. Lett. 84, 1994 (2000).
- [9] M.B. Gaifullin et al., Phys. Rev. Lett. 84, 2945 (2000); D. Giller et al., Phys. Rev. Lett. 84, 3698 (2000); C.J. van der Beek et al., Phys. Rev. Lett. 84, 4196 (2000).
- [10] D. López et al., Phys. Rev. Lett. 80, 1070 (1998); A.M. Petrean et al., Phys. Rev. Lett. 84, 5852 (2000).
- [11] Y.-H. Li and S. Teitel, Phys. Rev. Lett. 66, 3301 (1991); T. Chen and S. Teitel, Phys. Rev. B 55, 15197 (1997).
- [12] X. Hu, S. Miyashita and M. Tachiki, Phys. Rev. Lett. 79, 3498 (1997).
- [13] Considering for the free energies of liquid and lattice phases, and noting that along the melting line and are equal in the two phases while the are not, implies that .
- [14] H. Kawamura, J. Phys. Soc. Jpn. 69, 29 (2000).
- [15] M. Wallin, private communication.
- [16] Y. Nonomura and X. Hu, cond-mat/0011349.