Superconductivity on the threshold of magnetism in CePd2Si2 and CeIn3
Abstract
The magnetic ordering temperature of some rare earth based heavy fermion compounds is strongly pressure-dependent and can be completely suppressed at a critical pressure, pc, making way for novel correlated electron states close to this quantum critical point. We have studied the clean heavy fermion antiferromagnets CePd2Si2 and CeIn3 in a series of resistivity measurements at high pressures up to 3.2 GPa and down to temperatures in the mK region. In both materials, superconductivity appears in a small window of a few tenths of a GPa on either side of pc. We present detailed measurements of the superconducting and magnetic temperature-pressure phase diagram, which indicate that superconductivity in these materials is enhanced, rather than suppressed, by the closeness to magnetic order.
pacs:
74.20.MnI Introduction
The intense Coulomb interaction and low bandwidth driving electronic correlations in heavy fermion systems lead to a fascinating variety of low temperature states that remain only partly understood. In analogy with liquid 3He, but at a new level of complexity and diversity, the effective quasiparticle interaction responsible for the high scattering rates and effective masses of these systems could for suitable quasiparticle spin-orientation become attractive enough to foster unconventional superconductivity.
Increased and widespread interest in these compounds arose, when superconductivity was indeed discovered in the heavy fermion compound CeCu2Si2 [2], which is now known to rest on the border of magnetic order at ambient pressure, and can be moved into the magnetic state by suitable sample preparation or doping [3, 4, 5]. Further convincing evidence for the closeness of this material to magnetic order emerges from high pressure measurements on the isoelectronic and isostructural relative CeCu2Ge2 [6]. Magnetism makes way in this material to superconductivity at a pressure just sufficient to reduce the unit cell volume to that of CeCu2Si2 at ambient pressure.
The close association of superconductivity with the vanishing of a magnetic phase in CeCu2Si2/Ge2 prompts the question whether the two types of order are simply in competition, as would be suggested for a conventional pairing scenario, or whether they could be related, as is suggested by the analogy with liquid 3He. In the former case, the proximity of the two phases would be purely accidental, whereas in the latter an attractive magnetic component of the quasi-particle interaction could contribute to forming a superconducting state close to the threshold of magnetism. In this magnetic interaction scenario, spin fluctuations effectively replace lattice vibrations in binding the heavy quasiparticles into Cooper pairs. As this interaction is dominant only close to the border of magnetism, one might expect to find superconductivity typically only over a narrow region in lattice density, connected to the disappearance of magnetic order and extending to both sides of the critical point, at least when the transition is continuous. By contrast, the superconducting region in CeCu2Si2/Ge2 extends over nearly 10 GPa in pressure to the high-pressure side of the critical point, suggesting a more complicated origin for superconductivity in this case.
This observation and the extensively studied metallurgical peculiarities of the CeCu2Si2 system motivate a search for related but simpler materials. Strikingly, nearly two decades of research into Ce-based heavy fermion compounds failed to bring up any other superconductors, raising the question, why superconductivity should be so narrowly confined to the CeCu2Si2/Ge2 system.
Within the magnetic interaction picture, one may expect to find such candidates by tuning magnetically ordered compounds through the point where the ordering temperature falls continuously to zero. The study of these quantum critical points has a history dating back to theoretical and experimental work on d-metals [7, 8, 9, 10, 11, 12, 13, 14, 15, 16, 17]. Recently, the systematic investigation of the magnetic quantum critical point in Ce-based systems has brought to light a host of pure compounds, which show a tendency towards superconductivity when they are tuned through the threshold of magnetism as a function of lattice density by means of hydrostatic pressure. (CePd2Si2 [18], CeRh2Si2 [19], CeCu2 [20], CeIn3 [21] and possibly also CeCu5Au [22]).


In this paper, we concentrate on two of these materials, the tetragonal CePd2Si2, which was the first Ce-based heavy fermion superconductor to be found outside the CeCu2Ge2/Si2 system, and the cubic CeIn3. In both materials we find a narrow superconducting region of only a few tenths of a GPa around the critical pressure, , where the antiferromagnetic ordering temperature extrapolates to zero. Detailed investigations of their normal and superconducting properties, in particular by neutron scattering, are complicated by the need to use hydrostatic pressure to suppress magnetic order. Fortunately, CeNi2Ge2, the isoelectronic relative of CePd2Si2 has been found to display at ambient pressure a behaviour analogous to that of CePd2Si2 just beyond the critical pressure [24, 25, 26]. Studies on CeNi2Ge2 enable us to extend the phase diagram of CePd2Si2 to higher effective pressure and to examine the evolution of the normal state and novel ordered states in greater detail [25, 26, 27, 28, 29, 30]. The resulting phase diagram shows not only a low pressure superconducting phase, limited to a small pressure range similar to that observed in CePd2Si2, but also an unexplored magnetic phase arising at high pressures of the order of 1.5 GPa and coinciding with a further superconducting region at high pressure, which extends up to at least about 3 GPa. This leads us to expect a similar second superconducting region in the sister comound CePd2Si2 starting at pressures about 1.5 GPa above , i.e above 4 GPa and stretching up to about 3 GPa above , up to about 6 GPa. Unfavourable sample or pressure conditions may in some cases cause the two superconducting ranges to merge, giving rise to the impression of a single, wide superconducting phase.
The merging of two superconducting ranges under non-hydrostatic pressure would offer an explanation for the drastic contrast between Bridgman-cell measurements on CePd2Si2 using a solid pressure medium [31], which show a wide superconducting region above , and both our original determination of the phase diagram in a hydrostatic pressure cell [32] and its recent independent confirmation [33, 34]. While unsuitable for detailed studies of the critical region, where under hydrostatic conditions, a very narrow superconducting region can clearly be resolved, the Bridgman-cell measurements give a first indication of the possible presence of a second high pressure superconducting phase in CePd2Si2, as anticipated from earlier findings on CeNi2Ge2 [25, 26, 27, 28, 29, 30].
These findings on CeNi2Ge2 and CePd2Si2 raise the intriguing possibility that some tetragonal Cerium heavy fermion compounds could be nearly critical over a wide region in parameter space, pressure or composition, maybe as a result of the competition between different types of magnetic order. This scenario may present the simplest and most intuitive explanation for the surprising stability of superconductivity in CeCu2Si2.
A CePd2Si2 and CeIn3
The heavy fermion antiferromagnets CePd2Si2 and CeIn3 offer an interesting opportunity for studies of the antiferromagnetic heavy fermion critical point. CePd2Si2 is isostructural to the heavy fermion superconductor CeCu2Si2 [2] and its larger volume relative CeCu2Ge2 [6] (ThCr2Si2 structure), but differs from CeCu2Si2 in the number of d electrons in the d metal constituent, and hence in the character of the Fermi surface and in the magnetic properties [19]. At ambient pressure, CePd2Si2 orders in an antiferromagnetic structure below a Néel temperature of about 10 K with a comparatively small moment of [35]. The spin configuration consists of ferromagnetic (110) planes with spins normal to the planes and alternating in directions along the spin axis. Previous high pressure measurements indicate that TN is strongly pressure dependent in CePd2Si2 and has a critical pressure within the range of conventional hydrostatic pressure cells.
The discovery of superconductivity in CeIn3 provides a cubic reference material, which may be simpler to describe theoretically. CeIn3 crystallises in the cubic AuCu3 structure and orders at ambient pressure near 10 K with the ordering wavevector in the (111) direction [23].
Here, we describe the results of a detailed study of the critical region, where the antiferromagnetic ordering temperature falls to zero as a function of pressure, in both CePd2Si2 and CeIn3 (Figs. 1 and 2). Both materials display a very narrow superconducting region close to , but the shapes of the superconducting phase lines, differ slightly. Moreover, close to the critical pressure, the normal state resistivity, , in CeIn3 approaches the low temperature limiting form , where denotes the residual resistivity, smoothly. By contrast, in CePd2Si2 the resistivity is nearly linear over almost two orders of magnitude in temperature. Moving away from , a Fermi-liquid resistivity appears to return more rapidly in CeIn3 than in CePd2Si2.
II Experimental Techniques
We have used pressure as the exclusive control parameter in a study of the stoichiometric heavy fermion compounds CePd2Si2 and CeIn3 to minimise possible complications due to impurities or disorder. As the critical pressure in these compounds lies within the range of conventional piston-cylinder clamp cells, full advantage can be taken of the high pressure homogeneity and hydrostaticity available with this method, which makes possible a detailed study of the phase lines over a very narrow pressure range. The electrical resistivity at pressures up to about 3.2 GPa was measured by a low power AC four-terminal method inside BeCu/Maraging Steel hydrostatic clamp cells filled with a 1:1 mixture of iso-pentane and n-pentane. The pressure was obtained to within from the resistively determined superconducting transition temperature of a tin sample [36]. The sample resistance was scaled to published values for the room temperature resistivity to obtain an absolute resistivity scale [37]. Experiments were carried out on a top-loading dilution refrigerator and an adiabatic demagnetisation refrigerator. Single crystals of CePd2Si2 and CeIn3 were prepared by a radio frequency melting technique in a water cooled copper crucible and UHV chamber in which ultra-pure argon under pressures of up to 8 bar was introduced for part of the process. Further details of the preparation process and of the sample characterisation are given in [38]. The residual resistivity ratio is approximately 50 at atmospheric pressure for the best crystals of CePd2Si2 and 100 for CeIn3. Apart from the comparative study on the role of sample quality shown in Fig. 5b, all the results on CePd2Si2 were obtained on a single specimen with a resistance ratio (). A common problem in the preparation of CeIn3 is the inclusion of small amounts of Indium in the sample. Care was taken to achieve vigorous stirring during the initial stages of preparation. Samples were then checked for the presence of In inclusions by resistivity measurements below 4K. The superconducting phase diagram presented here was recorded on a sample with a minimal amount of second phase, which is detected as an anomaly of order 1% in the resistivity trace. A second sample with similar residual resistivity ( viz. ), but no detectable Indium inclusion was used to study the normal state properties, and to confirm the phase diagram at selected pressures.
III Results
Resistivity measurements, while difficult to interpret quantitatively, can give important qualitative information. In heavy fermion systems, the high temperature resistivity is usually large () and only weakly temperature dependent, consistent with the scattering of charge carriers off thermally disordered moments. As the temperature is lowered, this scattering begins to drop significantly at an upper temperature scale, , below which thermal fluctuations of the local magnetic order parameter are increasingly frozen out. At low enough temperature, below a scale , most materials approach the low temperature limiting forms predicted by Fermi liquid theory, which should give an electronic contribution to the resistivity . However, the spin degrees of freedom may also condense into magnetically ordered states at ordering temperatures ( in the antiferromagnetic case), leading to further decreases in magnetic scattering, and consequently to anomalies or kinks in the resistivity trace at low temperatures. In addition, the formation of an antiferromagnetically ordered state can be accompanied by the opening of a charge gap over a section of the Fermi surface, which may be visible as an increase in the resistivity on cooling, when measured along particular crystal orientations. Important information on the nature of the normal state can be gained by examining the low temperature form of . In a number of materials on the border to magnetism one finds with . This is evidence for an anomalous quasiparticle scattering mechanism, which appears to go beyond the regular quasiparticle interaction on which conventional Fermi liquid theory is based.
A CePd2Si2
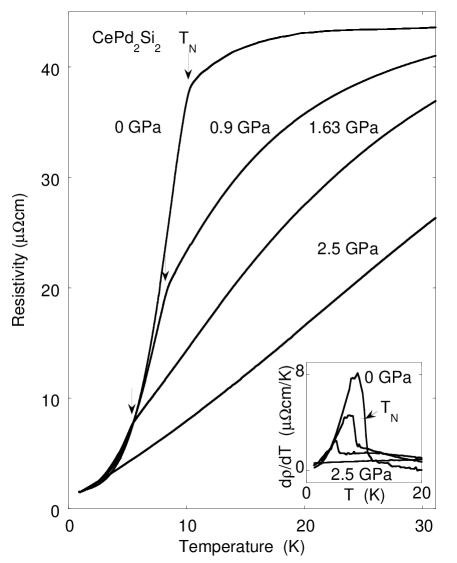
The resistivity of CePd2Si2 exhibits a very strong presssure dependence (Fig. 3). We can identify three main features. Firstly, a sharp kink occurs in the resistivity at a temperature TN, which coincides, at zero pressure, with the antiferromagnetic ordering temperature (or Néel temperature) deduced from neutron experiments, [35]. The position of the kink in the resistivity is assumed to correspond to the Néel temperature also at higher pressures. TN decreases with increasing pressure and falls below 1 K at around 2.6 GPa. Above about 1.5 GPa, this decrease is nearly linear with a slope of -4.8 K/GPa, and extrapolates to a critical pressure of 2.86 GPa (Fig. 1). This linear pressure dependence is not consistent with conventional spin-fluctuation predictions for a three-dimensional antiferromagnet, where one would naively expect [7]. Here, denotes the dynamical exponent, usually assumed to be 2 in the antiferromagnetic case, and is the dimensionality of the spin fluctuation spectrum. A linear pressure dependence of would in this model rather point towards , or at least indicate a very anisotropic spin fluctuation spectrum.
Secondly, the behaviour of the resistivity above TN changes dramatically with pressure. At zero pressure, the resistivity stays constant to within 10% from room temperature down to the Néel temperature, below which it falls sharply to a small residual value. At higher pressures, the resistivity develops a progressively stronger temperature dependence in the normal state. In particular, the temperature of the ‘shoulder’, below which the resistivity falls off, increases rapidly with pressure. The resistivity curves for appear to scale roughly with a characteristic temperature which we associate with the spin fluctuation temperature .
Thirdly, we can identify a small linear region in the resistivity just above TN even at zero pressure. At higher pressures, this region expands until, near the critical pressure, we observe a quasi-linear resistivity over a wide range in temperature. More precisely, the low temperature form of the resistivity of CePd2Si2 follows a power-law , where x is a heuristic exponent close to 1 (Fig. 8). This power-law dependence of the resistivity characterises the sample response over nearly two orders of magnitude in temperature up to about 40 K, where crosses over to a nearly constant high temperature value above 100 K (Fig. 8). Comparing samples of different has revealed a variation of the exponents in the range and a general trend towards lower values for purer specimen, indicating a possible limiting value of 1 for ideally pure samples [25, 26]. This behaviour persists up to about 3.2 GPa, which is the pressure range accessible in this study, and no return to a Fermi-liquid form of the resistivity could be observed at low temperatures.
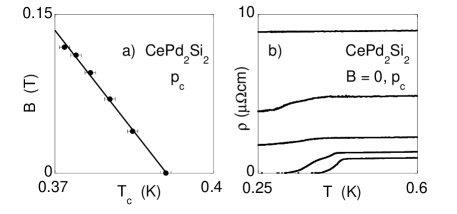
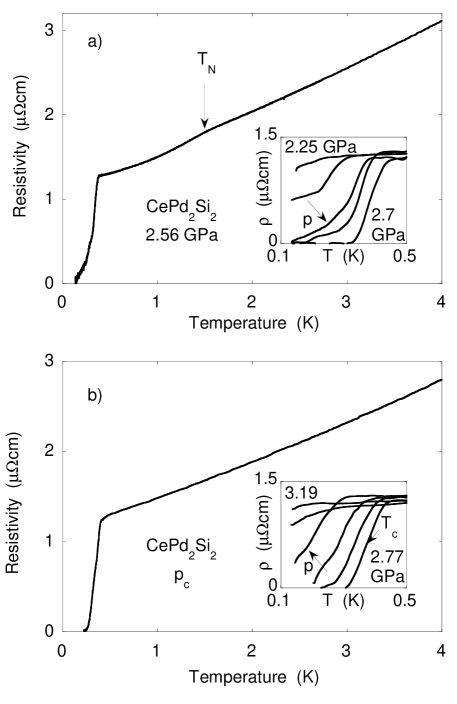
The anomalous normal state characterised by the striking power-law form of the resistivity close to is unstable towards superconductivity at low temperatures (Fig. 4). Superconductivity in CePd2Si2 is inferred from the full loss of resistivity in two samples, with residual resistance ratios (RRR) 34 and 55. Partial transitions were observed in two further samples with RRR 21 and 9.4, while no superconductivity was observed in samples with values of RRR less than 9. Figure 5b shows the transitions of these samples at . Increasing RRR gives rise to sharper transitions and higher values for , indicating the importance of impurity scattering in breaking up the superconducting pairs. A study of the upper critical field as a function of temperature up to a field of 0.12 T on the sample with leads to the conclusion that the initial slope must be much higher in CePd2Si2 than in conventional superconductors (Fig. 5a). The high slope, which is estimated to be of the order of 5 T/K, together with the low transition temperature imply a short coherence length, which is consistent with a high effective mass of the quasi-particles forming Cooper pairs. A treatment analogous to that used in [39] gives , where the constant . With and , we estimate the coherence length as .
A detailed study of the phase boundaries and was carried out for one of these samples (RRR=34) (Fig. 1). We find that , taken at the 50%-point of the resistive transition, goes through a single maximum at , just below the extrapolated critical pressure . The curve is approximately symmetric around its maximum and has a width of . Measurements on the other fully and partially superconducting samples at selected pressures confirm this behaviour.
Full superconducting transitions can be observed even in the ordered state, where indications of both phase transitions are present in (Fig. 4). However, the intriguing question, whether both transitions occur in the same region of the sample, or whether the two phases are mutually exclusive, cannot be answered straightforwardly from measurements of the resistivity alone.
B CeIn3
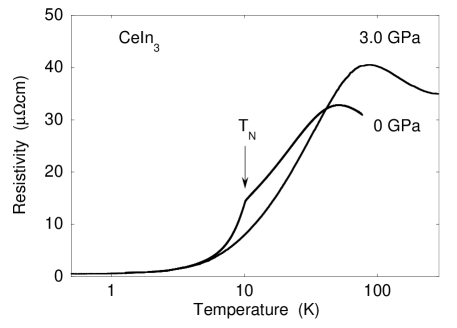
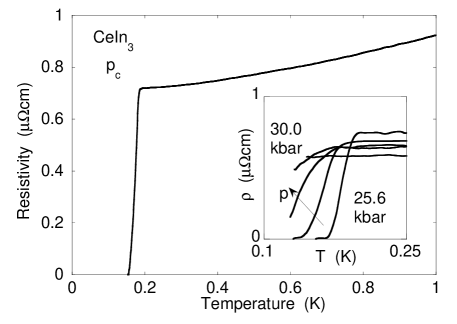
CeIn3 shows a qualitatively similar behaviour to CePd2Si2, but a number of important differences are revealed on closer inspection. Again, we identify a high temperature region, in which the resistivity is nearly constant and goes through a weak maximum near 70 K (Fig. 6). With decreasing temperature, the resistivity drops rapidly, and has a sharp anomaly at the Néel temperature of about 10 K. With increasing pressure, both temperatures shift, but while is strongly pressure-dependent and can be suppressed at a critical pressure , the upper temperature scale appears to be much less pressure-dependent, when compared to the case of CePd2Si2. Over the pressure range from 0 to 3 GPa, the position of the maximum only changes from about 70 K to about 100 K.
In further contrast to CePd2Si2, the Néel temperature curve (Fig. 2) is seen to be concave down at higher pressures, indicating a pressure dependence with exponent and more in line with theoretical predictions for the role of 3D spin fluctuations in suppressing magnetic order. It was difficult to follow below 3 K, because the transition was less clearly defined. It is likely that on approaching the critical pressure the increasing slope of leads to a wider distribution of ordering temperatures within the sample due to inhomogeneities of sample composition and pressure. This in turn would give broader anomalies in the resistivity trace, making more difficult to determine.
Close to the extrapolated critical pressure, sharp superconducting transitions are seen below 200 mK (Fig. 7). The superconducting region again reaches well into the ordered part of the phase diagram and is confined within about 0.5 GPa, with a maximum at 2.55 GPa.
The normal state resistivity at low temperatures approaches the form predicted for a 3D antiferromagnet in the limit of very low temperatures (), only close to and at low temperatures (Fig. 9). The power-law exponent x returns to the Fermi liquid value 2 more rapidly than in CePd2Si2, as the system is tuned away from the critical point, and does not lock into a constant value over a sizeable temperature range.
IV Discussion
A Normal state resistivity
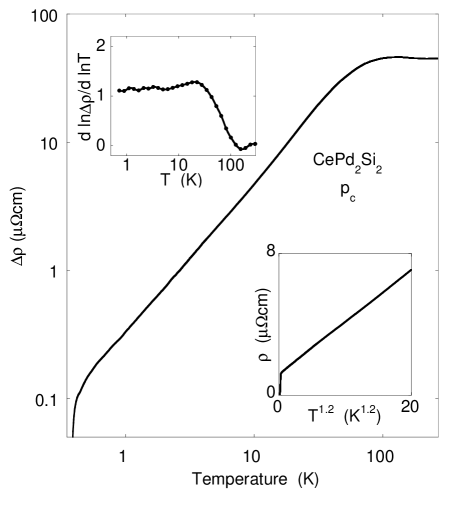
The normal state data obtained in this study reveal interesting differences between the tetragonal system CePd2Si2 and the cubic CeIn3. In CePd2Si2, the temperature dependence of the resistivity is characterised over nearly two orders of magnitude in temperature by a power-law with exponent x close to 1, and by a rapid cross-over to a nearly constant resistivity at high temperatures (Fig. 8).
These properties of the tetragonal metal CePd2Si2 and its homologue CeNi2Ge2 contrast sharply with those of the cubic antiferromagnet CeIn3 [21, 32]. In the latter, the resistivity deviates from the Fermi liquid form only in a very narrow pressure range near the critical pressure . At and in low magnetic fields the resistivity exponent, or more precisely , grows smoothly with decreasing temperature and tends towards a value of about near 1 K (Fig. 9). For the origin of this intriguing difference, we may consider first the known magnetic structure of CePd2Si2, which suggests a frustrated spin coupling along the c-axis and hence a strongly anisotropic spin fluctuation spectrum [25, 32, 26] that may be more nearly 2D than 3D as expected for CeIn3. For a comparison with the predictions of the standard magnetic interaction model we consider first the limit in which regions about the ‘hot spots’ on the Fermi surface (those states whose self energies can exhibit a non-Fermi liquid form due to antiferromagnetic spin fluctuations) dominate the temperature dependence of the resistivity. This is expected to occur at very low temperatures , when a short circuiting via normal regions of the Fermi surface is blocked for example by isotropic potential scattering via weak residual impurities. At a continuous antiferromagnetic critical point one then expects in the low temperature limit , where is the effective dimension of the spin fluctuation spectrum and is the dynamical exponent normally taken to be 2 in our problem [7]. For this simplest model the resistivity exponent is thus expected to be in 3D, in agreement with our observations in cubic CeIn3, and unity for 2D, in closer agreement to the results in pure samples of the tetragonal CePd2Si2 and CeNi2Ge2. The precise degree of anisotropy can depend on details of the microscopic near-neighbour exchange constants, giving rise to the observed sample dependence of the power-law exponents.

Further evidence for a quasi two-dimensional character of the spin fluctuation spectrum is drawn from the linear pressure-dependence of observed in CePd2Si2 close to . In the magnetic interaction model [7] this would indicate an effective dimension close to 2, in agreement with the simplest interpretation of the resistivity data and with recent neutron scattering work on the related compound CeNi2Ge2 [40]. We note that by comparison in CeIn3 follows a power less than 1 close to , consistent with and with the observed low temperature resistivity . We stress that the dimensionality refers to the magnetic fluctuation spectrum, not to the carriers, which remain unconstrained to move in 3D.
It may be instructive to relate the crystal and magnetic structures of our antiferromagnetic metals to those of the extensively-studied insulators K2NiF4 and KNiF3 [41]. Quasi-2D magnetic behaviour has long been known to arise in the layered perovskite K2NiF4, in which the magnetic moments of Ni occupy bct positions and order with , in exact analogy to the position and ordering of the Ce moments in CePd2Si2. By contrast, its simple cubic counterpart KNiF3 displays 3D magnetic behaviour and parallels CeIn3 in the arrangement of the magnetic moments and in the ordering wavevector .
Because of competing contributions to the electrical conductivity from hot and cold regions on the Fermi surface, the intermediate temperature regime is more complex. The standard treatment outlined above can be extended into this region [42, 43]. Here, one finds a temperature range in which exponents less than can occur as a cross-over between high and low temperature forms of even for a 3D spin fluctuation spectrum, but it is too early to tell whether or not it can account for all of the features we observe, both in tetragonal CePd2Si2 and cubic CeIn3, in a consistent way. In particular, we note that the power-law resistivity observed in CePd2Si2 at extends to nearly 40 K, i.e. roughly Tsf, and lies far outside the predictive range of the magnetic interaction model in its current form.
In a radical departure from the conventional model, an intuitive description of this strange metallic state could be based on a more extreme separation of the charge and spin degrees of freedom than is present in current approaches [44, 45, 46]. Convincing evidence is emerging that in at least one other Ce-based heavy fermion system, the CeCu6-xAux series, the quantum critical point is accompanied by unexpected local spin dynamics [47, 48]. Within the standard magnetic interaction model the imaginary part of the wavevector and frequency dependent susceptibility is of the form at sufficiently low and , where is some function of and . In the standard model this value of is expected to hold even in the limit provided [7]. However, in CeCu6-xAux it appears that in the low-temperature limit the exponent is anomalous and significantly less than unity near the antiferromagnetic quantum critical point. Superficially, the slight deviation of from its theoretical value (together with the observed -scaling) might be seen as a minor correction, but on closer examination, a sub-linear frequency dependence presents a major challenge to our present understanding of metallic magnetism and could imply a breakdown of Fermi liquid theory of an entirely different order from that expected in any known model.
Inelastic neutron scattering on the pure, stoichiometric compound CeNi2Ge2 could decide whether such behaviour can occur in the absence of disorder and whether it is, ultimately, more widely spread in heavy fermion systems on the threshold of magnetism.
B Superconductivity and magnetism
The phase diagrams of CePd2Si2 and CeIn3 show a striking dependence of superconductivity on magnetism (Figs. 1,2). The superconducting ‘bubble’ appears to be tacked onto the threshold of magnetic order, suggesting that in these two systems, superconductivity is promoted, rather than hindered, by the magnetic interaction which is at its largest near . The discovery of a wide high-pressure superconducting phase away from the critical point in the homologue to CePd2Si2, CeNi2Ge2 [27], indicates however, that the situation in CePd2Si2 may be complicated by a further superconducting state above , beyond the range of our study. For simplicity, our discussion will focus on the narrow superconducting region near the critical pressure, the existence of which has been independently confirmed in both CePd2Si2 and CeIn3 [33, 34, 49] and which appears most closely associated to the presence of strong magnetic fluctuations. Can we achieve at least a qualitative understanding of the salient results emerging from these studies: the confinement of superconductivity to a narrow region around and to samples with purity levels exceeding a critical value?
We consider first the role of impurity scattering in destroying anisotropic superconductivity, as mean free paths shorter than the superconducting coherence length, , rapidly suppress . Because the sample quality enters as the fraction of coherence length over mean free path, longer coherence lengths limit superconductivity to purer samples. Closeness to the quantum critical point, in turn, determines the effective mass , as evidenced by heat capacity measurements on related systems, and therefore . The simplest mechanism explaining the demise of superconductivity away from would therefore lie in the increase of associated with the decrease in . In the case of CePd2Si2, is estimated at to be around 150 Å, while the mean free path should go roughly as [39], becoming comparable to for samples with a resistance ratio of the order of 10. These numbers are consistent with our finding that full transitions were confined to samples of CePd2Si2 with RRR larger than 10. Further, we can estimate the rate of decrease with pressure of , where is the Sommerfeld coefficient of the specific heat, , from pressure measurements of on the related material CeNi2Ge2. In CeNi2Ge2, drops at an initial rate of about from a zero-pressure value of about [50]. Therefore, we can expect approximately to double over a range of 1GPa, which should be sufficient to destroy superconductivity in samples with . These numbers are in order-of-magnitude agreement with the observed width of the superconducting region, but the fact that the cleanest sample, with , has a superconducting region no larger than the sample suggests that further mechanisms may be limiting superconductivity in CePd2Si2.
One such influence may lie in the progressive competition from other coupling mechanisms, as the relative strength of the magnetic interaction decreases with distance from the critical point. Within the magnetic interaction model, superconductivity results from the dominance of the magnetic channel over all other channels of the quasiparticle interaction at the critical point. Moving away from , however, Tc can diminish even in the absence of impurities, as competing channels, which may favour different pairing symmetries, become sufficiently strong to alter dramatically.
While a similar mechanism may explain the confinement of superconductivity in CeIn3 close to and to pure samples, there is an interesting discrepancy between the maximum values of in the two materials. Despite higher levels of purity and a similar value for , CeIn3 has only half the of CePd2Si2. The size of depends critically on the coupling parameter , which involves the Cooper pair wavefunction and the strength of the quasiparticle interaction. In the case of phonon-mediated superconductivity, reduces to the mass-enhancement , but it is a more complicated property in anisotropic superconductors. In accordance with recent numerical comparisons of the two- and three-dimensional case [51, 52], we speculate that CePd2Si2 has a more favourable optimum value for due to the more anisotropic and possibly nearly two-dimensional nature of its spin fluctuation spectrum inferred from its normal state properties.
One might naively expect that right at the critical pressure, nearly static modes around the ordering wavevector should be pairbreaking and reduce to a local dip. Recent numerical calculations [51, 52], however, do not predict such a dip at least in the antiferromagnetic case, and indeed the data on both materials show no evidence of a minimum at .
C Implications for CeCu2Si2 and other rare-earth- compounds
Magnetically mediated superconductivity may be expected to occur quite generally in nearly magnetic metals of sufficiently high purity. For many years, the scarcity of examples of superconductivity in 4f heavy fermion systems that appeared to be on the border of magnetism and that could be prepared in pure form seemed to contradict this expectation. After extensive investigations over nearly 2 decades superconductivity appeared to be limited solely to CeCu2Si2 and its twin CeCu2Ge2. The new findings in CePd2Si2, CeRh2Si2 [19] and CeIn3 may help to shed light on the origin of this scarcity and to open the way to the discovery of many new examples.
The key point is that superconductivity may indeed be ubiquitous in heavy fermion systems, as anticipated by the magnetic interaction model, but often only in very pure samples in a narrow range of lattice density or pressure on the very edge of magnetic order. A rapid collapse of superconductivity away from the critical density, or critical pressure , may appear surprising but it is not incompatible with the magnetic interaction model for nearly antiferromagnetic metals. Within this model, can fall with increasing because of (i) the decrease in the ratio of the mean free path to the superconducting coherence length as the quasiparticle mass renormalistation factor falls, (ii) the decrease in the strength and the non-locality of magnetic interactions and thus the collapse of the pairing parameter , and (iii) the growing competition of other quasiparticle interaction channels.
Evidence for this precarious existence of superconductivity on the border of antiferromagnetism around ambient pressure has been seen in pure samples of CeNi2Ge2 [25, 53, 30]. In other nearly magnetic systems, however, the same phenomena may only be observed via tuning of the lattice density. This prescription has led to the discovery of superconductivity not only in the above systems, but more recently also in, CeCu2 [20], CeCu5Au [22], CeRhIn5 and CeIrIn5 [54].
The crucial parameter in this approach, the ‘closeness’ to the critical point, needs to be defined more accurately to check whether this scenario can apply even to the extreme case of CeCu2Si2. Amongst the many mechanisms under discussion, an intriguingly simple possibility is that CeCu2Si2 is nearly critical over a wide range in pressure, simply extending the phenomenon observed in CeIn3 and CePd2Si2 up to about 10 GPa, in analogy to recent findings on CeNi2Ge2 and CePd2Si2 [25, 26, 27, 28, 29, 30]. A detailed analysis of the evolution of the normal state properties of CeCu2Si2 with high hydrostatic pressure is under way to see whether deviations from Fermi-liquid behaviour indeed extend over the entire superconducting range.
However, even if the correlation length decreases with distance from the quantum critical point, the mass-enhancement associated with the magnetic interaction channel can still be large enough to allow magnetically mediated superconductivity, if competing channels are relatively weak and if the spin-fluctuation spectrum is soft over a wide range in momentum-space. Low-lying modes over a large volume in q-space loosely imply a low dimensionality of the spin fluctuation spectrum. They could arise from a nearly two-dimensional character of the spin fluctuation spectrum, as is discussed for the case of CePd2Si2, or an isotropic but weak dispersion of the relaxation rate, . This dispersion can be estimated from the spin-fluctuation temperature, which for CeCu2Si2 is much lower than in most of the other superconducting Ce-compounds listed above.
In view of other low-dimensional superconducting correlated electron systems, the former route is of particular interest. Quantitative, numerical comparisons of the superconducting transition temperature for two- and three-dimensional nearly antiferromagnetic metals indicate a significant enhancement of for lower dimensionality [51, 52]. As a guiding principle, this approach leads naturally to searching for magnetically mediated superconductivity in 2-D materials and would seem consistent with the recent discovery of superconductivity at surprisingly high in two new heavy fermion compounds, CeIrIn5 and CeRhIn5, which form in a layered structure and appear to be two-dimensional relatives of the cubic system CeIn3. [54].
V Conclusion
CePd2Si2 and CeIn3 present a unique opportunity to investigate the role of lattice structure and magnetic anisotropy on the superconducting and normal state properties on the threshold of magnetism.
At , both materials exhibit an anomalous normal state extending from an upper temperature scale of the order of 100K down to the onset of superconductivity below 430 mK and 175 mK, respectively. The behaviour of the resistivity of CePd2Si2 is particularly striking: it exhibits a nearly linear temperature dependence over about two orders of magnitude in temperature.
The superconducting state is characterised by its closeness to the border of antiferromagnetic order. This link is underlined by the small size of the superconducting region in both materials, indicating a likely magnetic origin for the attractive interaction responsible for the formation of Cooper pairs. The wide separation between and could make these systems amenable to a theoretical treatment of the superconducting transition.
Superconductivity in rare-earth based heavy fermion metals is still a rare phenomenon. The general phase diagram observed in CePd2Si2 and CeIn3 may provide the quantitative understanding necessary to unravel other strongly correlated electron systems, including CeCu2Si2.
Acknowledgements.
We wish to thank P. Agarwal, S. Brown, F. Carter, P. Coleman, J. Flouquet, K. Haselwimmer, D. Khmelnitskii, S. Lister, A. Millis, P. Monthoux, C. Pfleiderer, S. Saxena, G. Sparn, F. Steglich and A. Tsvelik. This research has been supported by the EPSRC of the UK, the EU and the Newton Trust in Cambridge.REFERENCES
- [1] Present address: MPI-CPfS (Chemical Solid State Physics), Nöthnitzer Str. 40, D-01187 Dresden, Germany
- [2] F. Steglich, J. Aarts, C. D. Bredl, W. Lieke, D. Meschede, W. Franz, and J. Schäfer, Phys. Rev. Lett. 43, 1892 (1979).
- [3] O. Trovarelli, M. Weiden, R. Müller-Reisener, M. Gómez-Berisso, P. Gegenwart, M. Deppe, C. Geibel, J. G. Sereni, and F. Steglich, Phys. Rev. B 56, 678 (1997).
- [4] G. Knebel, C. Eggert, D. Engelmann, R. Viana, A. Krimmel, M. Dressel, and A. Loidl, Phys. Rev. B 53, 11586 (1996).
- [5] P. Gegenwart, C. Langhammer, C. Geibel, R. Helfrich, M. Lang, G. Sparn, F. Steglich, R. Horn, L. Donnevert, A. Link, and W. Assmus, Phys. Rev. Lett. 81, 1501 (1998).
- [6] D. Jaccard, K. Behnia, and J. Sierro, Phys. Lett. A 163A, 475 (1992).
- [7] G. G. Lonzarich, in Electron, edited by M. Springford (Cambridge University Press, Cambridge, England, 1997).
- [8] T. Moriya, Spin Fluctuations in Itinerant Electron Magnetism (Springer, New York, 1985).
- [9] J. Hertz, Phys. Rev. B 14, 1164 (1976).
- [10] C. Pfleiderer, G. J. McMullan, S. R. Julian, and G. G. Lonzarich, Phys. Rev. B 55, 8330 (1997).
- [11] Y. Ishikawa, Y. Noda, Y. J. Uemura, C. F. Majkrzac, and G. Shirane, Phys. Rev. B 31, 5884 (1985).
- [12] G. G. Lonzarich and L. Taillefer, J. Phys. C 18, 4339 (1985).
- [13] G. G. Lonzarich, J. Magn. Magn. Mater. 54-57, 612 (1986).
- [14] F. M. Grosche, C. Pfleiderer, G. G. Lonzarich, and N. R. Bernhoeft, Physica B 206&207, 22 (1995).
- [15] N. R. Bernhoeft, G. G. Lonzarich, P. W. Mitchell, and D. Mc K. Paul, Phys. Rev. B 28, 422 (1983).
- [16] N. R. Bernhoeft, S. A. Law, G. G. Lonzarich, and D. McK. Paul, Physica Scripta 38, 191 (1988).
- [17] G. G. Lonzarich, N. R. Bernhoeft, S. M. Hayden, and D. M. Paul, Physica B 156&157, 699 .
- [18] F. M. Grosche, S. R. Julian, N. D. Mathur, and G. G. Lonzarich, Physica B 223&224, 50 (1996).
- [19] R. Movshovich, T. Graf, D. Mandrus, J. D. Thompson, J. L. Smith, and Z. Fisk, Phys. Rev. B 53, 8241 (1996).
- [20] E. Vargoz, P. Link, D. Jaccard, T. LeBihan, and S. Heathman, Physica B 229, 225 (1997).
- [21] I. R. Walker, F. M. Grosche, D. M. Freye, and G. G. Lonzarich, Physica C 282-287, 303 (1997).
- [22] H. Wilhelm, S. Raymond, D. Jaccard, O. Stockert, and H. v. Löhneysen, cond-mat/9908442 (1999).
- [23] P. Morin, C. Vettier, J. Flouquet, M. Konczykowski, Y. Lassailly, J.-M. Mignot, and U. Welp, J. Low Temp. Physics 70, 377 (1988).
- [24] G. Knebel, M. Brando, J. Hemberger, M. Nicklas, W. Trinkl, and A. Loidl, Phys. Rev. B 59, 12390 (1999).
- [25] F. M. Grosche, P. Agarwal, S. R. Julian, N. J. Wilson, R. K. W. Haselwimmer, S. J. S. Lister, N. D. Mathur, F. V. Carter, S. S. Saxena, and G. G. Lonzarich, cond-mat/9812133 (1998).
- [26] F. M. Grosche, P. Agarwal, S. R. Julian, N. J. Wilson, R. K. W. Haselwimmer, S. J. S. Lister, N. D. Mathur, F. V. Carter, S. S. Saxena, and G. G. Lonzarich, J. Phys. Cond. Matter 12, L533 (2000).
- [27] F. M. Grosche, S. J. S. Lister, F. V. Carter, R. K. W. Haselwimmer, S. S. Saxena, N. D. Mathur, S. R. Julian, and G. G. Lonzarich, Physica B 239, 62 (1997).
- [28] S. J. S. Lister, F. M. Grosche, F. V. Carter, R. K. W. Haselwimmer, S. S. Saxena, N. D. Mathur, S. R. Julian, and G. G. Lonzarich, Z. Physik B 103, 263 (1997).
- [29] P. Agarwal, F. M. Grosche, R. K. W. Haselwimmer, S. J. S. Lister, F. V. Carter, S. S. Saxena, S. R. Julian, and G. G. Lonzarich, to be published (2000).
- [30] D. Braithwaite, T. Fukuhara, A. Demuer, I. Sheikin, S. Kambe, J.-P. Brison, K. Maezawa, T. Naka, and J. Flouquet, J. Phys.: Condens. Matter 12, 1339 (2000).
- [31] S. Raymond, D. Jaccard, H. Wilhelm, and R. Cerny, S. S. Comm. 112, 617 (1999).
- [32] N. D. Mathur, F. M. Grosche, S. R. Julian, I. R. Walker, D. M. Freye, R. K. W. Haselwimmer, and G. G. Lonzarich, Nature 394, 39 (1998).
- [33] I. Sheikin, E. Steep, D. Braithwaite, J.-P. Brison, S. Raymond, D. Jaccard, and J. Flouquet, to be published in J. Low Temp. Phys. (2000).
- [34] A. Demuer et al., to be published (2001).
- [35] B. H. Grier, J. M. Lawrence, V. Murgai, and R. D. Parks, Phys. Rev. B 29, 2664 (1984).
- [36] T. F. Smith, C. W. Chu, and M. B. Maple, Cryogenics 9, 53 (1969).
- [37] For CePd2Si2, the a-axis resistivity at ambient pressure was scaled to the room-temperature value given in [31], , while for CeIn3, we assumed for the ambient pressure resistivity, following [23].
- [38] N. D. Mathur, Ph.D. thesis, University of Cambridge, 1995.
- [39] U. Rauchschwalbe, Ph.D. thesis, Technical University of Darmstadt, 1986.
- [40] B. Fåk, J. Flouquet, G. Lapertot, T. Fukuhara, and H. Kadowaki, J. Phys. Condens. Matter 12, 5423 (2000).
- [41] M. E. Lines, Phys. Rev. B 164, 736 (1967).
- [42] R. Hlubina and T. M. Rice, Phys. Rev. B 51, 9253 (1995).
- [43] A. Rosch, Phys. Rev. Lett. 82, 4280 (1999).
- [44] P. Coleman, Physica B 261, 353 (1999).
- [45] Theory of Superconductivity of High-Tc Cuprate Superconductors (Princeton University Press, ADDRESS, 1997).
- [46] Q. Si, J. Smith, and K. Ingersent, Int. J. Modern Physics B 13, 2331 (1999).
- [47] A. Schröder, G. Aeppli, E. Bucher, R. Ramazashvili, and P. Coleman, Phys. Rev. Lett. 80, 5623 (1998).
- [48] A. Schröder, G. Aeppli, R. Coldea, O. Stocker, H. von Löhneysen, E. Bucher, R. Ramazashvili, and P. Coleman, Nature 407, 351 (2000).
- [49] G. Knebel, D. Braithwaite, P. Canfield, G. Lapertot, and J. Flouquet, submitted to Phys. Rev. B (2000).
- [50] P. Hellmann, L. Donnevert, S. Thomas, C. Geibel, G. Sparn, and F. Steglich, Czech J. Phys. 46, 2591 (1996).
- [51] P. Monthoux and G. G. Lonzarich, Phys. Rev. B 59, 14598 (1999).
- [52] P. Monthoux and G. G. Lonzarich, to appear in Phys. Rev. B (Jan. 2001).
- [53] P. Gegenwart, F. Kromer, M. Lang, G. Sparn, C. Geibel, and F. Steglich, Phys. Rev. Lett. 82, 1293 (1999).
- [54] H. Hegger, C. Petrovic, E. G. Moshopoulou, M. F. Hundley, J. L. Sarrao, F. Z., and J. D. Thompson, Phys. Rev. Lett. 84, 4986 (2000).