Hydrogen induced nonmonotonic relaxation in binary mixtures similar to Pd–Er alloys as a transition process in nonequilibrium heterogeneous systems with spinodal decomposition
Abstract
We have proposed a qualitative model for the structure of binary systems similar to Pd–Er alloys, which explains their nonmonotonic relaxation after the hydrogen saturation. It is based on the assumption that such a solid solution involves two kind heterogeneities. The former are caused by spinodal decomposition of the initially homogeneous state of the solid solution into the phases enriched and depleted of Er atoms. The latter are crystalline defects that trap an additional amount of Er atoms, which leads also to their local accumulation, changing the defect properties. Hydrogen atoms penetrating into the solid disturb the equilibrium of both the phase separation and the defect saturation with Er atoms, causing redistribution of Er atoms. The diffusion fluxes give rise to the motion of the interface between the two phases that is responsible for time variations, for example, in the relative volume of the enriched phase observed experimentally. We have found the conditions when the interface motion can change the direction during the system relaxation to a new equilibrium state. The latter effect is, from our point of view, the essence of the hydrogen induced nonmonotonic relaxation observed in such systems. The numerical simulation confirms the basic assumptions.
1 Introduction
Metal-hydrogen systems are singled out with the fact that they can remain in nonequilibrium states for a long time because of the ability of hydrogen atoms to migrate relatively fast through metallic matrices. Therefore, a metallic matrix initially saturated with hydrogen inevitably loses its main amount during a certain time period which may be sufficiently long [1, 2, 3]. Hydrogen atoms penetrating into the metallic matrix cause the reformation of the defects structure and as a result, the system structure becomes substantially heterogeneous, moreover, it can be of multiscale geometry [4, 5]. When the heterogeneity scales expand over several levels these systems may be treated as fractals (see, e.g., [6, 7, 8]) and their evolution goes in a sophisticated manner. In particular, under certain conditions [9] the dynamics of such a systems is described by strange attractor, which reflects in nonmonotonic or even chaotic time variations in its structure and occurring phase transitions [10].
The characteristics of structure transformations during the hydrogen saturation and the following relaxation have been studied for metallic alloys based on Pd [10, 11, 12, 13, 14]. For example, for the Pd–Er alloys undergone deformation the hydrogen saturation gives rise to the change in the sign of the elastic tension at the initial stage of relaxation [14]. This effect is due to variations in the image forces that are induced by the transformation of the defect-metal (D–M) complexes into the hydrogen-defect-metal (H–D–M) ones because of the high binding energy between hydrogen atoms and defects in Pd matrix [15]. Having changed the sign, the tensions grow during two days, then, drop and decrease by 25% in eight days. In parallel with it oscillatory variations in the relative volume of the phases enriched and depleted of Er atoms occur practically right after the hydrogen saturation. The difference in the concentration of Er atoms between the two phases evolves in the same manner. These oscillations are chaotic rather than regular [10, 12].
The given phenomena were observed in such Pd–Er alloys where the atomic concentration of Er atoms was about 10% [12]. So their structure has to be sufficiently simple, namely, should comprise only two phases formed of the Pd matrix depleted of or enriched with Er atoms. So the relaxation after the hydrogen saturation seems to go only through time variations in the relative volume of these phases without complex structural transformations in the Pd–Er system that should appear for high values of the Er concentrations [16].
The stochastic behavior of the relaxation process in the Pd–Er–H system has been demonstrated in a frameworks similar to the Lorenz model proposed for analysis of turbulent phenomena in atmosphere [17] and, then, applied to the description of plastic deformation [18]. It should be pointed out that time variations in the structure of the given alloys after the hydrogen saturation enable us to consider diffusion flux in them also turbulent. It can be justified at least for some stages of the relaxation if we take into account not only the stochastic evolution of the alloy structure but also the difference in the rate of nonmonotonic structure transformations for different coherent diffraction regions, as it was noted for the first time in [13]. The analysis presented in [10] has been carried out in the frameworks of macroscopic approach, so, in order to complete it, we should develop a microscopic mechanism by which these phenomena can be implemented. The latter problem is actually the purpose of the present paper.
Papers [10, 13] demonstrate that the macroscopic model to be developed for the hydrogen induced relaxation in alloys similar to Pd–Er–H has to take into account the following.
-
1.
In such systems the hydrogen saturation initiates several interacting processes, in particular, the transformation of the D–M complexes into D–M–H ones and the diffusion of Er atoms between the enriched and depleted phases of the Pd-matrix. These two processes cause nonmonotonic time variations not only in the relative volume of these phases but also in the Er concentration inside them.
-
2.
The correlated variations in the Er concentration and the phase relative volume suggest that the two processes stem from the same phenomenon. Besides, their nonmonotonicity points out that diffusion of Er atoms does not obey conventional Fick’s low, at least, everywhere in the alloy.
-
3.
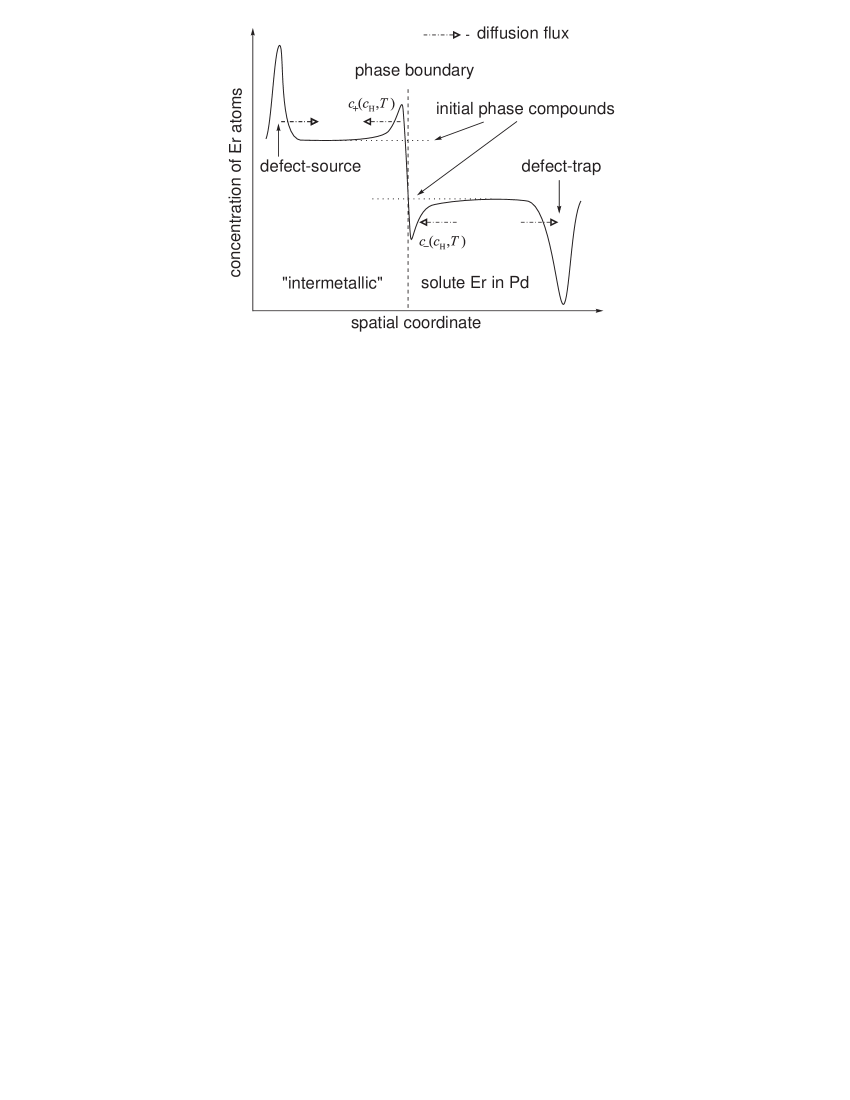
The D–Er–H complexes induced by the hydrogen saturation have to be enriched not only with hydrogen atoms but also with Er atoms because of high affinity of H and Er atoms. So we meet four type regions (fig. 2): two regular phases of the Pd-matrix and regions with two type defects D–Er–H (inside each of the phases). Besides, substantial difference in the specific volumes of the regular phases and complexes can lead to the appearance of transitional regions between the matrix and complexes.
-
4.
The complexes are the source of additional nonuniformity in the distribution of Er atoms, causing an additional diffusion flux in the system.
-
5.
The variations in the phase relative volume mean displacement of the phase boundaries among with diffusion of Er atoms. So dealing with the nonmonotonic relaxation on systems similar to Pd–Er alloys we first of all should explain why a nonmonotonic motion of the phase boundaries occur.
It should be pointed out that the system Pd–Er–H is not unique keeping in mined the aforesaid properties. Even more pronounced chaotic behavior of the structural evolution has been observed in the Pa–Ta–H system [13], which suggests the multiscale organization of its structure and the substantially nonequilibrium state of the defects and the adjacent regions of the Pd-matrix.
In spite of the available number of theoretical models cited above, physics of the hydrogen induced relaxation in such metallic systems is far from being understood well. So at the first step of developing a microscopic model able to explain the aforesaid phenomena, it is reasonable to confine ourselves to the analysis of the interaction between the D–M–H complexes and the phase boundaries through diffusion of Er atoms. In this study we should also take into account that the distribution of Er atoms around the D–M–H defect can be nonmonotonic because under certain conditions the deformation field in their neighborhood exhibits a nonmonotonic behavior. Nevertheless in the present paper we consider only defects with a sufficiently simple structure and propose a model which qualitatively explains the nonmonotonic motion of the phase boundaries due to the hydrogen saturation. We do not claim on a sophisticated theory of this relaxation process but only show the feasibility of its qualitative explanation in the frameworks of the proposed model and single out the main clues to its understanding.
2 Model
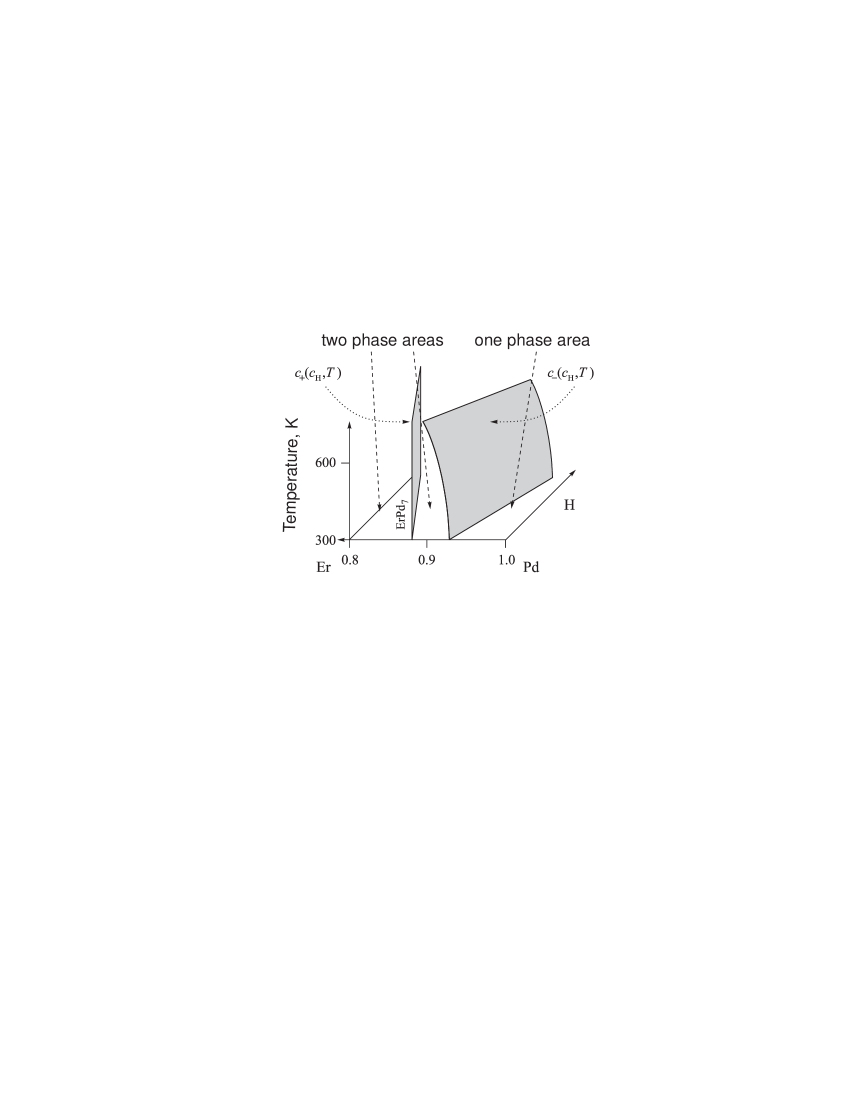
The model to be developed uses the basis of the molecular-kinetic theory of solid solutions [20, 21, 22, 23] and the state diagram of the Pd-Er alloys (in the -plane, where is the atomic concentration of Er atoms, is temperature) [16]. Namely, we assume that difference in the atomic radii and electro-chemical characteristics of Er and Pd results in instability of the homogeneous state of the given solid solution Pd–Er. The instability gives rise to domains with an increased value of the Er concentration whose composition approximately corresponds to the intermetallic ErPd7, the first equilibrium phase in the state diagram after the primary solid solution of Er atoms in the Pd-matrix [16]. These domains are surrounded by the maternal phase (primary solid solution) with a lower value of the Er concentration equal to the limit of Er solubility in the Pd-matrix. In equilibrium for the regular solid solution the relationship between the values and is specified by the “arms rule” [20]. However crystalline defects such as vacancies, interstitial atoms, their complexes, dislocations, grain boundaries, and so on can trap Er atoms. Furthermore we cannot exclude that other phases more enriched with Er atoms, ErPd3, Er10Pd21, etc., appear in the neighborhood of these defects. A multiscale hierarchical structure can form itself in this system in general.
Penetrated into the alloy hydrogen atoms disturb the equilibrium in two ways. First, the hydrogen saturation converting the solid solution Pd–Er into the ternary system Pd–Er–H changes the phase equilibrium in the metal subsystem. The higher affinity between H and Er in comparison with the Pd and H should give rise to the complexes {Er–H} that contain not only binary bonds Er–H but also many bond structures, for example, Er–H–Er. The first type clusters, Er–H, seem to be typical for regions with low values of the Er concentration, whereas in the Er enriched phase as well as near the solubility limit of Er atoms in the Pd-matrix the amount of the second type clusters should be essential. The presence of the Er–H–Er bonds effectively makes the interaction of Er atoms with each other stronger, which has to cause the state diagram of the triple solution Pd–Er–H take a form shown at fig. 1. Drawing this diagram we were keeping in mind one presented in [16] for the binary solution Pd–Er and treating hydrogen atoms as a source of the additional Er–Er attraction. Let us explain the proposed form of this diagram in more details. Under the adopted assumptions the instability of the system homogeneous state is to occur at lower concentrations of Er atom than it would be in the absence of hydrogen atoms. Correspondingly, the solubility limit of Er atoms in the Pd-matrix has to depend on the hydrogen concentration decreasing with the value of grows. In its turn, the composition of the intermetallic ErPdx(H) or, what is the same, the value seems also to depend on the local values of the hydrogen concentration going into the region of higher value with grows. We assume the intermetallic ErPdx(H) to originate from ErPd7 and to form a certain phase in the nonequilibrium system under consideration. We note that the concept of true intermetallic concerns a rigorously ordered phase with specific stoichiometric composition. So the concept of intermetallic for nonequilibrium systems requires an individual consideration. For given system the experimental data demonstrate the presence of a certain phase containing hydrogen atoms where the concentration of Er atoms closely matches the composition of the intermetallic ErPd7. However, whether this phase can be treated as a true intermetallic ErPd7 or it comprises its small clusters, equilibrium or nonequilibrium, containing hydrogen atoms is of low importance in the present study. We need only the presense of a certain quasiequilibrium phase experimentally observed, where the atomic concentration of Er atoms is about 10%. We suggest this phase to be relative to the true intermetallic ErPd7 so below we also will refer to it as to “intermetallic” enclosing with quotation marks.
Second, due to higher affinity between hydrogen and the defects in comparison with the regular structure of the Pd-matrix hydrogen atoms have to be attracted by defects containing also an increased amount of Er atoms. By the same reasons as discussed in the previous paragraph hydrogen atoms penetrating into the defects located in the phase have to density the Er distribution in them, and, so, these defects gain the ability to absorb new Er atoms. In another words, hydrogen atoms penetrating into phase increase the “capacity” of defects being activated by them as traps or sinks of Er atoms. Hydrogen atoms penetrating into the “intermetallic” also affect the state of its defects make variations in the “intermetallic” composition possible. In fact, without hydrogen the composition of ErPd7 is fixed (in the state diagram the intermetallic ErPd7 corresponds to a line rather than two-dimensional region [16]). So, defects located in this intermetallic are to contain other phases enriched with Er atoms to higher degrees, e.g., ErPd3. Now, these local phases gain the possibility to dissolve in the “intermetallic” injecting new Er atoms into in it. In other words, the hydrogen saturation into the phase activates its defects as local sources of Er atoms.
The interface separating the phases and is of atomic size. Therefore during the relaxation course this interface locally must be in quasiequilibrium, i.e. the concentration of Er atoms in the regions of the phases and adjacent to the interface must be equal to and , respectively. This quasiequilibrium is the result of practically instantaneous redistribution of Er atoms on atomic scales in the vicinity of the interface . The following diffusion of Er atoms into the bulk of the phases and tends to make their individual composition uniform, causing the interface to move. In fact, generally the diffusion flux at the interface on the side of the phase and that of the phase is different. Thus, due to atom conservation the interface is to move to compensate this difference giving rise to an effective source of Er atoms proportional to , where is the normal velocity of the interface .
Nonmonotonic motion of the interface being the essence of the observed relaxation process is due to change in the profile of Er distribution as time goes on. Fig. 2 sketches the Er distribution at the initial stage of relaxation after the hydrogen saturation. Light arrows point the diffusion direction of Er atoms in phases and . Whence it follows that for each of the phases individually the change in the Er equilibrium concentration near the interface and the presence of the activated defects cause the diffusion flux in the opposite directions. At the initial stage the distant defects cannot affect the interface motion, so, it is governed by the change in the equilibrium state only. As time goes on the diffusion flux induced by the activated defects can become dominant and the interface will move in the opposite direction.
We suppose that this phenomenon is a backbone of the nonmonotonic relaxation induce by the hydrogen saturation into systems like the Er–Pd alloy.
Before passing to a specific mathematical model we would like to note the following. As seen from the present analysis the individual role of the two phases is approximately the same. The latter enables us to confine our consideration to only one of them, for example, the phase . Taking into account both of them only numerical coefficients in the expressions to be obtained can be changed, makes no sense at the current stage of the theory development.
3 Master equations
Taking into account aforesaid we write the diffusion equation for the atomic concentration of Er atoms in the phase regarded as the half-space (we have attached the coordinate system to the interface moving at the velocity in the laboratory frame):
| (1) |
where is the diffusion coefficient of Er atoms treated as a constant and the second term in the right-hand side of equation (1) describes the Er atom trapping by a defect approximated by the -function located at a point . This trap-defect is characterized by the following parameters, is its real physical size, is the capacity, i.e. the number of free seats for Er atoms at the current time, and is the characteristic time during which, on the average, the defect traps an Er atom located in its neighborhood (not to be confused with the lifetime of Er atoms inside the defects regarded infinitely long in the given model). In the frame attached to the interface the trap-defect moves towards the interface at the velocity , i.e.
| (2) |
Here is the initial position of the defect (at ) and is one of the model parameters. Since the newly trapped atoms occupy vacant places inside the defect its capacity decreases in time according to the equation:
| (3) |
and , the initial capacity of the trap-defect activated by the hydrogen saturation, is also a model parameter ( is a period of the lattice).
At the interface () the Er concentration is set equal to:
| (4) |
where is the initial concentration of Er atoms in the phase before the hydrogen saturation and is a change in this concentration caused by the hydrogen effect on thermodynamical equilibrium of the phase boundary. Ignoring diffusion of Er atoms inside the phase we can represent the law of Er atom conservation at the interface in the form
| (5) |
where (fig. 2).
At the initial fast state of the system relaxation only the phase boundaries attain new equilibrium and the defect activation is completed, whereas the state of the phase bulk remains unchanged. The latter enables us to adopt the following initial conditions for the Er concentration inside the phase :
| (6) |
The system of equations (1)–(6) forms the required relaxation model for Pd–Er–H system. Let us discuss its features in detail.
The proposed model contains four principal parameters:
| (7) |
For the sake of simplicity we rewrite system (1)–(6) in the dimensionless form by introducing the normalized variable and , and the dimensionless spatial and temporal coordinates and :
| (8) |
where , and is the dimensionless velocity of the interface . The scales of the spatial coordinate and time are chosen so that the unit value of correspond to the defect position () at initial time and the unit value of characterize the diffusive penetration of Er atoms over scales about . Equation (8) is subject to the boundary conditions:
| (9) |
and to the initial condition at :
| (10) |
In the chosen frame the “motion” of the trap-defect and its capacity obey the equations:
| (11) |
If we ignore the influence of the defect on the interface motion and on the Er atom distribution near (which is well justified at the beginning of the relaxation process for ) then equation (8) under conditions (9)-(10) admits the automodel solution:
| (12) |
where parameter is the root of the transcendental equation
| (13) |
and the interface velocity is given by the ratio . Numerical analysis has shown, in particular, that for and the value and on time scales the interface velocity is also about 1. Therefore, on one side, for the given values of the parameters the interface is to reach the defect in time being about 10.
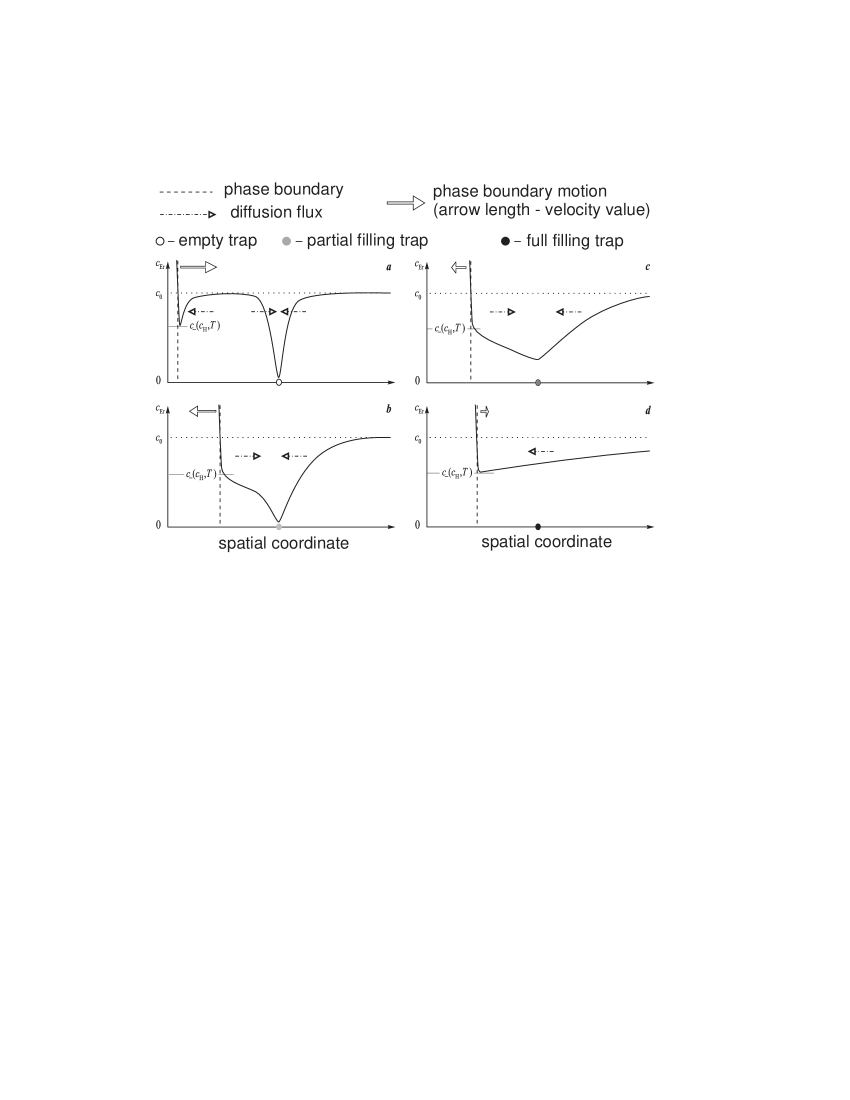
On the other side, if the parameter , because the characteristic time of trapping Er atoms by the defect is small, and its initial capacity is such that then, by virtue of equation (8), the defect will trap all the Er atoms located near it within a sufficiently short time . As the result the distribution of Er atoms in the vicinity of the defect will take the form shown in fig. 3 and it is characterized by small values of variable . As follows from the inequality and equations (11) this form does not change until the interface comes sufficiently close to the defect or until the defect is filled up with Er atoms. As it must, the width of the defect neighborhood depleted of Er atoms increases in time as . Therefore, for time scales and the defect neighborhood of thickness about several equation (8) gives the distribution of Er atoms approximately of the form:
| (14) |
and, in addition, the dimensionless rate of Er atom trapping is estimated as
| (15) |
Whence, in particular, setting we have got the estimate of the time during which distribution (14) develops.
After a lapse of time about the regions near the interface and the defect where the Er concentration exhibits substantial spatial variations begin to overlap and the resulting form of the Er distribution is shown on fig. 3. It is essential that in the given case the gradient of the Er concentration at the interface changes the sign, causing the interface to move in the opposite direction. As time passes further and the defect is filled with Er atoms its effect on distribution of Er atoms becomes weaker and the Er concentration in its immediate neighborhood starts to grow (fig. 3). Then as follows from the second equation of (11) and estimate (15) after a time the defect has practically no effect on diffusion of Er atoms and their distribution takes again the automodel form (12) (fig. 3). In this case the gradient of Er concentration at the interface changes the sign again and the interface motion returns to the initial direction.
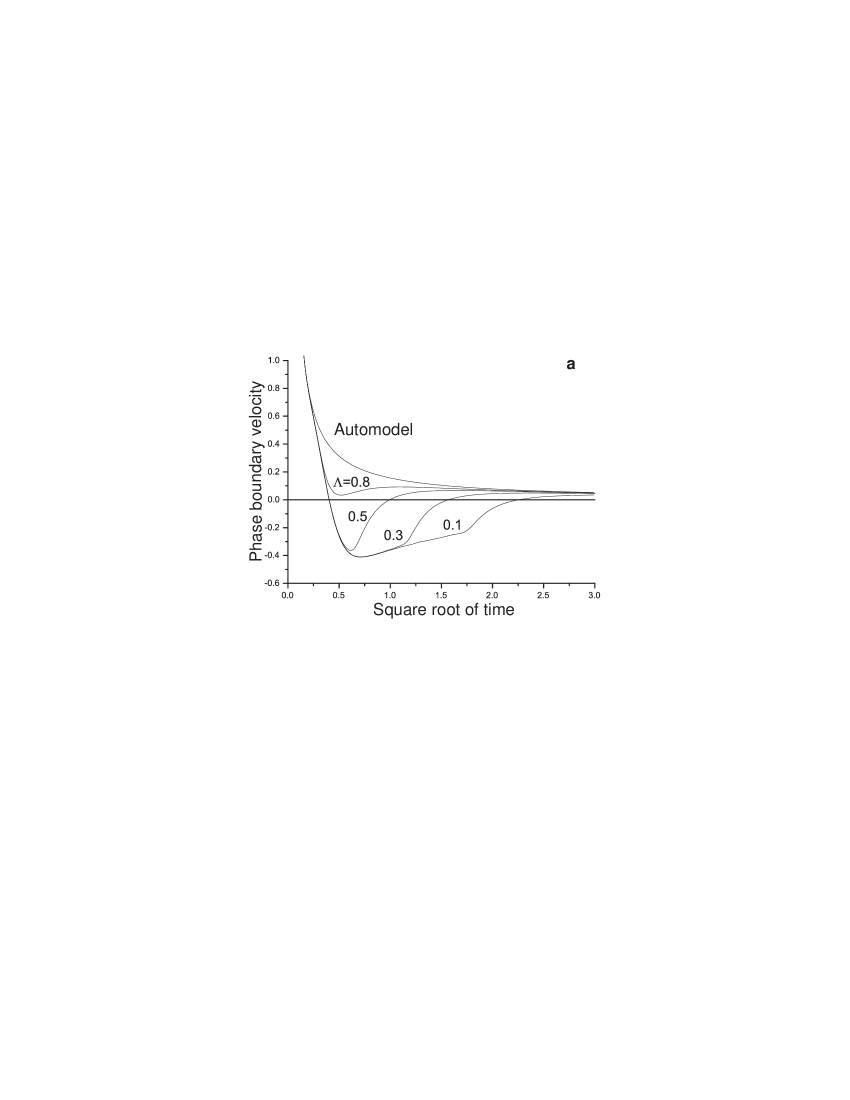
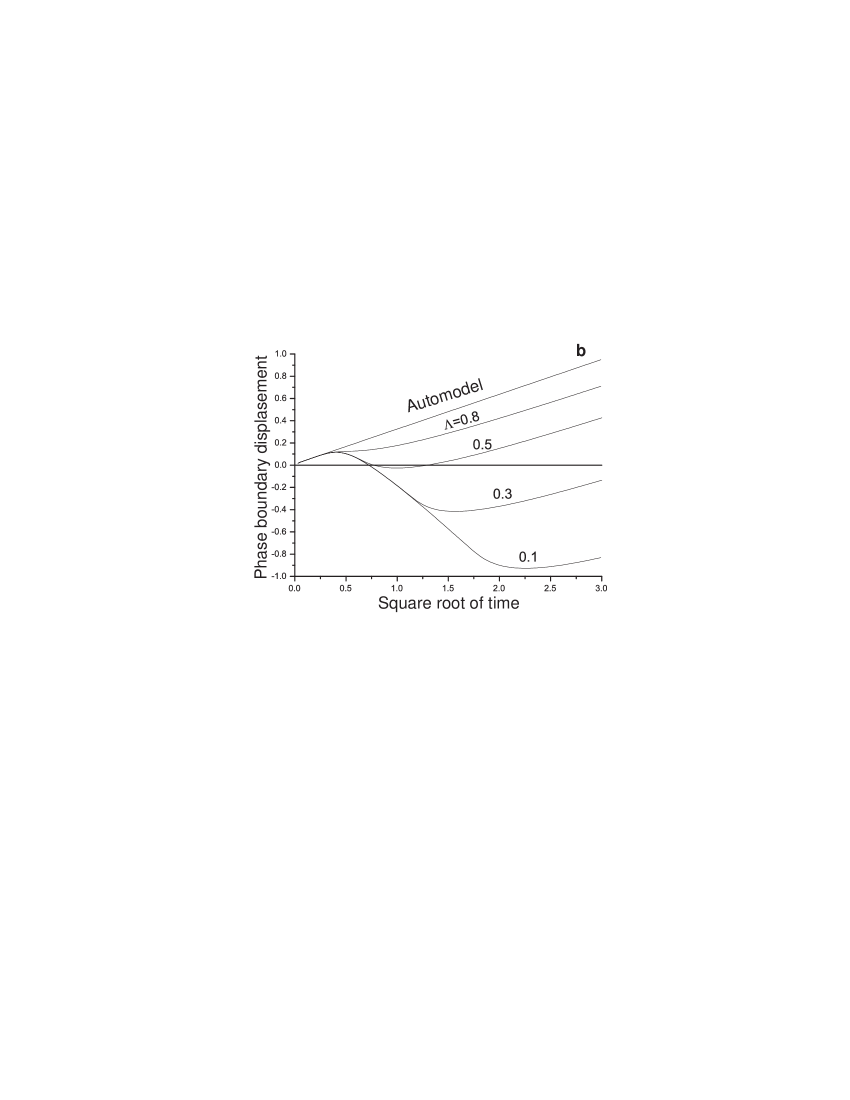
The described process is the basis of the proposed model for the nonmonotonic relaxation in system Pd–Er–H. So, to substantiate our speculations we present also curves describing the interface motion that have been obtained by solving equations (8)–(11) numerically. Fig. 4 illustrates the interface motion for various values of the defect capacity in the interval , with the other parameters being fixed, , , and . When the defect capacity is large enough so the parameter we see the nonmonotonic motion of the interface . We have taken the abscissa as the square root of time, , to make the results more clear. It is due to the fact that the second stage of the interface motion, i.e., when the interface moves in the direction opposite to the initial one, is characterized by the duration exceeding substantially the one of the first initial stage. It should be noted similar behavior of the relaxation processes has been observed experimentally [10, 13], where each of the points of time variations in the phase relative volumes changing sign is distant from preceding one by a more and more prolonged time interval. We point out once more that obtained results are of qualitative level and to compare quantitatively the experimental data and theoretical results a more sophisticated model is required.
4 Acknowledgments
The authors are grateful to A. L. Udovsky for the discussion and useful remarks, Russian Foundation of Basic Research for support, Grant 99-02-16135, and Universities of Russia, fundumental researching program, Grant 990156.
References
- [1] Hydrogen in metals (eds. G. Alefeld and J. Volki), Moscow, Mir publ., 1981, 467 p.
- [2] V. M. Avdjukhina, A. A. Katsnelson, G. P. Revkevich, Surf. Invest. (RSNI),14, n. 2, 30, 1999.
- [3] V. A. Goltzov, V. A. Lobanov, RAS USSR, 283, n. 3, 598, 1985
- [4] G. P. Revkevich, A. A. Katsnelson, V. M. Khristov, Metallophisika, 11, n. 3, 57, 1989
- [5] A. A. Katsnelson, M. A. Knyazeva, A. I. Olemskoi, Phys.Sol.St., 41,n. 9, 1621, 1999
- [6] E. Feder, Fractals, Moscow, Mir publ., 1991, 260 p.
- [7] M. B. Isichenko, Rev. Mod. Phys., 64, n. 4, p. 961, 1992.
- [8] V. S. Ivanova, A. S. Balankin, I. Zh. Bunin, A. A. Oksogoev, Synergy and fractals in science of material, Moscow, Nauka, 1994, 384 c.
- [9] A. I. Olemskoi, A. V. Khomenko, JETP, 110, n. 6, 2144, 1996
- [10] V. M. Avdjukhina, A. A. Katsnelson, D. A. Olemskoi, A. I. Olemskoi, G. P. Revkevich, Phys.Met.Met., 88, n. 6, 63, 1999
- [11] A. A. Katsnelson, A. I. Olemskoi, I. V. Sukhorukova, G. P. Revkevich, Physics-Uspekhi, 165, n. 3, 331, 1995
- [12] V. M. Avdjukhina, A. A. Katsnelson, G. P. Revkevich, Crystallogr.Rep., 44, n. 1, 49, 1999
- [13] V. M. Avdjukhina, A. A. Katsnelson, G. P. Revkevich, Khan Kha Sok and other, Alternative Energy and Ecology, 1, n. 1, 11, 2000
- [14] V. M. Avdjukhina, A. A. Katsnelson, N. A. Prokofiev, G. P. Revkevich, Mosc.Univ.Phys.Bull., 3, n. 2, 70, 1998
- [15] M. Myers, M. S. Baskes, H. K. Birnbaum et.al., Rev. Mod. Phys. 64, n. 2, 559, 1992
- [16] Z. Du, H. Yang, J. Alloys Comp. 299, 199, 2000
- [17] E. Lorenz, J. Atmosph. Scienc. 20, 130, 1963
- [18] A. I. Olemskoi, I. A. Sklyar, Physics-Uspekhi 162, n. 6, 29, 1992
- [19] A. Damask, J. Dins, Point defects in metals, Moscow, Mir publ., 1966, 291 p.
- [20] A. A. Smirnov, Molecular-kinetic theory of metals, Moscow, Nauka, 1966, 488 p.
- [21] A. A. Katsnelson, A. I. Olemskoi, Microscopic Theory of Nonhomogeneous Structures), Mir publ. (Moscow), AIP (New York), 1990, 357 p.
- [22] K. Kawasaki, T. Ohta, Prog. Theor. Phys., 67, 147, 1982
- [23] K. Kawasaki, T. Ohta, Prog. Theor. Phys., 68, 129, 1982