High Frequency Conductivity in the Quantum Hall Effect
Abstract
We present high frequency measurements of the diagonal conductivity of a two dimensional electron system in the integer quantum Hall regime. The width of the peaks between QHE minima is analyzed within the framework of scaling theory using both temperature ( mK) and frequency ( GHz) in a two parameter scaling ansatz. For the plateau transition width we find scaling behaviour for both its temperature dependence as well as its frequency dependence. However, the corresponding scaling exponent for temperature () significantly differs from the one deduced for frequency scaling (). Additionally we use the high frequency experiments to suppress the contact resistances that strongly influences DC measurements. We find an intrinsic critical conductivity , virtually independent of temperature and filling factor, and deviating significantly from the proposed universal value .
pacs:
quantum Hall effect, high frequency conductivity, scaling theoryFundamental progress in the understanding of the properties of a two-dimensional electron system (2DES) in high magnetic fields was brought by the application of scaling theory to the transition between quantum Hall plateaus (review huckestein95 and references therein). Within this theoretical picture the step in the Hall conductivity between quantized values and the corresponding maximum of the longitudinal conductivity are governed by a diverging localization length with filling factor and critical point near half integer filling. The exponent is believed to be universal with a value of found in numerical studies and size scaling experiments. The conductivities are given by scaling functions . is an effective length scale governed by sample size, temperature or frequency. The natural temperature dependent length scale is determined by the phase coherence length with deduced from experiment. Applying a high frequency to the system introduces an additional length scale, the dynamic length with dynamic exponent found from numerical studies huckestein99 . As a consequence of the length scales defined above the width of the conductivity peak around is predicted to follow power laws, with and with . The temperature dependence has been subject to many experiments, mostly with the result of from which follows . Only few experiments engel93 ; balaban98 ; kuchar00 addressed the frequency dependence and yielded contradicting results: While Engel et al. engel93 measured scaling behaviour with consistent with , an experiment of Balaban et al. balaban98 contradicts scaling.
Right at the critical point has its maximum value and is named critical conductivity . Following scaling theory this value should be independent of temperature, frequency and of the viewed transition identified by . Even further there are analytical arguments and numerical calculations for a sample independent universal critical conductivity value of (references in huckestein95 ), but most experiments do not even follow the first prediction.
In this paper we report frequency and temperature dependent measurements with and mK which are analyzed within the framework of scaling theory. The measured transition widths follow scaling behaviour and are analyzed using a two parameter scaling ansatz. We find different exponents and for frequency and temperature dependence.
The critical conductivities at low frequencies GHz are temperature, frequency and transition dependent which can be understood by contact effects. At high frequency contact effects are negligible and we measure a transition independent non-universal value .
The sample used in the present work is an AlGaAs/GaAs heterostructure grown by molecular-beam epitaxy containing a 2DES with a moderate electron mobility m2/Vs and an electron density m-2. The sample was patterned in a Corbino geometry with ohmic contacts fabricated by standard Ni/Au/Ge alloy annealing (see inset in Fig. 1). The Corbino geometry allows a two-point measurement of the diagonal conductivity which will be referred to as throughout this paper. The two-point measurement is the only possible type of measurement at microwave frequencies. The relation between the conductance with current and voltage and the conductivity is given by where m is the outer radius of the Corbino ring and m is its inner radius.
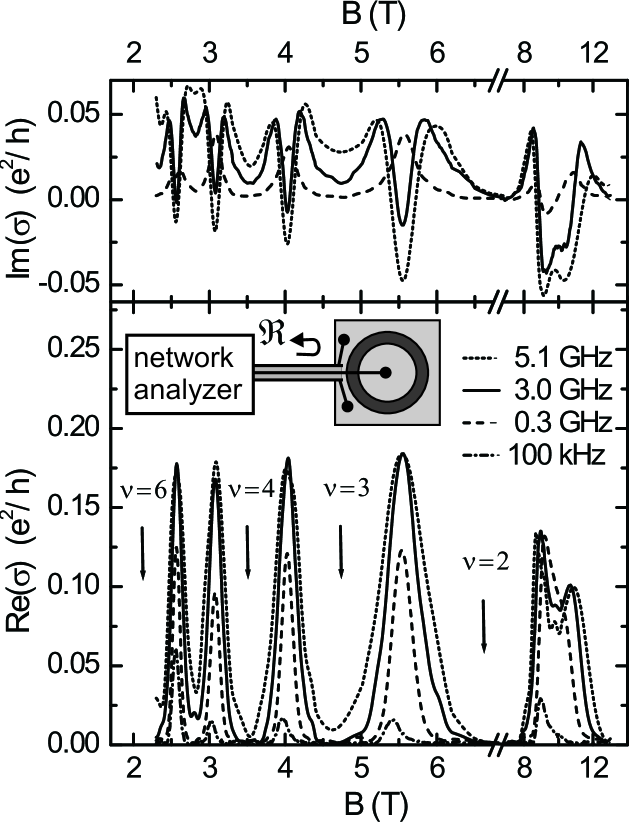
The sample was used as termination of a standard coaxial line with impedance . The deviation of the sample impedance from leads to reflection of a microwave signal fed into the line. The reflection coefficient at the end of the line is given by . By measuring this reflection coefficient we are able to deduce the conductivity . The setup would be most sensitive to changes in if the sample impedance was close to the line impedance . This is the reason why we chose such extreme aspect ratio of the Corbino disc yielding for the expected conductivity . We are still far away from , but a smaller ring width would lead to size effects. Sample and coaxial line were fitted into a dilution refrigerator with base temperature mK. Great care was taken on the thermal sinking of the coaxial line. An important point is a careful characterization of the frequency dependent losses, phase shifts and connector reflections of the coaxial line. With this information we are able to extract the frequency dependent sample reflection coefficient from the total reflection of the line measured with a network analyzer with frequency range kHz to GHz. The result of such a measurement of the sample conductivity as a function of the magnetic field is shown in figure 1. Our measurement technique naturally gives access to real and imaginary part of .
The measured amplitude of the Shubnikov-de Haas (SdH) oscillations of the real part of the conductivity strongly rises from 100 kHz to 300 MHz (figure 2). The magnetic field dependence of the imaginary part in this low frequency range is also distinct from the high frequency behaviour and shows SdH oscillation in phase with the real part. This contradicts scaling theory where frequency effects should be negligible for . With an electron temperature mK a marginal frequency dependence for GHz would follow.
The reason for this disagreement lies in the sample geometry: The two point Corbino geometry is sensitive to contact effects. An accumulation or depletion zone along the ohmic contacts leads to edge modes not expected for ideal contacts. Such effects were observed e.g. in sachrajda96 , and in recent work direct imaging of an edge structure in a Corbino geometry was performed ahlswede00 . This edge structure leads to an additional resistance in series with the 2DES and therefore a reduced total DC-conductance of the sample. The DC-transport mechanism from the contacts into the edge structure and further into the undisturbed 2DES is probably governed by tunneling processes. This explains the low values of the critical conductivity, which also depend on the filling factor, measured in most experiments using Corbino geometry.
For AC-transport an additional transport mechanism from contact to undisturbed (bulk) 2DES is opened. This might be capacitive coupling as hinted by in an intermediate frequency range represented by MHz in figure 1. At sufficiently high frequencies the additional edge series resistance becomes small compared to the resistance of the bulk 2DES and the conductance measurement yields the true conductivity of the electron system. For our measurement this is true for GHz. Since we got rid of the disadvantages of Corbino geometry, namely the contact resistance, by applying high frequency, we are left with an advantage in comparison to Hall geometry: Using Corbino geometry we have direct access to the longitudinal conductivity, while for Hall geometries it is necessary to invert the resistivity tensor with possible errors due to geometry and inhomogeneities.
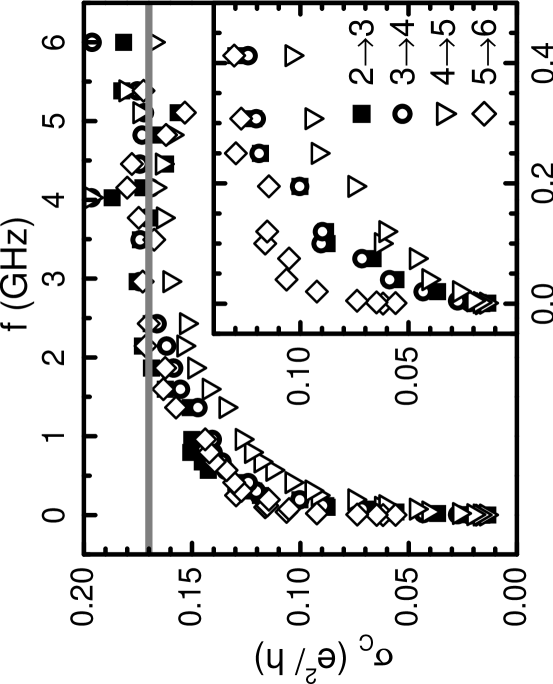
For high frequencies scatters around and shows no further systematic frequency or filling factor dependence (figure 2). Also the temperature dependence of at these high frequencies is found to be negligible, whereas shows a strong decrease with decreasing temperature at low frequencies. Again this behaviour can be modeled by a strongly temperature dependent edge resistance in series with the intrinsic 2DES resistance.
At high frequencies the critical conductivity follows the predictions of scaling theory, but is still significantly lower than the proposed universal value . It is of the same order of magnitude as the values found by Rokhinson et al. rokhinson95 in one of the few experiments without apparent filling factor dependence. Believing in universality one possible explanation for our experimental findings was given by Ruzin, Cooper and Halperin ruzin96 . They showed that macroscopic inhomogeneities of the carrier density would lead to a critical conductivity deviating from its universal microscopic value.
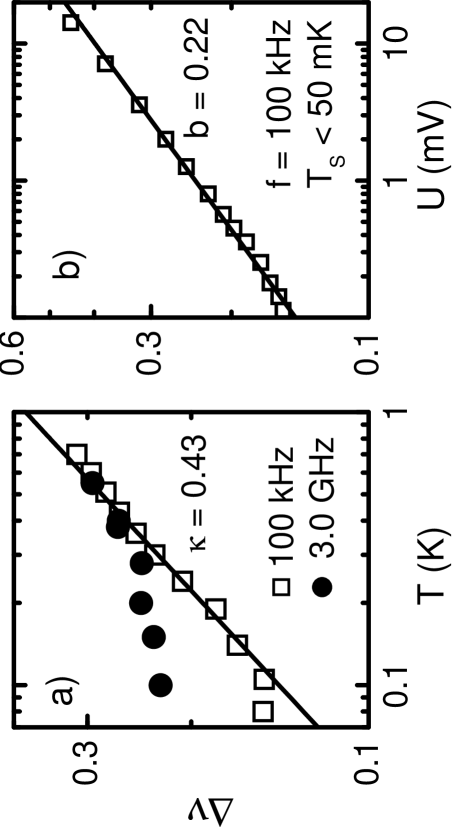
Leaving the critical point the next step is an analysis of the transition width between quantum Hall plateaus. Before heading to frequency scaling the first step is to test for temperature scaling. Figure 3a) shows the temperature dependence of the plateau transition width plotted on logarithmic scale. The plot is representative for all transitions in the filling factor range to . The low frequency curves are well described by a power law with best fit results for different transitions. This result was tested at different frequencies (100 kHz and 300 MHz) and fits the commonly measured exponent which is expected for and . Our data does not fit the linear dependence found in an experiment of Balaban et al. balaban98 . Using the scaling behaviour of the transition width as low temperature thermometry for the electron system we estimate an electron temperature for a base temperature mK between 100 mK and 150 mK, slightly dependent on magnetic field.
A second confirmation of scaling behaviour is given by the voltage dependence of shown in figure 3b): It follows a power law . Interpretation due to a voltage dependent effective temperature with leads to . An exponent equivalent to leads to which fits our data.
The second data set in figure 3a) with GHz represents the situation at high frequencies with defined as the FWHM of the real conductivity : At low temperatures the transition width is no longer temperature dependent, but is determined by the frequency.
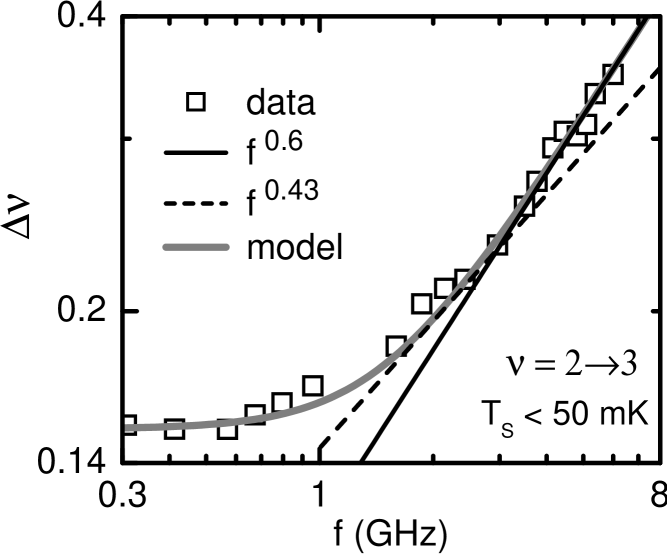
In figure 4 the frequency dependence of is plotted for plateau transition . As shown in the previous section the frequency governs the transition width for GHz while for GHz the electron temperature leads to saturation. This restricts a conventional scaling analysis to a frequency range GHz. A power law fit in this range is shown as straight line and leads to an exponent , which is higher than the expected 0.43 for and . For comparison a power law with this exponent is plotted as dashed line. It is clearly less favourable than the higher exponent. To overcome the unsatisfactory small fitting range it is necessary to incorporate both frequency and temperature into the scaling analysis. We chose as an ansatz . The motivation is an addition of scattering rates: The power law of the phase coherence length follows from with the inelastic scattering rate and diffusion constant . Interpreting in analogous way as frequency scattering rate the Mathiessen rule leads to the proposed ansatz. The resulting transition width is
One of the parameters , and can be chosen arbitrarily. Here we choose K and use , and from temperature and voltage scaling. A least square fit with remaining parameters and for transitions in the filling factor range to leads to compatible with an exponent for pure frequency scaling and deviating from the expected dynamical exponent . The fit is shown as grey line in figure 4.
In conclusion we were able to measure the frequency dependent complex conductivity of a 2DES at quantizing magnetic fields and temperatures mK up to 6 GHz. This allows us to overcome contact effects and to measure the critical conductivity at the quantum Hall plateau transition which deviates from the proposed universal value. Second we performed a scaling analysis of the plateau transition width and incorporated a two parameter ansatz, taking into account both temperature and frequency. We find significantly different scaling exponents for these two parameters which are so far not understood theoretically.
References
- (1) B. Huckestein, Rev. Mod. Phys. 67, 357 (1995).
- (2) B. Huckestein and M. Backhaus, Phys. Rev. Lett. 82, 5100 (1999).
- (3) L. W. Engel, D. Shahar, C. Kurdak, and D. C. Tsui, Phys. Rev. Lett. 71, 2638 (1993).
- (4) N. Q. Balaban, U. Meirav, and I. Bar-Joseph, Phys. Rev. Lett. 81, 4967 (1998).
- (5) F. Kuchar, R. Meisels, K. Dybko, and B. Kramer, Europhys. Lett. 49, 480 (2000).
- (6) A. S. Sachrajda et al., Superlatt. Microstruct. 20, 651 (1996).
- (7) E. Ahlswede et al., private communication and to be published in Physica B.
- (8) L. P. Rokhinson, B. Su, and V. J. Goldman, Solid State Commun. 96, 309 (1995).
- (9) I. M. Ruzin, N. R. Cooper, and B. I. Halperin, Phys. Rev. B 53, 1558 (1996).