Macroscopic and Local Magnetic Moments in Si-doped CuGeO3 with Neutron and SR Studies.
Abstract
The temperature-concentration phase diagram of the Si-doped spin-Peierls compound CuGeO3 is investigated by means of neutron scattering and muon spin rotation spectroscopy in order to determine the microscopic distribution of the magnetic and lattice dimerised regions as a function of doping. The analysis of the zero-field muon spectra has confirmed the spatial inhomogeneity of the staggered magnetisation that characterises the antiferromagnetic superlattice peaks observed with neutrons. In addition, the variation of the macroscopic order parameter with doping can be understood by considering the evolution of the local magnetic moment as well as of the various regions contributing to the muon signal.
pacs:
75.30.KMagnetic phase boundaries (including magnetic transitions, metamagnetism, etc.) and 76.75.+iMuon spin rotation and relaxation and 75.25.+zSpin arrangements in magnetically ordered materials (including neutron and spin-polarised electron studies, synchrotron-source x-ray scattering, etc.)1 Introduction
Since the first observation that the inorganic compound CuGeO3 undergoes a spin-Peierls (SP) transition Hase93 , an extensive study of the doped system has been undertaken. Site (Cu1-xMxGeO3) Coad96 ; Hase96 ; Martin97 and bond (CuGe1-xSixO3) doping Regnault95 ; Hirota98 studies have revealed the existence of a new antiferromagnetic phase below the SP ordering temperature TSP. Grenier et al. Grenier98-1 have shown that the temperature concentration(T-x) phase diagram for site and bond doping in CuGeO3 exhibits a similar behaviour. The main features are the reduction of TSP with increasing doping concentration, the suppression of the SP transition at a critical concentration xc, the onset of an AF phase characterised by an ordering temperature TN increasing with x, and decreasing for concentrations larger than xc. The critical concentration xc is of the order of 3% for site doping and about three times smaller for the bond doping scenario.
An inspection of Mg-doped compounds near xc by means of magnetic susceptibility Masuda98 and neutron scattering measurements Nakao99 has provided a more detailed description of the phase diagram for the site-doped SP. The ordering temperature TN and the order parameter of the antiferromagnetic phase exhibit a discontinuity at xc 2.7%. The interpretation that has been proposed is that doped CuGeO3 undergoes a first order phase transition at the critical concentration xc that constitutes a compositional phase boundary. A distinction is therefore introduced between a dimerised AF phase (D-AF) below xc , and a uniform AF phase for higher concentration (U-AF). Susceptibility measurements near xc performed by Masuda et al. Masuda00 have revealed the presence of a double peak region, which was interpreted as a coexistence of both D-AF and U-AF phases. In addition they have performed high-resolution synchrotron diffraction on the (3/2 1 3/2) superlattice reflection. For low doping, the X-ray peak profile is resolution limited, indicating the presence of long range order in the lattice dimerisation. In the region of doping which exhibits the double peak in the susceptibility, the superlattice X-ray peak broadens, thus indicating the onset of short range order in the SP phase.
On the other hand, an extensive study of Si-doped compounds with susceptibility measurements was performed by Grenier et al. Grenier98-2 . They have shown that the introduction of Si ions reduces the intensity of the signal attributed to the dimerised phase. Moreover an additional peak appears below TSP, which is interpreted as the onset of an antiferromagnetic ordering at a temperature TN. Above TN, they observe an additional intensity in the susceptibility which is attributed to the freeing of S=1/2 spins near the doping centers. The proportion of the SP signal linearly decreases with increasing doping, whereas the proportion of free spins increases. However, no double peak feature is observed in the susceptibility measurements in the vicinity of the critical doping concentration where the SP phase collapses.
In order to explain the effect of impurities on the SP phase a theoretical model has been proposed by Saito and Fukuyama Saito97 ; Saito99 . A phase Hamiltonian that describes a one-dimensional AF chain coupled with a 3D lattice distorsion field was used. The observation of both SP and AF signatures can be consequently explained by considering a ground state where two long range order parameters coexist with a spatial variation. The lattice dimerisation is minimal near the doping centers, where the staggered magnetisation takes its maximal value. Moreover, the phase transition from D-AF to U-AF is predicted to be of first order if the spin-phonon coupling is small when compared with the interchain interaction. A first experimental evidence of the spatial inhomogeneity for the magnetic moments was seen with muon spin rotation experiments on Si- and Zn-doped CuGeO3 compounds Kojima97 .
In the present work we report a detailed study of the temperature-concentration (T-x) phase diagram of Si-doped CuGeO3 single crystals by means of neutron diffraction as well as zero-field field muon spin rotation (SR). The different signals observed with the neutrons, namely the AF and SP superlattice peaks, are interpreted in terms of volume fractions via the analysis of the zero-field muon spectra. Finally, the local magnetic moment measured by SR is compared with the macroscopic order parameter obtained by neutron diffraction.
2 Experimental Details
The Si-doped CuGeO3 single crystals have been grown using the floating zone method. The impurity concentration has been determined by means of inductively coupled plasma atomic emission spectroscopy (ICP-AES), with an accuracy of about 0.1%. The samples have been characterised by bulk susceptibility measurements which have been published elsewhere Masuda00-2 .
The elastic neutron scattering experiments have been performed on the three-axis spectrometer for cold neutrons TASP, at the neutron spallation source SINQ, on a series of doped CuGe1-xSixO3 crystals (0.7% 3.8%). The incident neutron wave vector was kept fixed at = 2.662 Å-1. Higher-order neutrons have been suppressed by using a pyrolitic graphite filter. The samples have been oriented with the () zone in the scattering plane, and mounted in an ILL-type cryostat, which achieves a base temperature of 1.5K.
Zero field SR measurements have been performed on the spectrometers GPS and LTF, at the muon facility of PSI. The polarisation of the incident muon beam was parallel to the a-axis of the sample.
3 Results
3.1 Neutron diffraction
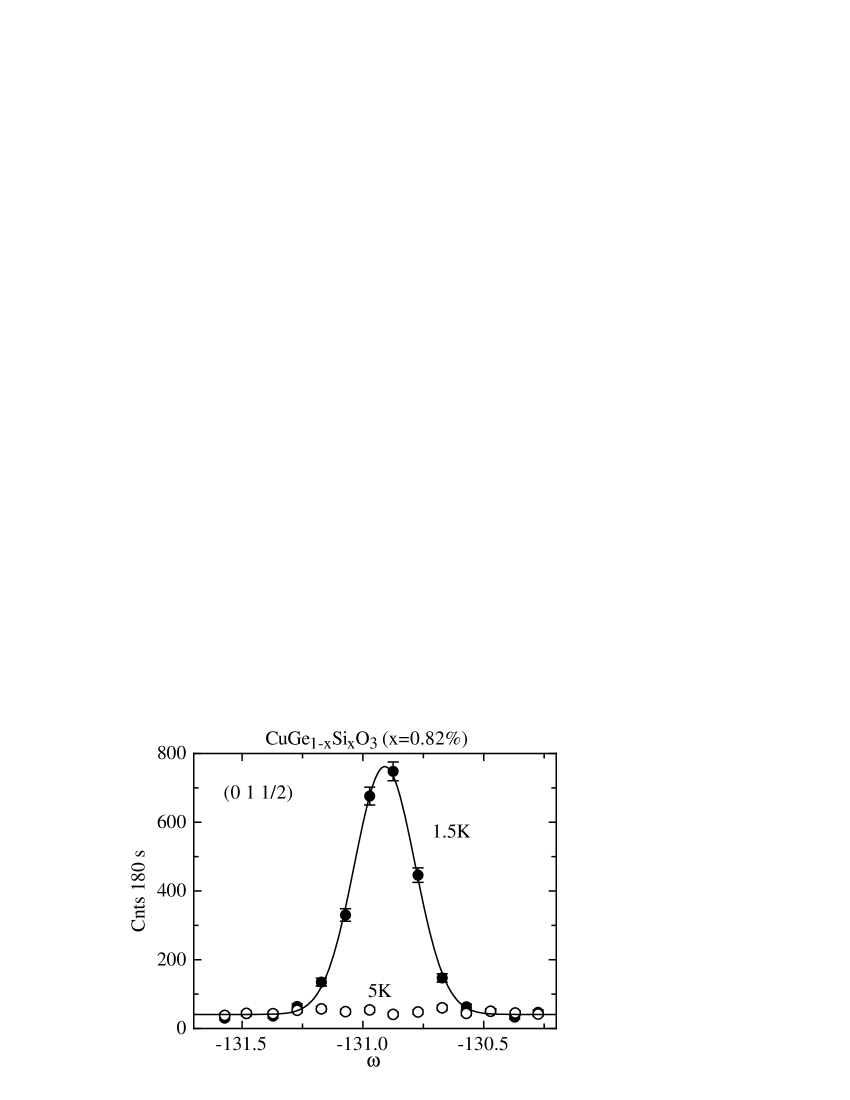
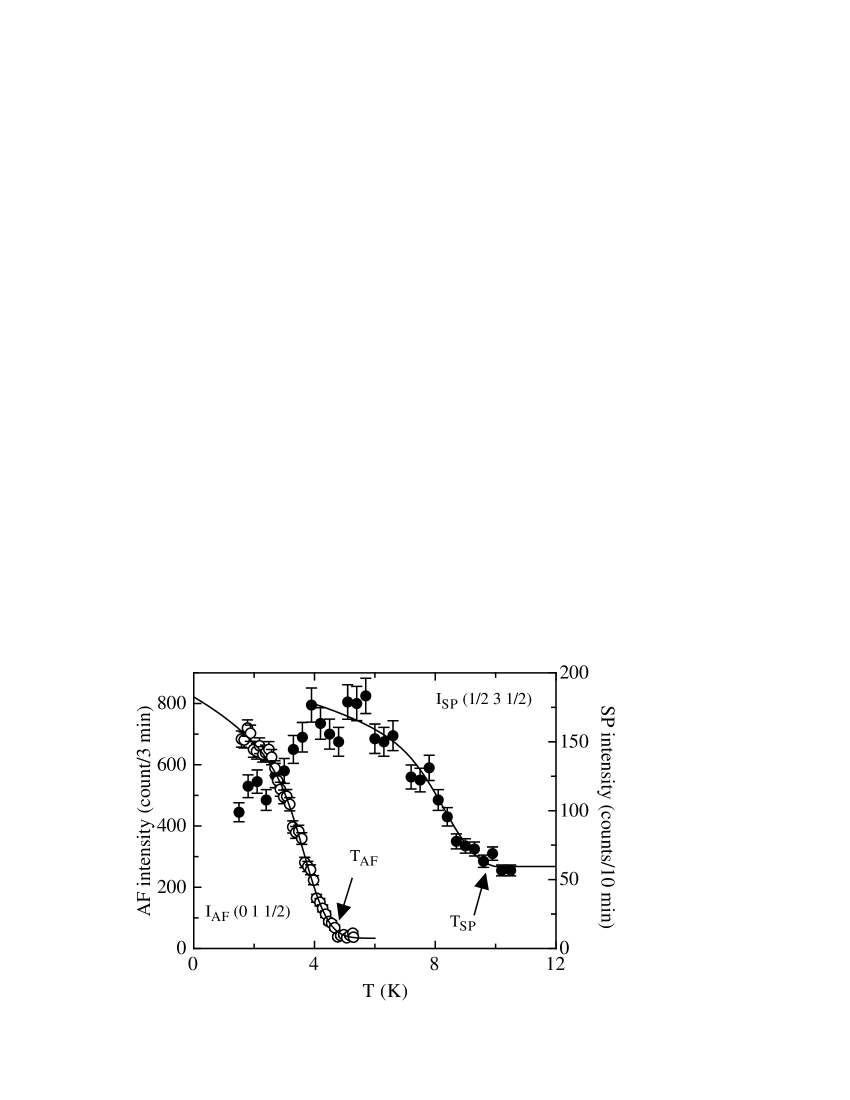
A typical profile of an antiferromagnetic superlattice peak is shown in Fig. 1 for the 0.82% sample. The temperature dependence of the maximum intensity is presented in Fig. 2. In order to confirm the onset of the SP dimerisation in the low doping regime, the reflection (1/2 3 1/2) was also measured. The magnetic intensity has been fitted with the following equation Hase96 :
| (1) |
which describes the critical behaviour of the magnetic intensity near the AF transition, weighted with a Gaussian distribution for TN that accounts for inhomogeneities in the sample. N is a normalisation constant, the critical exponent and the nonmagnetic background contribution. The exponent remains almost constant over the whole diagram, with an average value of about , similar to that observed in Zn-doped crystals Hase96 . The inhomogeneity in the concentration provides a of about K. The temperature dependence of the SP peak shown in Fig. 1 was fitted with a function similar Nakao99 to the one of Eq. 1.
The effective magnetic moments have been calculated by normalising the magnetic intensity at the saturation value with the nuclear structure factor of the (0 2 1) reflection, and corrected for the magnetic form factor of the free Cu2+ ion ITC . We emphasise that the neutron diffraction technique is a non local probe, and hence does provide a macroscopic order parameter, that is averaged over the whole volume of the sample.
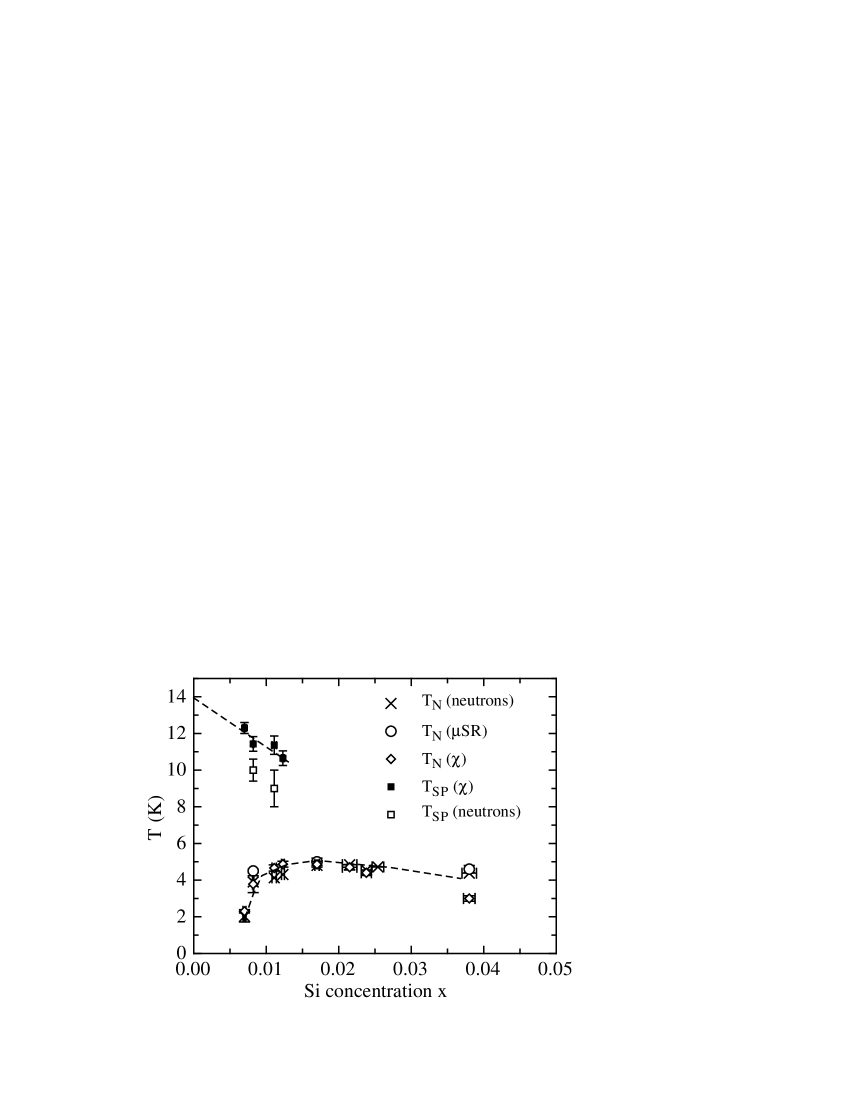
As a next step, selected samples (0.82%, 1.7%, 2.38% and 3.8%) belonging to the series of single crystals measured with neutrons have been investigated by muon spin rotation spectroscopy in the three temperature regions that have been determined with neutron and susceptibility measurements, according to the experimental T-x diagram presented in Fig. 3. The values obtained from the various techniques are found to be in good agreement, indicating that the muon and the neutrons observe a magnetic ordering at the same transition temperature. The observation of the SP dimerisation in susceptibility data for the samples in the low doping regime is also confirmed by neutrons. The discrepancy between both methods is due to the fact that the SP superlattice peak that is measured with neutrons becomes extremely small while approaching the critical concentration. Furthermore, we emphasise that TSP is not observed above x=1.2%.
3.2 SR results
In the paramagnetic phase, the zero-field muon spectra have been fitted with the Kubo-Toyabe function which accounts for the muon depolarisation originating from the nuclear moments (the depolarisation rate is of the order of 0.08 MHz). By lowering the temperature, in the low doping regime, the muon spectrum can be still explained by the same relaxation function, as it was observed for pure CuGeO3 Lappas94 . In the magnetically ordered phase, below TN, the muon depolarisation in zero field was analysed over the whole doping regime with the following function (see also Kojima97 ):
The first term in Eq. 3.2 describes a non-precessing part of the muon signal, which relaxes at a rate , whereas the second term reflects a precessing part of the muon polarisation, where is the depolarisation rate and the initial phase shift. The total observed amplitude () is significantly lower than the total amplitude observed above TN, indicating that part of the muon ensemble is depolarised within the dead time of the spectrometer ( a depolarisation rate higher than ca. 150 MHz).
According to the T-x diagram shown in Fig. 3, the emergence at low temperature of the precessing signal () in zero-field is attributed to the ordering of the Cu2+ moments near the doping centers. In this vein, the frequency , which is proportional to the magnetic field at the muon site, mirrors the static ordering of the moments.
The relaxing component in Eq. 3.2 is ascribed to sample regions where no coherent static magnetism is present. However, the similar temperature dependence of and (see Fig. 4 and the inset of Fig. 5) indicates that these regions have reduced dimensions, leading to a detectable influence of the ordered neighbouring regions on the field distribution (where is the gyromagnetic ratio of the muon) at the muon sites. This supports the idea that there is no macroscopic phase separation in the samples over the whole doping range, similarly to what was observed by Kojima et al. for Si- and Zn-doped CuGeO3 compounds in the low doping regime Kojima97 . Therefore, and similarly to the parameter , the parameter can be taken as a measure of the static ordered moments. Since the parameter appears to be better determined than and consequently will be utilised in the following discussion as a measure of the static moment.
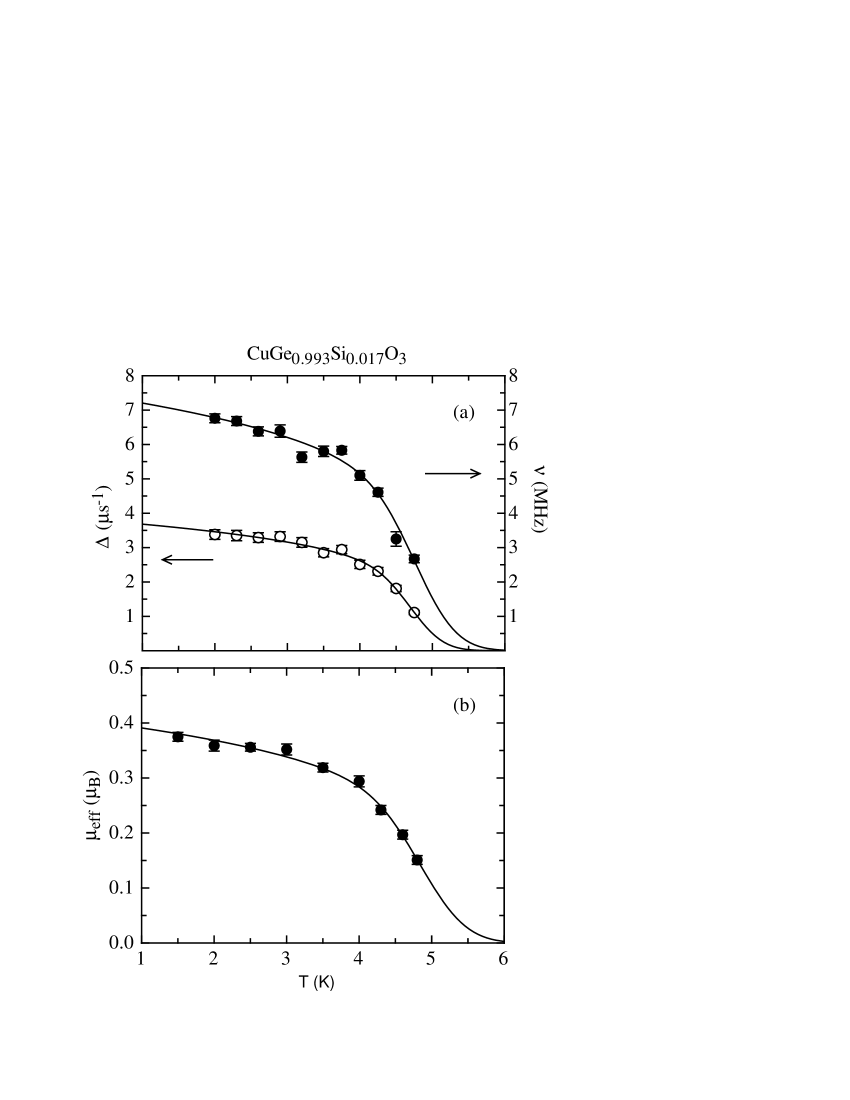
The doping dependence of the relaxation rate , extrapolated at the saturation value, is shown in Fig. 5. The dependence upon Si-doping is almost constant within the precision of the experimental values. exhibits however an increase above x=2.38%. According to the direct relation between and , this behaviour indicates that within the doping range that has been investigated the local magnetic field at the muon sites, and therefore the ordered moment increases only slightly with increasing temperature.
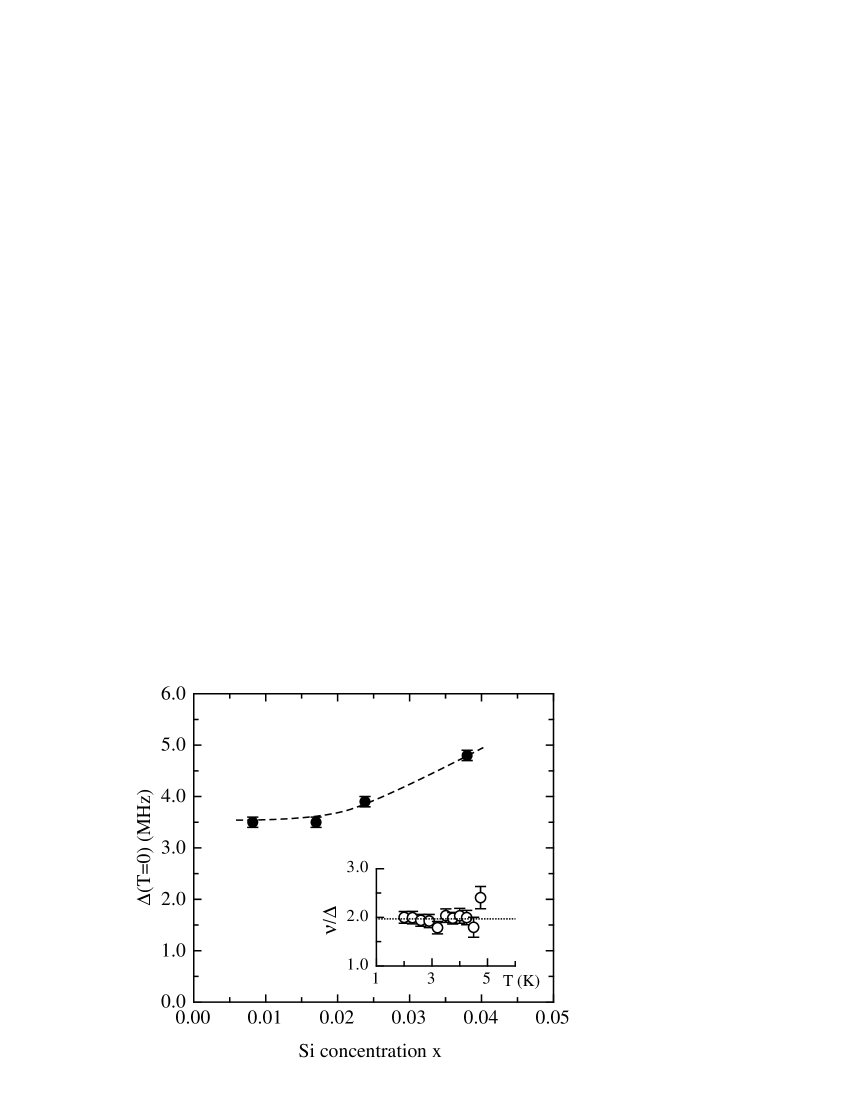
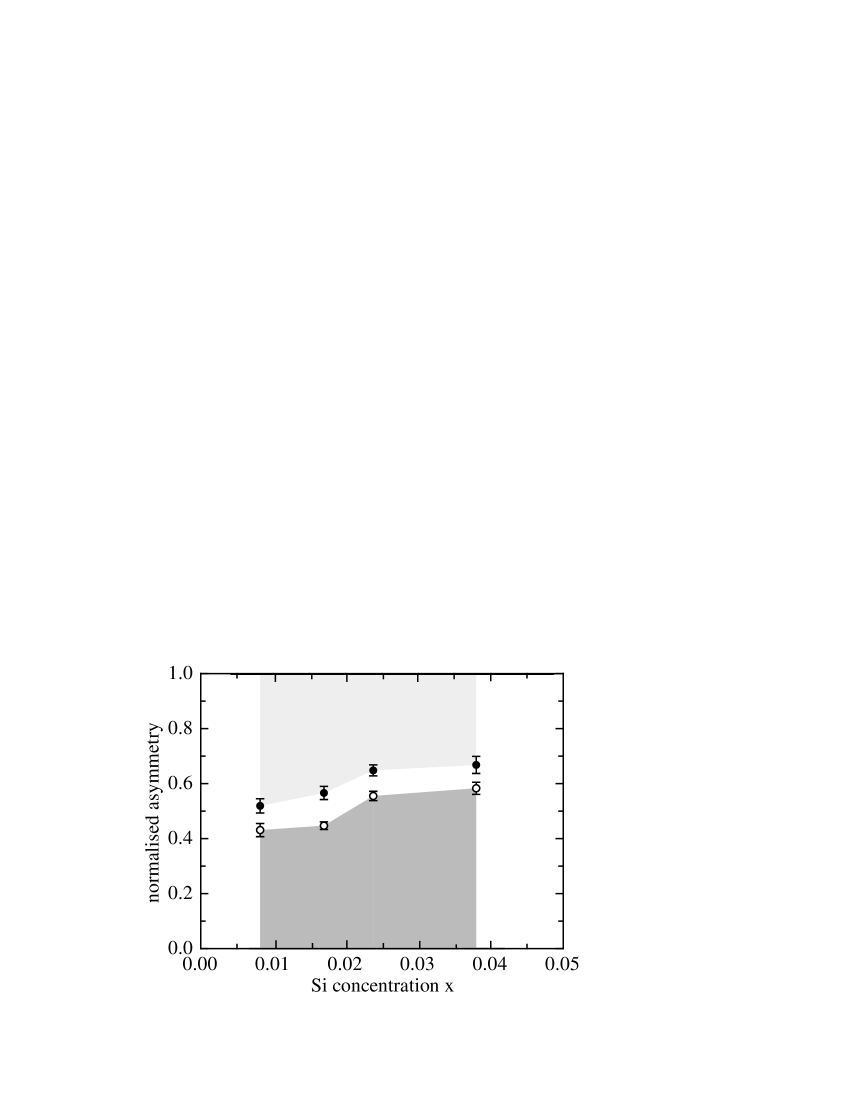
Figure 6 shows the evolution of the the normalised amplitudes (light grey area) and (white area), as a function of Si concentration. The amplitudes have been normalised with respect to the total muon asymmetry , that was determined in the paramagnetic phase. We obtain that the amplitude corresponding to the magnetically ordered phase, , represents about 10% of . The relaxing part lies on the other hand between 40% and 60%. The part of (dark grey area in Fig. 6) that could not be detected ( 40%) will be discussed below.
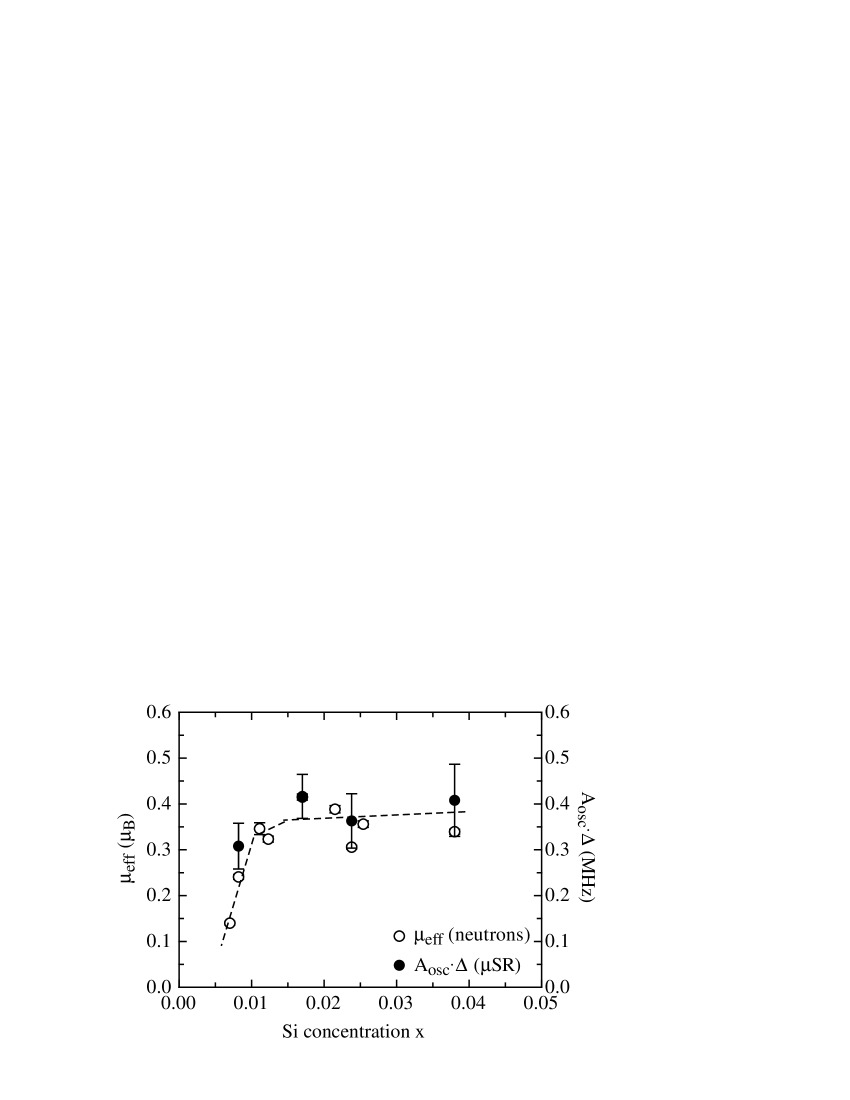
In order to compare the local magnetic properties of the doped samples, as provided by the muons, with the macroscopic order parameter measured with neutrons, we use the quantity . In this product, the local magnetic moment (proportional to ) is hence weighted with the volume fraction () of magnetised regions present in the sample.
The dependence of the AF order parameter as a function of concentration is shown in Fig. 7, as obtained by both neutron diffraction and zero-field SR methods. is seen to increase with the doping concentration, reaches a maximum at xc= 1.7%, where the SP signal is not observed anymore (see Fig. 3).
4 Discussion
The agreement between neutron and SR results (see Figs. 3 and 7) allows to associate the precessing signal, referred to Aosc, with the D-AF phase in the low doping regime, and with the U-AF phase in the high doping regime.
The purely relaxing signal, Arlx, is attributed, for 1.23%, to the regions where the lattice dimerisation is maximal. However, for higher doping concentrations, this amplitude does not disappear. It is thought to arise from an increase of static magnetic disorder that is induced by high doping.
As the sum of and constitutes not more than 60% of the total muon asymmetry in the whole investigated doping regime, we may attribute the loss of signal to the boundary between the AF regions and the dimerised regions where a rapid spatial variation of the magnetisation gives rise to large field gradient and therefore leads to a depolarisation rate too fast to be observed by the SR spectrometer. However, the neutrons are sensitive to these boundary regions that contribute to the intensity of the AF peaks.
The SR measurements have shown on the other hand that the muon signal described by Arlx is influenced by the dipolar fields of the magnetically ordered regions and still undergoes a depolarisation. This is a clear sign that the domains contributing to the purely relaxing muon signal have a limited size. Considering the magnitude of the magnetic moments that are determined by neutron diffraction, 0.1 to 0.4 , the maximal distance over which the muon still sees a dipolar field is estimated to be 15 Å. By considering an homogeneous distribution of impurities along the spin chains, this distance corresponds to 5 lattice units in both directions on each side of the muon site. The present measurements confirm the spatial inhomogeneity of the magnetic moments that was predicted theoretically Saito97 ; Saito99 .
The maximum in the order parameter that was observed by neutron diffraction at xc=1.7% refers to a macroscopic value. In other words, the magnetic moment determined by this technique is averaged over the whole volume of the sample. The results provided by SR indicate that the volume fraction of the magnetically ordered regions as well as the boundary regions varies upon doping. On the other hand, no anomaly is seen in the local magnetic moment near the critical value xc. We suggest therefore that the variation of the macroscopic AF order parameter upon doping is controlled by a variation in the volume fraction of magnetic domains rather than by a drastic change of the magnetic moments.
5 Conclusion
The compilation of information provided by neutron and SR have provided a detailed insight about the origin of the various magnetic and non magnetic contributions observed in the Si-doped CuGeO3. The SR results have revealed that the regions that contribute to the antiferromagnetic and lattice dimerisation peaks observed by neutron and susceptibility in the Si-doped CuGeO3 have a typical size of 5 lattice units along the spin chains.
Furthermore, the doping variation of the magnetic moment measured with neutrons could be explained via the evolution of the volume fraction attributed to magnetically ordered regions near the impurity centers.
One of the authors (F.S.) would like to thank the ETH-Council for the supply of a research grant. The U.S. Department of Energy is also acknowledged for financial support (G.S.).
References
- (1) M. Hase, I. Terasaki and K. Uchinokura, Phys. Rev. Lett. 70, (1993) 3651.
- (2) S. Coad, J.G. Lussier, D.F. McMorrow and D. McK Paul, J. Phys.: Condens. Matter 8, (1996) 6251.
- (3) M. Hase, K. Uchinokura, R.J. Birgeneau, K. Hirota and G. Shirane, J. Phys. Soc. Jpn. 65, (1996) 1392.
- (4) M.C. Martin, M. Hase, K. Hirota, G. Shirane, Y. Sasago, N. Koide and K. Uchinokura, Phys. Rev. B 56, (1997) 3173.
- (5) L.P. Regnault, J.P. Renard, G. Dhalenne and A. Revcolevschi, Europhys. Lett. 32, (1995) 579.
- (6) K. Hirota, M. Hase, J. Akimitsu, T. Masuda, K. Uchinokura and G. Shirane, J. Phys. Soc. Jpn. 67, (1998) 645.
- (7) B. Grenier, J. P. Renard, P. Veillet, C. Paulsen, R. Calemczuk, G. Dhalenne and A. Revcolevschi, Phys. Rev. B 58, (1998) 8202.
- (8) T. Masuda, A. Fujioka, Y. Uchiyama, I. Tsukada and K. Uchinokura, Phys. Rev. Lett. 80, (1998) 4566.
- (9) H. Nakao, M. Nishi, Y. Fujii, T. Masuda, I. Tsukada, K. Uchinokura, K. Hirota and G. Shirane, J. Phys. Soc. Jpn. 68, (1999) 3662.
- (10) T. Masuda, I. Tsukada, K. Uchinokura, Y. J. Wang, V. Kiryukhin and R. J. Birgeneau, Phys. Rev. B 61, (2000) 4103.
- (11) B. Grenier, J. P. Renard, P. Veillet, C. Paulsen, G. Dhalenne and A. Revcolevschi, Phys. Rev. B 57, (1998) 3444.
- (12) M. Saito and H. Fukuyama, J. Phys. Soc. Jpn. 66, (1997) 3259.
- (13) M. Saito, J. Phys. Soc. Jpn.68, (1999) 2898.
- (14) K. M. Kojima et al., Phys. Rev. Lett. 79, (1997) 503.
- (15) T. Masuda et al., Physica B, 284 (2000) 1637.
- (16) A.J.C. Wilson, International Tables for Crystallography Vol. C (1992) 391.
- (17) A. Lappas, K. Prassides, A. Amato, R. Feyerherm, F.N. Gygax and A. Schenck, Z. Phys. B, 96 (1994) 223.