Phase separation in La0.5Ca0.5MnO3 doped with 119Sn detected by Mössbauer spectroscopy
Abstract
119Sn-doped La0.5Ca0.5MnO3 was studied by Mössbauer spectroscopy, magnetic moment and resistivity measurements. The Mössbauer spectra below the charge-ordering temperature are explained with ferromagnetic (FM), antiferromagnetic (AF), and ferromagnetic spin cluster (CL) components. The magnetic and thermal hystereses of the relative intensities of the components observed in the Mössbauer spectra, and of the bulk properties such as magnetic moment and electrical resistivity, in the temperature range K, are characteristic of phase equilibrium in a first-order transition, i.e. of phase separation in the system below the charge-ordering (CO) transition. The cluster component displays a significant hyperfine field up to K. Above this temperature it exhibits superparamagnetism, becoming the dominant component above the charge-ordering transition. These results are discussed in the framework of recent investigations of the manganite system with other techniques which also show phase separation.
I Introduction
The Lanthanum manganite series La1-xCaxMnO3 presents a remarkably complicated phase diagram as the number of Mn4+ changes. [1, 2, 3] For the ground state is a FM metal and above a charge ordered AF insulator. [4, 5] In the intermediate doping regime, mixtures of the two phases have been observed and close to it was shown that even a small variation of the Mn4+ content can greatly change the properties. [6]
The co-existence of FM and AF phases (or phase separation) in this doping regime has been predicted theoretically [7, 8] and witnessed by a number of techniques. This co-existence can be expected since the energies of the two relevant interactions (double-exchange and superexchange) are comparable. This energetic argument is supported by the fact that application of an external magnetic field changes the energy balance enhancing the FM phase through a melting transition of the charge-ordered lattice. [9, 10] In bulk magnetization measurements, the high value of the magnetic moment observed at low temperatures implies the existence of a ferromagnetic component (its amount varies with the sample preparation route). [2, 6, 9, 10] Electron diffraction studies [11, 12] have shown that, between and K, La0.5Ca0.5MnO3 is an inhomogeneous spatial mixture of incommensurate charge-ordered and ferromagnetic charge-disordered microdomains with a size of Å(chemical inhomogeneities have been ruled out with electron microprobe analysis with a spatial resolution of Å). Phase separation was detected by local NMR probes (139La, 55Mn) at all temperatures below the first formation of the CO state in La0.5Ca0.5MnO3. [13, 14] Mössbauer specrtroscopy in 57Fe-doped La0.5Ca0.5MnO3 has also shown coexistence of the two phases and manifested clearly the thermal and magnetic history dependence of their relative fractions. [10] Finally, coexistence of charge ordered AF and charge disordered FM phases was observed below the charge-ordering transition by neutron diffraction measurements in the [15] and compounds. [16]
In this paper, we report a detailed Mössbauer study of La0.5Ca0.5MnO3 doped with 119Sn. The aim is to follow microscopically the evolution of the phases that appear as the temperature is varied. The latter substitutes for Mn4+ and serves as a probe of the magnetic state of the host lattice through the transferred hyperfine interactions from its neighbor Mn magnetic ions in a similar fashion with the 139La probe in NMR investigations. The results show phase separation at all temperatures below the CO temperature as witnessed by the FM and AF components in the Mössbauer spectra. A third component appearing in the Mössbauer spectra even at K is attributed to spin clusters. The relative intensities of these components show thermal and magnetic hysteresis,indicating that the FM-AF transition is of first-order. Hysteretic behavior is also displayed in bulk magnetic moment and resistivity measurements.
II Experimental
We prepared a sample with nominal composition La0.5Ca0.5Mn0.99Sn0.01O3 by thoroughly mixing high purity stoichiometric amounts of La2O3, CaCO3, MnO2 and SnO2 ( enriched in 119Sn). The mixed powders were pelletized and annealed in air at C and C for approximately h with intermediate grindings and reformation into pellets each time. Finally, the sample was slowly cooled in the furnace.
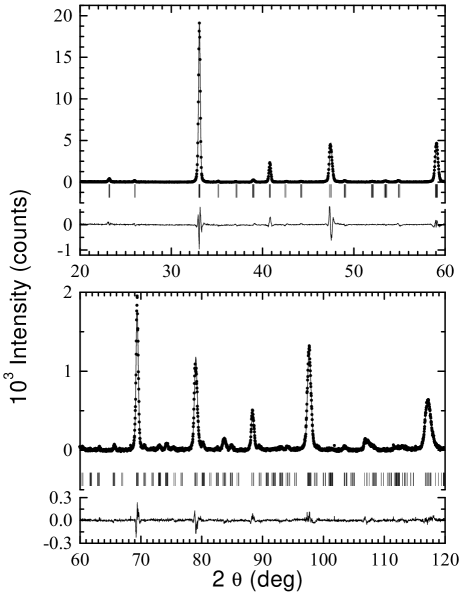
X-ray powder diffraction (XRD) data were collected with a D500 SIEMENS diffractometer, using CuK radiation and a graphite crystal monochromator, from 4 to 120 in steps of 0.03 in . The power conditions were set at 40KV/35mA. The aperture slit as well as the soller slit were set at . The refinement of the x-ray diffraction patterns was carried out by the BBWS-9006 Rietveld program [19] using the space group Pnma. The shape of the peaks was assumed to be Pearson VII and the background was refined together with the structure.
| Atom | Wyckoff | |||||
|---|---|---|---|---|---|---|
| notation | ||||||
| La | 4a | 0.02(1) | 1/4 | 0.0031(1) | .22(3) | 0.5 |
| Ca | 4a | 0.02(1) | 1/4 | 0.0031(1) | .22(3) | 0.5 |
| Mn | 4b | 0 | 0 | 1/2 | .22(3) | .495 |
| Sn | 4b | 0 | 0 | 1/2 | .22(3) | .005 |
| O1 | 4a | .496(1) | 1/4 | .0450(1) | .5 | 1.0 |
| O2 | -.2752(1) | -.0375(1) | 0.275(2) | .5 | 1.0 |
The isotropic temperature factors for the oxygen atoms were kept constant at the same value. The refined pattern shown in Fig. 1 and the results of the refinement given in Table I show the high crystalline quality of our sample. The lattice parameters obtained Å, Å and Å are very close to those of the undoped compound.
DC magnetization measurements were performed in a SQUID magnetometer (Quantum Design) for fields up to kOe. ac susceptibility measurements were performed at zero dc field by means of a laboratory-constructed probe at a frequency of Hz and with an ac external field of amplitude Oe. Four-probe resistivity measurements with and without a magnetic field were performed on a sintered bar in the temperature range - K. Mössbauer spectra were recorded with a conventional constant acceleration spectrometer with a mCi CaSnO3 (119Sn) source moving at room temperature (RT), while the absorber was kept fixed in a variable temperature cryostat equipped with a superconducting magnet ( kOe) in a geometry perpendicular to the -ray beam. The calibration of the spectrometer was made with -Fe and -Fe2O3 absorbers and isomer shifts are quoted relative to -Fe at room temperature.
III Results and Discussion
A Magnetic moment and resistivity measurements
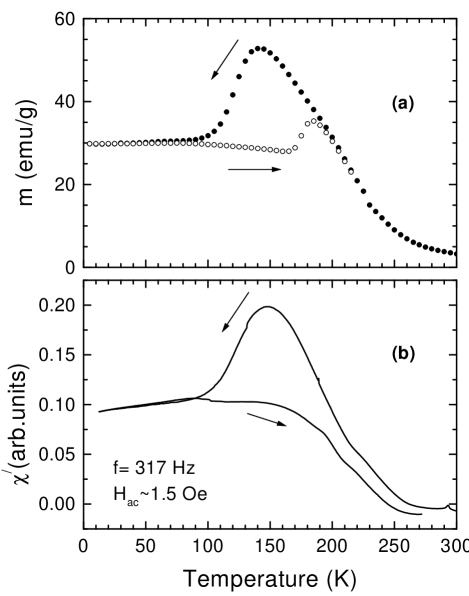
Figure 2a shows bulk magnetic moment vs measurements in field-cooling (FC) and field-cooling warming (FCW) modes in an external magnetic field of kOe. The sample undergoes a rather broad paramagnet-to-ferromagnet transition at K (defined in a measurement at Oe).
On cooling, increases smoothly with a maximum magnetic moment around K. Below this temperature the bulk magnetic moment drops to a value that is approximately % of the maximum value and then remains constant down to K. The value of at K is rather large and certainly cannot be explained by an antiferromagnetic or canted antiferromagnetic phase. The presence of a ferromagnetic phase is needed. Warming from K shows a strong hysteresis in the region - K, indicating the first-order nature of this transition. Under an applied field of T the transition is smeared out and the bulk magnetic moment reaches % of its full FM saturation value at low temperatures (for an ideal ferromagnetic state in the sample it is emu/g or ). The ac susceptibility measurement shown in fig. 2b is in agreement with the dc data.
Resistivity measurements in zero and T fields performed following the same sequence as the magnetic measurements are shown in fig. 3. At zero field, on cooling, the resistivity increases below K and shows two small maxima at and K, whereas on warming a broad peak appears at K, showing in strong hysteresis. In a T measurement the hysteresis disappears and only a broad maximum centered around K is observed. The magnetoresistance effect is at the maximum of the resistivity curve (around 140 K).
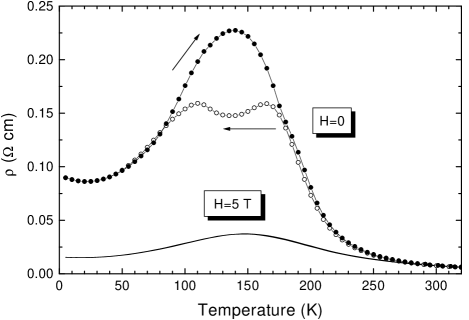
The maximum value of the resistivity observed at K indicates that above this temperature ”activated” conduction occurs and below this temperature conduction takes place probably through a percolation path created by FM regions in the sample, in agreement with the magnetization data
In a recent study Roy et al. [6] have investigated the region around and found differences between the value and the Mn4+ fraction which reflect on the magnetization and resistivity behavior of the corresponding samples. Comparing our bulk measurements with their detailed data we can conclude that the Sn-doped sample is slightly below (e.g. ) in the magnetic ( vs ) phase diagram of the La1-xCaxMnO3 manganites.
B Mössbauer measurements
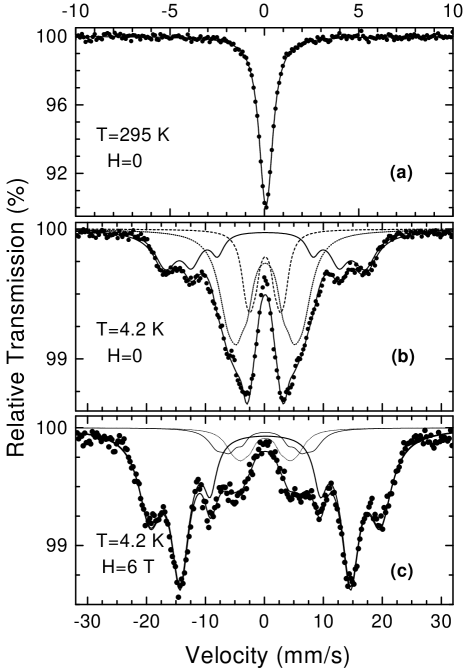
Figure 4 shows Mössbauer spectra at 300 K, K and K after field-cooling in the presence of an external field of kOe. The results of the fitting at 4.2 K are presented in Table II. The RT spectrum consists of a single absorption line with linewidth mm/s and isomer shift mm/s. This latter value corresponds to a valence state of Sn, indicating that Sn ions substitute for Mn4+. The K spectrum is fitted with three magnetic components, one with a large hyperfine field ( kOe) and the other two with smaller hyperfine fields ( and kOe). The FC spectrum shows a dramatic increase of the high field component at the expense of the low field components. An analogous increase (actually a reversal of the FM and AF fractions) was observed in Fe-doped La0.5Ca0.5MnO3, [10] and was attributed to the ”melting” of the CO-AF state to a FM state.
The fact that Sn nucleus senses transferred hyperfine field from the overlapping of the d orbitals of the Mn neighbors in the surrounding Mn octahedron with its s orbitals, leads us to the following assignment of the three components in the K Sn spectrum. The large field component ( kOe) arises from a ferromagnetic environment where all the Mn moments are parallel and add up to a large transferred hyperfine field at the Sn nucleus (FM component). The kOe component arises from an antiferromagnetic environment where the antiparallel moments contribute transferred hyperfine fields with opposite sign and which tend to cancel. (AF component). Since in the CE structure [1, 4] there are four Mn3+ ions with antiparallel moments and two Mn4+ ions with parallel moments in the Mn octahedron surrounding the Sn4+ probe, the cancellation is not total and a hyperfine field value of of the field of the FM component would be expected for the AF component. As mentioned above, this component transforms to the FM component under the influence of cooling in a T field. We will discuss the nature of the third component (CL) with a hyperfine field of kOe at a later stage.
The FC spectrum at K (Fig. 4c) was modelled with one component ( kOe) with line intensity ratio and two components ( and kOe) modulated by a distribution of hyperfine fields ( kOe) with line intensity ratio (see Table I).
| FM | AF | CL | ||||||||||
|---|---|---|---|---|---|---|---|---|---|---|---|---|
| A(%) | A(%) | A(%) | ||||||||||
| ZFC | 0.15 | 249 | 28 | 30(1) | 0.15 | 93 | 24 | 50(1) | 0.15 | 47 | 10 | 20(1) |
| FC | 0.15 | 288 | 28 | 80(3) | 0.15 | 120(5) | 21 | 10(4) | ||||
| 0.15 | 80(3) | 21 | 10(4) | |||||||||
The relative intensity of the high field component (FM phase) increases considerably (80%) at the expense of the low-field components. The AF component present in the zero field spectrum has a reduced intensity of 20%, and the CL component is absorbed in the FM component due to the applied field. The two AF components describe the modulation of the net hyperfine field seen by the nucleus in the case of a polycrystalline antiferromagnet with large magnetic anisotropy in an external field. The net field at the nucleus varies from to ( is the internal and is the external field), causing the Mössbauer spectra to be broadened. [17] The overall effect of the applied field to the system (and thus to the spectrum) is the same as that observed in Fe-doped La0.5Ca0.5MnO3. [10]
An important difference should be noted here for the hyperfine fields probed by the 119Sn and 57Fe nuclei. The 119Sn ion is diamagnetic and detects the vector sum of the hyperfine fields transferred from neighboring moments. Thus opposite moments have a cancelling effect. However, for 57Fe the hyperfine field arises from the iron ion’s own moment. The polarisation of the iron moment arises from the (super)exchange interactions of the Mn and Fe spins. The superexchange interaction may result in ferromagnetic or antiferromagnetic alignment, but the iron moment remains the same. Thus, parallel neigbouring spins are equivalent to antiparallel spins, i.e. FM and AF environments result in the same hyperfine field.
We turn now to the temperature dependence of these three components. Figure 5 (upper panel) shows some characteristic spectra upon warming (fig. 5a) and cooling (fig. 5b) in zero field. The general features of the spectra do not change up to K. Above this temperature a single peak emerges from the central region of the spectra whose intensity increases quickly as the temperature is raised. The FM component persists up to K and above this temperature the spectra consist of a single line only. Hysteresis is clearly evident in the central part of these spectra. The wings which are present in the warming mode in the temperature range to K are reduced considerably at the corresponding temperature in the cooling mode (compare the spectra at K in the two modes in the lower panel of fig. 5).
We have fitted the spectra throughout the whole temperature range with the three components of the K spectrum. In our fitting procedure the linewidths of the three components were kept constant to the RT value, the isomer shift values were the same for the three components allowing a small temperature variation due to the second order Doppler shift, and the quadrupole interaction was kept equal to zero due to the cubic symmetry of the Sn site. The free parameters were the hyperfine field, the intensity of each spectral component, and a distribution of the hyperfine fields . The latter arises from small deviations of the Sn positions to which the transferred hyperfine field at the Sn nuclei is very sensitive.
![[Uncaptioned image]](/html/cond-mat/0010391/assets/x5.png)
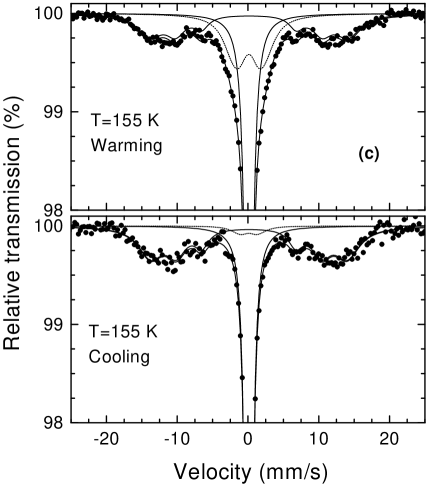
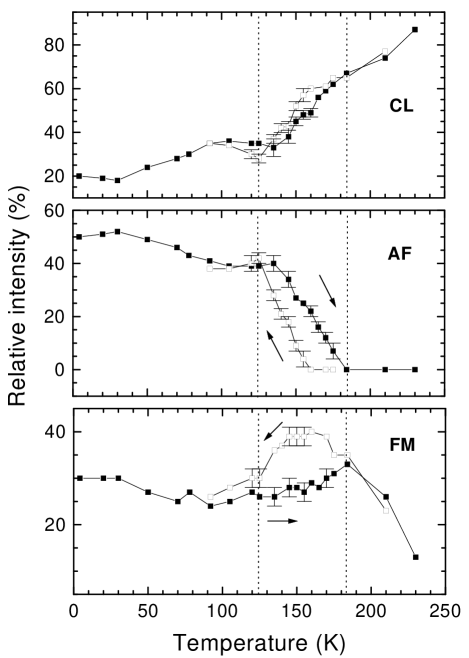
Figure 6 shows the main result of the paper: the temperature variation of the relative intensity of each component. The intensities of the FM and AF phases show hysteresis in the temperature range K, as observed in the magnetic moment and resistivity measurements described in the previous section. In particular, on warming, the FM spectral area remains constant up to K and then drops, while on cooling it increases to at K, then drops to at K, and remains constant down to K, in agreement with the magnetization data (Fig 2a), and with the La NMR results of Allodi et al. [13] obtained in the cooling mode. The opposite behaviour is observed for the AF spectral area, which disappears at K on warming and reappears at K on cooling, thereby marking the charge-ordering temperature. It should be noted that this phase is absent in the zero field La NMR data due to the complete cancellation of the transferred hyperfine interactions from the neighbor Mn ions. [13] Also, it cannot be discerned in the 57Fe Mössbauer spectra [10] since, as mentioned above, it coincides with the FM component. Thus the 119Sn probe is ideal to detect the AF phase.
Hysteresis is also observed in the temperature variation of the hyperfine field of the AF phase (fig. 7). The temperature variation of Hhf for the FM phase follows a typical meanfield-like curve, as for the case of a ferromagnet, up to K, above which this component disappears. It is interesting to note that at this temperature the value is still considerable ( kOe). This discontinuity has also been observed in La NMR experiments and it has been attributed to a first-order transition. [13, 18] This zeroing of the volume of the FM phase and not of the hyperfine field (which is contrary to ordinary ferromagnets) implies the existence of a mixed state of FM and paramagnetic phases near , thus leading to the possibility of ferromagnetic clusters. [14]
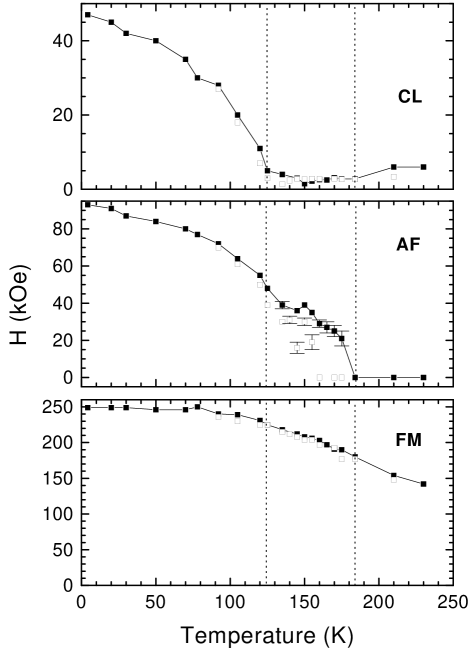
Examining the temperature behavior of the third component (CL component) we notice that its hyperfine field decreases smoothly with temperature and drops to zero at K (fig. 7). Above this temperature this component appears as a single paramagnetic peak with some broadening, with its intensity increasing with temperature (see fig. 5 and the Mössbauer spectra in fig. 4). The zeroing of the hyperfine field of the CL component coincides with the temperature at which the charge-ordering is completed on cooling and is beggining to breakdown on warming. The small saturation field ( kOe) of the component does not allow its assignment to any AF spin configuration of the Mn nearest neighbors. Thus, we ascribe this component to ferromagnetic clusters which exhibit a reduced hyperfine field either due to relaxation phenomena or to a reduced moment within the clusters. These clusters are present at K and their spectral area remains practically constant up to K. Above this temperature they exhibit superparamagnetic behaviour and their intensity increases rapidly at the expense of the AF and FM phases. The existence of ferromagnetic clusters in manganites has been used by Moreo et al.[20] to account for the density of states in the framework of one- and two-orbital models. Recently, Allodi et al. [21] have shown by 55Mn NMR that the field-induced FM phase in Pr0.5Sr0.5MnO3 develops by the nucleation of microscopic ferromagnetic domains, which may be similar in nature to the ferromagnetic clusters proposed here.
It should be noted that a paramagnetic-like component appears for in all the reported Mössbauer experiments of La manganites doped with Fe [10, 22, 23, 24, 25, 26], Co [27, 28] or Sn, [29] for values of Ca(Sr) doping between and , which covers the phase diagram range where the ground state is FM () and AF (). In addition, neutron scattering experiments for , [30] and , [31] have detected a quasielastic component for which becomes dominant as the temperature approaches . We speculate that this component is associated with ferromagnetic clusters in all these cases. It appears that both Mössbauer and neutron scattering techniques have the sensitivity to directly detect the formation of ferromagnetic clusters. The coincidence of the zeroing of the hyperfine field of the CL component with the completion and breakdown (on cooling and warming respectively) of the charge ordering indicates that the cluster development and growth is directly associated with charge ordering or charge localization.
In summarizing the Mössbauer data, we notice that the hysteretic range of the system is characterized by two temperatures, K and K, in agreement with the bulk measurements. In the temperature interval K the system comprises a FM phase (%), an AF phase (%) and FM clusters (%). The FM and AF phases display hysteresis in the range K. The disintegration (formation) of the AF phase on warming (cooling) is clearly manifested through Mössbauer spectroscopy in this temperature interval. For K, ferromagnetic clusters with superparamagnetic behavior grow rapidly in number and dominate up to the ferromagnetic to paramagnetic transition at K. This picture for the La0.5Ca0.5MnO3 system is in agreement with the phase separation models [7, 8] and supplements the electron diffraction investigations [11, 12] and the La NMR data. [13, 14]
IV Conclusions
119Sn Mössbauer spectroscopy reveals that the Sn probe monitors the phase evolution during the charge-ordering transition in La0.5Ca0.5MnO3. Complementary bulk magnetic moment and resistivity measurements are in agreement with the Mössbauer findings. Below the charge-ordering transition, phase separation occurs into FM and AF phases down to K. The hysteresis observed shows that the FM-AF transition is of first order. The phase separation is associated with the existence of FM clusters which dominate in the system above the CO transition.
V Acknowledgements
We would like to thank the Mössbauer group of the University of Ioannina, Greece (Drs. A. Moukarika, Th. Bakas and V. Papaefthymiou) for lending us their new Sn source and for preliminary meaurements, Dr. Elias Moraitakis for the ac susceptibility measurements and Dr. G. Papavassiliou for very stimulating discussions. Partial support by the European INTAS (Grant No. 30253/97) is also acknowledged.
REFERENCES
- [1] E. O. Wollan and W. C. Koehler, Phys. Rev. 100, 545 (1955).
- [2] P. Schiffer, A. P. Ramirez, W. Bao, and S. -W. Cheong, Phys. Rev. Lett. 75, 3336 (1995).
- [3] A. P. Ramirez, P. Schiffer, S.-W. Cheong, C. H. Chen, W. Bao, T. T. M. Palstra, P. L. Gammel, D. J. Bishop, and B. Zegarski, Phys. Rev. Lett. 76, 3188 (1996).
- [4] P. G. Radaelli, D. E. Cox, M. Marezio, and S.-W. Cheong, Phys. Rev. B 55, 3015 (1997).
- [5] P. G. Radaelli, D. E. Cox, L. Capogna, S.-W. Cheong, and M. Marezio, Phys. Rev. B 59, 14440 (1999).
- [6] M. Roy, J. F. Mitchell, A. P. Ramirez, and P. Schiffer, Phys. Rev. B 58, 5185 (1998); M. Roy, J. F. Mitchell, A. P. Ramirez, and P. Schiffer, J. Phys.: Condens. Matter 11, 4843 (1999)
- [7] E. L. Nagaev, J. Exper. Theor. Phys. 87, 1214 (1998).
- [8] A. Moreo, S. Yunoki, and E. Dagotto, Science 283, 2034 (1999).
- [9] G. Xiao, E. J. McNiff Jr, G. Q. Gong, A. Gupta, C. L. Canedy, J. Z. Sun, Phys. Rev. B bf 54, 6073 (1996); G. Xiao, G. Q. Gong, C. L. Canedy, E. J. McNiff Jr, and A. Gupta, J. Appl. Phys. bf 81, 5324 (1996);
- [10] G. Kallias, M. Pissas, E. Devlin, A. Simopoulos, and D. Niarchos, Phys. Rev. B 59, 1272 (1999).
- [11] S. Mori, C. H. Chen, and S-W. Cheong, Phys. Rev. Lett. 81, 3972 (1999).
- [12] C. H. Chen and S-W. Cheong, Phys. Rev. Lett. 76, 4042 (1996).
- [13] G. Allodi, R. De Renzi, F. Licci, and M. Pieper, Phys. Rev. Lett. 81, 4736 (1998).
- [14] J. Dho, I. Kim, and S. Lee, Phys. Rev. B 60, 14545 (1999).
- [15] G. Kallias, M. Pissas, A. Hoser, Physica B 276-278, 778 (2000).
- [16] J. J. Rhyne, H. Kaiser, and H. Luo, J. Appl. Phys.83, 7339 (1998).
- [17] G. K. Wertheim, D. N. E. Buchanan, and J. H. Wernick, Solid State Commun. bf 8, 2173 (1970).
- [18] G. Papavassiliou, M. Fardis, F. Milia, M. Pissas, G. Kallias, D. Niarchos, C. Dimitropoulos, and P. Scherrer, Phys. Rev. B 58, 15000 (1998).
- [19] D. B. Wiles and R. A. Young, J. Appl, Crystallogr. 14, 149 (1981).
- [20] A. Moreo, S. Yunoki, and E. Dagotto, Phys. Rev. Lett. 83, 2773 (1999).
- [21] G. Allodi, R. De Renzi, M. Solzi, K. Kamenev, G. Balakrishnan, and M. W. Pieper, Phys. Rev. B 61, 5924 (2000).
- [22] M. Pissas, G. Kallias, E. Devlin, A. Simopoulos, and D. Niarchos, J. Appl. Phys. 81, 8 (1997).
- [23] A. Simopoulos, M. Pissas, G. Kallias, E. Devlin, N.Moutis, I. Panagiotopoulos, D. Niarchos, C. Christides, and R. Sonntag, Phys. Rev. B 59, 1263 (1999).
- [24] A. Tkachuk, K. Rogacki, D. E. Brown, B. Dabrowski, A. J. Fedro, C. W. Kimball, B. Pyles, X. Xiong, Daniel Rosenmann, and B. D. Dunlap, Phys. Rev. B 57, 8509 (1998).
- [25] S. B. Ogale, R. Shreekala, Ravi Bathe, S. K. Date, S. I. Patil, B. Hannoyer, F. Petit, and G. Marest, Phys. Rev. B, 57, 7841 (1998).
- [26] A. Simopoulos et al. (unpublished).
- [27] V. Chechersky, A. Nath, I. Isaac, J. P. Franck, K. Ghosh, H. Ju, and R. L. Greene, Phys. Rev. B 59, 497 (1999).
- [28] V. Chechersky, A. Nath, I. Isaac, J. P. Franck, K. Ghosh, and R. L. Greene, J. Phys.: Condens. Matter 11, 8921 (1999).
- [29] A. Simopoulos, G. Kallias, E. Devlin, I. Panagiotopoulos, and M. Pissas, J. Magn. Magn. Mat. 177-181, 860 (1998).
- [30] J. W. Lynn, R. W. Erwin, J. A. Borchers, Q. Huang, A. Santoro, J. L. Peng, and Z. Y. Li, Phys. Rev. Lett. 76, 4046 (1996).
- [31] L. Vasiliu-Doloc, J. W. Lynn, A. H. Moudden, A. M. de Leon-Guevara, and A. Revcolevschi, J. Appl. Phys. 81, 5491 (1997).