Glassy Spin Freezing and NMR Wipeout Effect in the High- Superconductor La1.90Sr0.10CuO4: What is the Relationship With Stripes ?
Abstract
We report on 139La and 63Cu NMR/NQR measurements in the high- superconductor La1.90Sr0.10CuO4 with K. Spin fluctuations probed by 139La spin-lattice relaxation (), continuously slow down on cooling through . We argue that spin-freezing and superconductivity are bulk effects in this sample. Thus, both phenomena have to coexist microscopically. The distribution of 139La values at low temperature reveals a wide spread of spin fluctuation frequencies in CuO2 planes. A simple estimate shows that 63Cu nuclei at sites where electronic fluctuations are the slowest are not observable because of too short relaxation times (wipeout effect). This means that the 63Cu NQR wipeout, observed in this sample, can be explained primarily by slow magnetic, rather than charge, fluctuations. This result does not rule out the connection between wipeout effect and charge stripe order (Hunt et al., (Phys. Rev. Lett. 82, 4300 (1999)), but it indicates that the relationship between both phenomena is not straightforward. We argue that the wipeout fraction cannot define a proper order parameter for a stripe phase, and cannot be used alone as a criterion for its existence.
pacs:
PACS numbers: 76.60.-k, 74.72.Dn, 74.25.HaI Introduction
Although La2-xSrxCuO4 is probably the best studied high- superconductor (HTSC) [2, 3] it still continues to reveal new phenomena that were not observed or were overlooked in the past. This is even true for microscopic and powerful probes such as nuclear magnetic resonance (NMR), nuclear quadrupole resonance (NQR) or muon spin rotation (SR), which have already made major contributions to our understanding of these compounds (for reviews, see [4, 5, 6]). Two important features have been highlighted recently:
(i) The coexistence of superconductivity with a frozen magnetic state called a ”cluster spin-glass” at concentrations , an early result which was confirmed by recent studies (Refs. [7, 8, 9] and [10] for a concise review). In principle, the coexistence of superconductivity with frozen spins or localized charges, is rather hard to conceive. Indeed, in the cuprates, a link between superconductivity and the characteristic frequency of spin fluctuations [4, 6, 19] was inferred from NMR data at relatively high temperature, . So, it appears now equally important to characterize the evolution of magnetic fluctuations close to and below , in e.g. La2-xSrxCuO4.
(ii) A strong ”wipeout effect” for the 63Cu NQR signal at concentrations : the number of 63Cu nuclei contributing to the signal decreases on cooling (even above ) and the signal completely disappears at low temperature () [11]. Interestingly, a very similar phenomenology, with spin freezing and Cu NQR/NMR wipeout, is observed [11, 12, 13, 14, 15] in cuprate materials where doped holes have been shown to order in linear single rows, known as charge stripes [16]. In fact, it was even discovered that the wipeout fraction (i.e. the fraction of unobserved Cu nuclei) has the same dependence as the ”stripe order parameter” (actually the intensity of superlattice peaks in neutron and X-ray scattering) in these materials [11, 12]. As explained by Hunt et al. the wipeout effect can be caused by very slow (in the MHz range) charge and/or spin fluctuations [11]. However, the identification of the wipeout fraction as a stripe order parameter [11] has led to the belief that the effect was predominantly caused by the charges [17] and that stripe order in La2-xSrxCuO4 was characterized by ultra slow charge motion [18]. This idea was recently challenged by Curro et al. who attribute the wipeout effect to slow spin fluctuations exclusively and refute any relationship to the stripe order parameter [14]. Since the discovery of Hunt et al. [11] has raised the hope of having a new tool to detect charge stripes (which have been so far elusive in most materials), it is clearly important to better understand the origin of the wipeout, and decide if this effect can be considered as a criterion for stripe order.
Here, we report on 139La NMR/NQR and 63Cu NQR measurements in La1.90Sr0.10CuO4. The main conclusions of this work are: (1) bulk superconductivity coexists with frozen magnetic moments throughout the sample. (2) The slow and inhomogeneous spin dynamics characterizing the freezing process provide the most likely explanation for the Cu NQR wipeout effect.
The paper is organized as follows: first, the main magnetic properties of La1.90Sr0.10CuO4 at low are recalled in Section II. Section III gives a basic NMR background, focused on spin-lattice relaxation and wipeout effects. Experimental details, including discussion of the NMR lineshape, are described in Section IV, with a brief account of magnetization measurements which indicate bulk superconductivity in the sample. Section V is devoted to the NMR/NQR results and to their analysis. The results are summarized in Section VI, together with a discussion in a more general perspective.
II Context of the work
We precise the context of the experiment by summarizing some magnetic properties of La2-xSrxCuO4 with , focusing on relatively low temperatures, K. Hunt et al. have reported a loss of Cu NQR signal, below 70 K for and below 50 K for , in ceramic samples [11]. A similar wipeout effect may thus be anticipated below 60 K for .
Incommensurate elastic peaks are found in neutron scattering below 15 K [20], i.e. in the superconducting state ( K). By analogy with the results of Tranquada and co-workers in La1.48Nd0.4Sr0.12CuO4 [21], this modulated AF order is suspected to result from the ordering of spin domains between antiphase walls formed by charge stripes. However, the corresponding charge order peaks have not been observed. On the other hand, a much lower spin-ordering temperature of 1.2 K is reported from a SR study [7]. The difference between neutron and SR results is presumably ascribed to the glassy nature of this ordering: spin fluctuations continuously slow down over a wide range, so a dynamic measurement probes a frequency-dependent ordering temperature. Actually, the existence of frozen spins at was already inferred by Ohsugi et al. from the broadening of the NQR line at 1.4 K [22]. However, it was not clear if all or part of the sample was magnetic. Slowing down of spin fluctuations is also visible in EPR measurements [23, 24].
In conclusion, La1.90Sr0.10CuO4 lies at an interesting position in the phase diagram of La2-xSrxCuO4: while being close to the composition where magnetic order is quite strong [20, 25, 26], it shows magnetic order only at quite low and has about two-thirds of the highest achievable in this system (at ambient pressure). It also shows a wide range of Cu NQR wipeout effect.
III NMR background
139La and 63Cu are complementary NMR and NQR probes. 139La nuclei are coupled to the magnetic moments of Cu2+ electrons through the hyperfine field which results from both a transferred contact interaction (via orbital overlap with the apical oxygen) and a direct dipolar interaction. The hyperfine field is estimated to be kOe/ [27]. In contrast, 63Cu and 65Cu nuclei experience a much larger coupling to both the on-site Cu2+ spin (anisotropic hyperfine field kOe/, kOe/ [28]) and to the four Cu2+ first neighbors (isotropic transferred coupling kOe/ [28]).
A Nuclear relaxation
Nuclear spin-lattice relaxation occurs through temporal fluctuations of the local magnetic field (magnetic relaxation) and/or of the electric field gradient (quadrupolar relaxation). For magnetic relaxation, the spin-lattice relaxation rate 1/ of a given nucleus is proportional to the square of its gyromagnetic ratio and to the square of the transverse components (, ) of the local field (the quantization axis is the direction of the external magnetic field ) :
| (1) |
where the horizontal bar denotes the ensemble average and is the nuclear Larmor frequency.
With for and with , one finds immediately that fluctuations of Cu2+ spins will lead to values for 63Cu which are shorter by about four orders of magnitude compared to the values for 139La (the exact number depends on the wave-vector dependence of spin fluctuations, which are ignored in the above estimate).
For fluctuations of the local field of the form , where is called the correlation time, a standard expression for can be derived [29]:
| (2) |
Slowing down of magnetic fluctuations means that increases on cooling (), and this leads to an increase of , which eventually reaches a maximum when (Eq. 2). The existence of a maximum in as a function of is a rather general feature (more general than the particular form of assumed above), which also holds when the system cannot be described by a single value of , but rather by a distribution of correlation times. The maximum of vs. becomes broader in this case. The temperature at which reaches a maximum defines the freezing temperature at the NMR time scale. When slowing down occurs over a rather wide temperature range, the value of determined by another experimental technique, with a different time scale, may differ significantly from the NMR value. With typically s, 139La NMR is a relatively slow probe, with a timescale comparable to SR.
The spin-spin relaxation time defines the characteristic time decay of the echo height in a spin-echo sequence. So, determines the time available for recording the NMR signal. In most solids, is determined by nuclear dipole-dipole interaction. In the cuprates, of 63,65Cu nuclei is dominated by two stronger processes: , which comes from indirect exchange between Cu nuclei via the non-local electronic susceptibility [30] and , the Redfield contribution, which is a function of [29, 31]. Since both processes are proportional to squares of hyperfine fields, 139La nuclei have a much longer (ms) than 63,65Cu nuclei (s).
B Wipeout effects in NMR/NQR
The NMR/NQR signal is directly proportional to the population difference between adjacent nuclear levels. As such, it is proportional to and to the number of nuclei in the sample. In practice, since the observation occurs at a finite time after a radio-frequency pulse, the measured signal is reduced from its maximum possible value because of the process. The decrease is typically of Lorentzian or Gaussian type. So, in order to check if all nuclei are observed as a function of temperature, the signal should be renormalized by a factor and then corrected for the effect by extrapolating its magnitude at time zero.
The term wipeout effect was introduced in order to describe the loss of NMR signal due to non-magnetic impurity doping in metals [32]. The decrease of the NMR signal occurred because of the large spread of resonance frequencies out of a given spectral window. Similar loss of NMR signal has been well-documented for localized magnetic moments in metals (RKKY oscillations) [33]. A transition to a magnetically ordered phase may also lead to an apparent loss of signal, because the internal field causes a shift of the resonance positions, with possibly sizeable broadening.
On the other hand, a loss of signal may be produced by a dramatic shortening of (or of , through the term). The correct signal cannot be obtained by extrapolating the measured signal at time zero, when relaxation times for part of the nuclei become shorter than the ”dead time” of the spectrometer, i.e. some nuclei have relaxed so fast that the signal coming from them cannot be digitized. If this occurs for all nuclei in the sample, the signal is completely lost. As seen above, very short relaxation times occur if the spectral density of electronic fluctuations is large at the Larmor frequency.
Finally, when the Larmor frequency is directly defined by the value of the hyperfine electric or magnetic coupling (as in NQR or zero field NMR), strong fluctuations of these couplings at the observation time scale will also cause a loss of the resonant signal. Because of the slow fluctuations involved, very short nuclear relaxation times are likely to occur in such cases. Thus, the various contributions to the wipeout effect may not be distinguishable.
In summary, a loss of NMR signal can result from static effects (modification of the lineshape), from dynamical effects or from both. These effects can occur homogeneously or inhomogeneously in the sample. Inhomogeneity frequently leads to a wipeout effect which is only partial, in which case careful measurements are required in order to realize that part of the signal has been lost. Not surprisingly, wipeout effects are observed in canonical spin-glasses close to the glass transition [34, 35, 36].
IV Experimental details
A NMR measurements
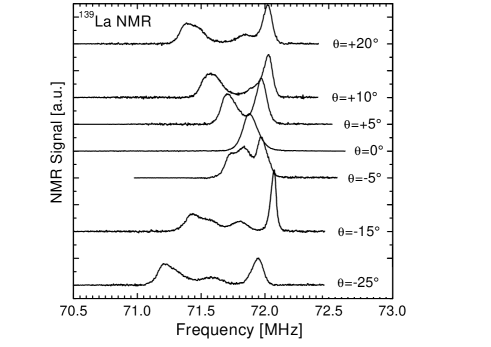
Most of the experiments were performed on a crystal ( mg) grown by the traveling solvent floating zone method [37]. It is a piece of the large crystal used by Petit et al., for neutron scattering measurements [38]. In the course of the NMR experiments, it was found that the sample was not a true single crystal, as a part of it had a different orientation from the rest. While this does not affect our analysis of the NMR/NQR signal intensity (because all frequencies were integrated), it affects the lineshapes. This sample was then cut into two equal pieces, one of which was confirmed to be a single crystal of very high quality from both neutron and X-ray diffraction. We then performed new 139La NMR lineshape measurements as well as 139La and measurements on a well-isolated line in this single crystal ( in Fig. 1). The recovery laws were strictly identical to those in the original sample. Thus, the distribution of values, which will be discussed below, is intrinsic. Within experimental accuracy, and are the same on the different lines.
 |
 |
NMR spectra were obtained from a single Fourier transform of half of the spin echo signal when the line was sufficiently narrow. For lines broader than the frequency window of the excitation, spectra were obtained by summing Fourier transforms at equally spaced frequencies or by recording the spin-echo integral/amplitude at different frequencies. 63Cu and 139La NQR spectra were recorded with the latter method.
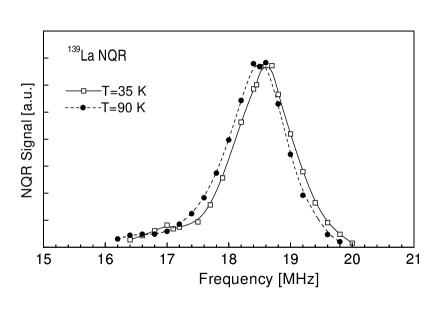
The 139La NMR spectrum with in the single crystal shows a single peak which splits into four peaks as the magnetic field is tilted away from the -axis (one of the lines is not well-defined, but only appears as a shoulder; see Fig. 1). The angular dependence of this spectrum (Fig. 1) and the fact that the 139La NQR spectrum does not show well separated lines but a single peak (Fig. 2) indicate that the splitting is due to different values of the angle between and the direction of the principal axis of the electric field gradient tensor . Since these four angles are roughly equal when (Fig. 1), the effect originates from different directions of in the crystal, with equal tilts from the -axis. Unambiguous identification of the different directions would require a full angle-dependence study within two perpendicular rotation planes. Because of sample geometry, this could not be performed here. The various directions of may correspond to different tilt directions of CuO6 octahedra. The -dependence of the shifts and linewidth show that the tilt angles increase smoothly on cooling from K down to 100 K, with a saturation at lower .
These results motivated us to reexamine 139La NMR spectra in the single crystal of La1.94Sr0.06CuO4 that we used for a previous study [8]. The new measurements, at higher magnetic fields and with improved experimental conditions, revealed that the spectrum is composed of at least three lines, whose separation is predominantly of quadrupolar origin, as in La1.90Sr0.10CuO4. Thus, this finding invalidates the hypothesis in Ref. [8] of only two lines split by a purely magnetic effect.
Measuring the magnitude of the signal intensity requires care. In order to ensure that both the radio-frequency excitation and the detection of the signal remain identical at all temperatures, experimental conditions such as the 50 matching and the factor of the resonant circuit should be carefully controlled. Here, this was made easier by the fact that the capacitors for impedance matching and frequency tuning were outside the probe, at the constant room temperature.
Because of flux expulsion in the superconducting state, the NMR signal in a single crystal is reduced drastically below . In order to study the spin dynamics down to low temperature, we have applied high magnetic fields up to T. Such a field is expected to reduce down to a few Kelvin, although the exact is not known here, and in any case hard to define given the broadening of the transition under field. The experiments at 23.2 T were carried out in a high homogeneity resistive magnet of the National High Magnetic Field Laboratory in Tallahassee, FL. Other measurements up to 15 T were carried out in superconducting coils.
 |
B Superconducting properties
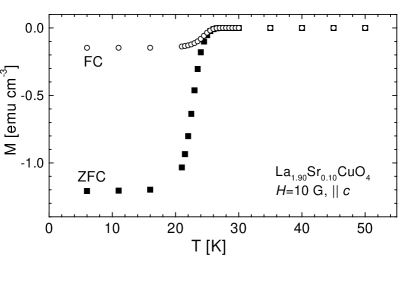
Magnetization measurements were performed on the polycrystalline sample and on the single crystal, with almost identical results. In Fig. 3 results for the single crystal are reported [42]. The sample quality can be checked from the narrow width ( K) of the superconducting transition, which has an onset at K. It is particularly difficult to establish bulk superconductivity from single crystal measurements in fields much higher than a few G [39, 40]. Nevertheless, a study of the high field reversible magnetization, similar to that in Ref. [41], concludes that our sample is a bulk superconductor [42].
 |
V NQR and NMR results
A 63Cu NQR spectra: wipeout effect
As a preliminary step of this study, we intended to check the presence of a wipeout effect, as previously reported by Hunt et al. [11]. The 63Cu signal was recorded in an NQR experiment, i.e. in zero external magnetic field. Because of the excessive loss of signal in the superconducting state, our data are limited to a narrow range above K. was measured at different frequencies on the NQR spectrum, and was found to shorten on decreasing frequency, in agreement with Ref. [11]. The frequency dependence is however relatively weak so that it is sufficient to correct the frequency-integrated signal from the value of at the center of the line only [12]. was estimated from a single exponential fit [)] of the echo decay (the accuracy of the data did not allow to distinguish between Lorentzian and Gaussian forms of the echo decay).
Fig. 4 shows the results for the signal intensity, and the wipeout fraction ( is the signal corrected for and temperature, and integrated over frequencies). There is clearly a wipeout effect, which basically agrees with the results of Hunt et al. [11] (our values appear somewhat lower, presumably because of the normalization to the intensity at 60 K, our highest temperature data point; Hunt et al. find 20% of wipeout for , at this temperature).
 |
B 139La NMR spectra: low magnetic broadening
As shown in Fig. 5, the 139La central line in a field of 23.2 T broadens on cooling below about 50 K, with a saturation of the width below 10 K. The same broadening is seen at 15 T [43] (not shown), but not at 9.4 T above 15 K (Fig. 6). This strongly suggests that the broadening is of magnetic origin, as previously observed in La1.94Sr0.06CuO4 [8]. The broadening is not seen at 9.4 T, because the linewidth is dominated by the large quadrupolar broadening (which varies as 1/). The 139La NMR broadening is not an artifact related to signal loss at the center of the spectrum (see next subsection), and is not of dynamic origin ( is much longer than the inverse linewidth in the single crystal), at least above 10 K. So, the broadening indicates a spread of local fields along the direction. This is a purely paramagnetic effect since data show no sign for frozen moments in the range 10-60 K, but a smooth evolution toward freezing at lower (see Fig. 9 and discussion below). Clearly, the broadening cannot be caused by frozen magnetic regions at so high temperatures. This effect is somehow similar to the one observed in Zn-doped materials [44] and is not necessarily seen in bulk magnetization measurements, which sums the contributions from all staggered moments.
C 139La NMR spectra : absence of wipeout effect
 |
The dependence of the 139La intensity was measured for the NMR central line ( -1/2 transition) in a field of 9.4 T. was observed to shorten on cooling. However, in the range 100-15 K, of the order of ms remains much longer than the delay between and NMR pulses (s), so the correction is essentially negligible for 139La.
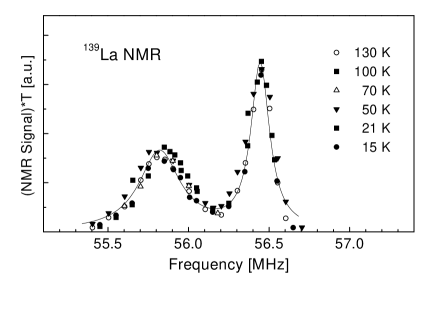
As shown in Fig. 6, the NMR signal (multiplied by a factor ) is independent of from 130 K down to 15 K. There is no loss of 139La NMR signal on cooling in the range 70 K-15 K, where the Cu NQR spectrum is wiped out. This contrasting behavior is not a priori unexpected since 139La lies out of the CuO2 planes. Hence, spin and charge fluctuations in these planes produce hyperfine field and electric field gradient fluctuations which are considerably reduced at the La site. Still, the absence of 139La NMR wipeout down to 15 K makes measurements particularly interesting, since the whole sample is probed, including those parts where the Cu NQR signal has disappeared.
 |
D 139La NMR relaxation evidence for a distribution of spin fluctuation frequencies
A typical plot of the time dependence of the 139La longitudinal magnetization after a comb of saturation pulses at K is shown in Fig. 7. For a purely magnetic relaxation mechanism, the theoretical expression for the recovery of the magnetization, after fast irradiation of the central NMR transition of nuclear spins , is [48] : . However, the data points cannot be fitted to this expression (Fig. 7). This means that the recovery is modified by a distribution of values or by nuclear transitions produced by electric field gradient fluctuations. At low temperatures, is entirely magnetic (see below the large enhancement of due to the spin-freezing). So, the deviation of the recovery from the ideal behavior is due to a distribution of values in that case. Such a distribution was previously found to characterize the magnetic freezing in La2-xSrxCuO4 () [8, 49] and in La1.65Eu0.2Sr0.15CuO4 [14]. Since the shape of the 139La recovery smoothly depends on in the range 5 K-40 K, it is very reasonable to assume that there is a distribution of values in all this range [50].
 |
E Implications of 139La results for the 63Cu NQR/NMR wipeout effect
Given the distribution of values, the data should be characterized by the width and the central value of this distribution. However, as it is usually observed in such cases, the data may be reasonably well-fitted with only two contributions (here of roughly equal weight), each of them following the theoretical expression for (given above). We adopt here this procedure for simplicity. From the data at 15 K, we extract two characteristic relaxation times for 139La nuclei, which have quite different values: ms and ms. With the help of Eq. 2, one readily finds that magnetic fluctuations responsible for a of 265 ms at La sites would produce a s at 63Cu sites and thus a s [31]. The spin-echo signal from nuclei with so short relaxation times can certainly not be observed, while nuclei with relaxation times greater by an order of magnitude should be observable. This implies that the 63Cu NQR spectrum will be partially wiped out because some nuclei have too fast relaxation times to be observed, while the remaining nuclei are still detected. It could be remarked that is weakly dependent down to 30-40 K, while Cu NQR wipeout starts at least below 60 K. There is however no contradiction between these two observations. Indeed, of 139La contains a background of quadrupolar relaxation which likely masks the onset for the enhancement of magnetic relaxation. Moreover, the quadrupolar relaxation channel which is active for 139La nuclei is not necessarily present at Cu sites. 139La and 63Cu nuclei certainly have a different ratio of magnetic to quadrupolar relaxation, and this ratio is extremely difficult to determine experimentally [52]. Actually, shortens by a factor of 1.3 between 60 K and 30 K.
Thus, we conclude that the slow and spatially distributed magnetic fluctuations are sufficient to explain the strong Cu wipeout effect at low temperatures in La1.90Sr0.10CuO4. One cannot exclude that slow charge fluctuations are present, but there is no evidence for this.
F 139La evidence for spin-freezing
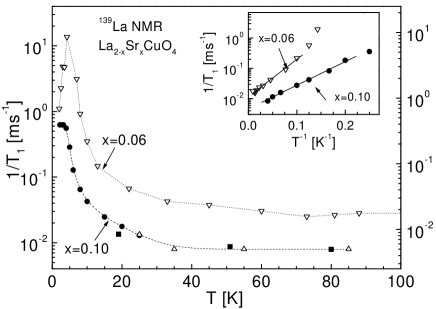 |
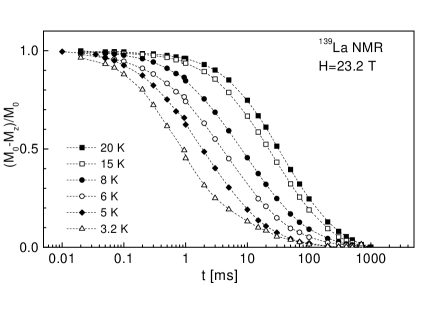
Fig. 8 shows the recovery plots of the nuclear magnetization after a sequence of saturation pulses, at selected temperatures, in a field of 23.2 T. The overall trend clearly shows that the recovery becomes faster on cooling, i.e. shortens. This behaviour holds down to about 4 K. Below 4 K, a tail appears at long times, becoming as important as the fast component at K, our lowest data point (not shown). This long component in the relaxation does not seem to be linked to superconductivity since it is also observed at 15 T in the same range, and is higher at this field (at 15 T, a clear change in the frequency tuning of the NMR probe at 6.5 K signals the irreversibility line). More data are necessary in order to understand if this feature, which might be caused by a distribution of freezing temperatures, is intrinsic or related to the sample purity. Because of this uncertainty and of the limited experimental range, it is not possible to determine a precise freezing temperature in this sample. Nevertheless, it is clear that a slowing down phenomenon starts below K, as is shown in Fig. 9 by the -dependence of [51]. An important feature of the freezing process is that it involves the vast majority of sites, if not all, in the sample: there is no long tail in the recoveries (excepted the one very close to ) which could be attributed to non-freezing areas. In contrast, the recovery curves in Fig. 8 shift continuously toward short times on cooling, without strong modification of their shape. Note that this conclusion is not affected by a possible loss of 139La nuclei below 15 K, since this would precisely originate from freezing zones, while non-freezing ones have longer .
G Remark on high magnetic fields
It is important to realize that the spin freezing is not induced by the magnetic field. In fact, (i) a similar enhancement of was found in fields of 23.2, 15 and 9 T (not shown). (ii) SR measurements (in zero field) have already reported a bulk spin-freezing at K for =0.10 [7] (see also [22]). Thus, magnetic fields as high as 23 Tesla do not seem to modify spin dynamics in La1.90Sr0.10CuO4 for temperatures in the range 5-40 K (an influence of the field on the freezing temperature cannot be excluded).
It is interesting to consider these findings in comparison with the insulating behavior of the -plane resistivity under strong magnetic fields. Boebinger et al. [53] find , which they consider as an indication of non-metallic ground state in zero field when superconductivity is destroyed, while Malinowski et al. [54] suggest that it is the field itself which induces localization of the charges. Since spin dynamics are likely to be affected by charge localization, our result that spin dynamics in the freezing regime do not change appreciably with the field would rather tend to support the former view.
H Comparison to other works
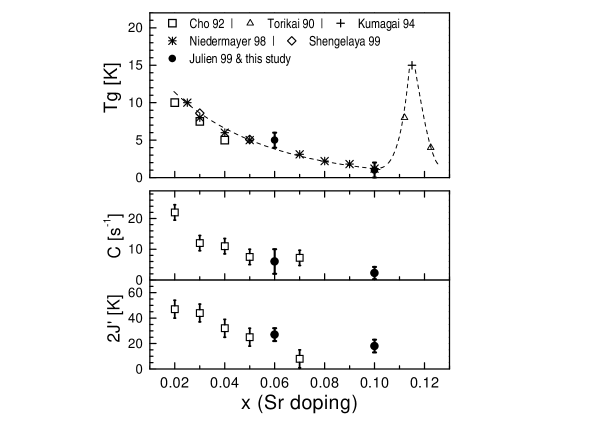 |
The top panel of Fig. 10 shows a selection of spin-freezing temperatures () determined from Sr and NMR/NQR experiments in La2-xSrxCuO4 ([7, 25, 26, 56]; data from magnetization measurements can also be found in [57, 58, 59]). Given the uncertainties discussed above, we plotted K for our experiment in La1.90Sr0.10CuO4, which is consistent with previous works, in particular K from Niedermayer et al. [7].
Cho et al. remarked that data for can be fitted to the following expression [49]:
| (3) |
where can be considered as a coupling constant. The values of the parameters and , obtained by fitting our data for and (inset to Fig. 9) to Eq. 3 are in good agreement with those obtained by Cho et al. (Fig. 10) [55]. It is remarkable that is reduced by less than a factor 2.5 between , the border of the long range AF phase, and , while is reduced by about a factor 10. Inspired by the cluster spin-glass idea, Cho et al. related the behavior of to the size of AF clusters that shrink with doping, and to the energy barrier for the re-orientation of the staggered moments [49]. In order to gain more physical insight into the parameters and , and into the details of spin-freezing, it would be interesting to have theoretical predictions from different models (various forms of cluster spin-glass, stripes, impurities, etc.).
VI Summary of main results and discussion
A Coexistence of magnetic order with superconductivity
Although we could study only the freezing process and not the frozen state (), our 139La measurements confirm previous microscopic evidence for frozen magnetic moments below 1 K in La1.90Sr0.10CuO4 [7]. In our sample, which is a bulk superconductor according to Huh et al. [42], we observe that the magnetic freezing is visible at all 139La sites in the sample. This is again in agreement with Niedermayer et al. finding all muons probing an internal field at low [7]. Thus, one must conclude that superconductivity coexists with frozen magnetic moments [60] (which we know to be locally staggered [8]), and this coexistence has to occur at the microscopic scale. It is noted that the nature of the magnetic freezing found in the superconducting phase () appears to be of the same kind of the cluster spin-glass freezing reported earlier [49] in non-superconducting materials.
In La1.88Sr0.12CuO4, equal magnetic and superconducting transition temperatures were reported, based on neutron scattering and 139La NMR lineshape measurements [45, 46, 47]. However, we have shown above that the broadening of the 139La NMR line occurs well above the freezing temperature (as determined by 139La NMR or SR). We suspect that the real in La1.88Sr0.12CuO4 is much lower (see [25, 26]) and thus that the onset of NMR line broadening coincides with only by chance.
The coexistence found here resembles previous works in e.g. Nd-doped La2-xSrxCuO4 where bulk superconductivity is claimed by several groups (see Refs. [40, 41, 61] and [62] for an opposite point of view). Nevertheless, more experimental work remains do be performed in order to fully characterize the superconducting properties of these materials with spin-glass like freezing. From the theoretical viewpoint, it is clear that the cluster spin-glass freezing deserves intensive consideration: the existence of superconductivity in such a context and the relation to stripe physics need being addressed more accurately (see [64] for recent views).
Finally, it is important to note that the coexistence of frozen moments with superconductivity does not mean that both phenomena are somehow related or even cooperative. There is ample evidence that they compete (see [63] for a recent perspective and references). In fact, the internal static field, existing at , is very small in La1.90Sr0.10CuO4, certainly less than 10% of the value in La2CuO4 [7].
B What are the evidences for stripes in La2-xSrxCuO4 ?
Looking at the whole body of experimental data in La2-xSrxCuO4 with (Refs. [7, 8, 9, 10, 11, 23, 24, 53, 63] and references therein), it is now quite clear that this part of the phase diagram shows (besides superconductivity) three mutually-related phenomena at low temperature ( K, depending on doping): charge localization tendencies, glassy spin-freezing and Cu NMR/NQR wipeout. It is very tempting to attribute these three features to the presence of charge stripes. There are two principal arguments in support to this view:
(1) Magnetic order issued from glassy spin freezing and Cu NQR wipeout are observed in a very similar way in rare earth-doped La2-xSrxCuO4, where they are understood as a consequence of stripe order [11, 12, 13, 14, 15, 67, 61, 62]. Transport properties of these materials also bear strong similarities to those of La2-xSrxCuO4[65, 66, 63]. Of course, another important piece of argument is the identical wave-vector for magnetic scattering in Nd-free and Nd-doped La2-xSrxCuO4 [20, 68].
(2) It is difficult to imagine how a magnetic state with local AF order could exist without charge segregation at high hole-doping level. Charge stripes represent an ideal form of such segregation. If doped holes were randomly distributed the mean distance between them would be about three lattice spacings in La1.90Sr0.10CuO4. On the other hand, the mean distance between charge stripes is of five lattice spacings at (assuming one charge every two sites along the stripe). The charge stripe picture clearly generates much larger hole-poor regions (magnetic domains), and is naturally much more favorable to spin order : charge order eliminates spin frustration, which is otherwise large if holes are uniformly distributed. This interpretation of the data in the ”cluster spin-glass” phase of La2-xSrxCuO4 has repeatedly been put forward by Emery and Kivelson [69].
On the other hand, direct evidence for charge stripes is still lacking in superconducting La2-xSrxCuO4. This is because charged structures are evidently difficult to detect: fluctuations and disorder can readily render diffraction methods inoperative. However, the accumulation of indirect hints is rather overwhelming.
C Is the wipeout fraction a measure of stripe order ?
We have found that the Cu NQR wipeout effect could be explained by the glassy nature of the magnetic freezing in La1.90Sr0.10CuO4: slow spin dynamics shorten the nuclear relaxation times and of 63,65Cu, and these nuclei become unobservable below a threshold value of . Because the dynamics is spatially inhomogeneous and the freezing occurs on a wide interval, the NMR/NQR signal disappears only gradually on cooling. This interpretation of the wipeout effect was also proposed by Curro et al. [14]. These authors also argue that the crossover from Gaussian to Lorentzian is explained by the same arguments. The magnetic origin of the wipeout is taken by Curro et al. as a strong argument against the wipeout fraction being a measure of the ”stripe order parameter”. Our point of view is somewhat less radical, although we come to the same conclusion, as explained below.
The fact that the wipeout can be explained by glassy spin-freezing only indicates that the relationship with stripe order, if any, is not straightforward. Actually, this was not excluded by the authors of Refs. [11, 12]. Their data in La1.6-xNd0.4Sr0.09≤x≤0.15CuO4 suggest a sharp wipeout onset, coinciding with the charge order temperature detected by neutron scattering [12]. In this sense, the wipeout effect must be somehow related to stripe order. This is reasonable since charge order is always followed by magnetic order. The slowing down of spin fluctuations on approaching the magnetic transition is in turn responsible for the wipeout effect. However, the argument holds only because we know that there are stripes in these materials. One should keep in mind that any other situation with slow and inhomogeneous spin dynamics (such as impurity doping) could produce similar wipeout.
On the other hand, it is the very nature of the wipeout effect that makes the identification with a stripe order parameter questionable. The wipeout fraction measures a kind of volume fraction in which the spin dynamics is slowed down below some threshold value, that clearly depends on experimental conditions. This is typically an extensive quantity, while an order parameter is usually associated to an intensive quantity like the amplitude of a field or of a distortion. Moreover, it is even not a priori obvious to consider the amplitude of charge order peaks in neutron or X-ray scattering as an order parameter. If the order is not homogeneous, the peak intensity may also reflect the volume fraction of well-ordered stripe segments in the crystal. Finally, we note two contradictions which need to be clarified. First, the wipeout onset in La1.65Eu0.2Sr0.15CuO4 occurs at much higher temperature for Curro et al. ( K [14]) than for Singer et al. ( K [12]). Second, the onset of Cu NQR wipeout seems to occur prior to the neutron charge ordering temperature in La1.50Nd0.4Sr0.10CuO4 [12, 63].
In conclusion, while the Cu NQR wipeout effect is certainly
related to stripe order in La2-x-yNdySrxCuO4 and
in La2-xSrxCuO4, it would not be reasonable to use it as a criterion for
the presence of charge stripes in other materials and it is not
possible to identify the wipeout fraction to a stripe order
parameter.
Note added - After completion of this manuscript we became aware of a NQR work in La1.48Nd0.4Sr0.12CuO4 [G.B. Teitel’baum et al., cond-mat/0007057]. A 139La wipeout effect is found, but starting at much lower temperature than the Cu wipeout. The authors argue that 139La is entirely due to magnetic fluctuations, and they find, in agreement with Ref. [14] and our work, that slow and distributed spin fluctuations explain the Cu NQR wipeout effect.
VII Acknowledgments
Thanks are due to A.H. Moudden for cutting a piece from his
sample, to L.P. Regnault and P. Bordet for neutron and X-ray
characterization of the sample. We are particularly grateful to
Y.M. Huh, J.E. Ostenson and D.K. Finnemore for a collaboration on
superconducting properties of La2-xSrxCuO4 samples. We also thank
A. Lascialfari for some SQUID measurements. Help at various stages
of this project from S. Aldrovandi, L. Linati, F. Tedoldi, N.
Poulakis is gratefully acknowledged. The work in Pavia was
supported by the INFM-PRA SPIS funding. Ames Laboratory is
operated for U.S Department of Energy by Iowa State University
under Contract No. W-7405-Eng-82. The work at Ames Laboratory was
supported by the director for Energy Research, Office of Basic
Energy Sciences. The GHMFL is ”Laboratoire conventionné aux
universités J. Fourier et INPG Grenoble I”. Support from the
FERLIN program of the European Science Foundation is
acknowledged.
REFERENCES
- [1] Marc-Henri.Julien@ujf-grenoble.fr
- [2] D.C. Johnston, F. Borsa, P. Carretta, J.H. Cho, F.C. Chou, M. Corti, R.J. Gooding, E. Lai, A. Lascialfari, L.L. Miller, N.M. Salem, B.J. Suh, D.R. Torgeson, D. Vaknin, K.J.E. Vos, J.L. Zarestky, in High-Tc Superconductivity 1996: Ten Years after the Discovery (E. Kaldis, E. Liarokapis, K.A. Müller, eds.), p. 311, Dordrecht, Kluwer Academic Publishers, 1997.
- [3] M.A. Kastner, R.J. Birgeneau, G. Shirane and Y. Endoh, Rev. Mod. Phys. 70, 897 (1998).
- [4] C. Berthier, M.-H. Julien, M. Horvatić and Y. Berthier, J. Phys. I (France) 12, 2205 (1996).
- [5] A. Rigamonti, F. Borsa and P. Carretta, Rep. Prog. Phys. 61, 1367 (1998).
- [6] K. Asayama, Y. Kitaoka, G.-Q. Zheng, K. Ishida, K. Magishi,Y. Tokunaga and K. Yoshida, Int. J. Mod. Phys B 30-31, 3207 (1998).
- [7] Ch. Niedermayer, C. Bernhard, T. Blasius, A. Golnik, A. Moodenbaugh and J.I. Budnick, Phys. Rev. Lett. 80, 3843 (1998).
- [8] M.-H. Julien, F. Borsa, P. Carretta, M. Horvatić, C. Berthier and C.T. Lin, Phys. Rev. Lett. 83, 604 (1999).
- [9] C. Panagopoulos, B.D. Rainford, J.R. Cooper and C.A. Scott, cond-mat/0002239.
- [10] M.-H. Julien, P. Carretta and F. Borsa, Appl. Magn. Res. 3-4 (2000); cond-mat/9909351.
- [11] A.W. Hunt, P.M. Singer, K.R. Thurber and T. Imai, Phys. Rev. Lett. 82, 4300 (1999).
- [12] P.M. Singer, A.W. Hunt, A.F. Cederström and T. Imai, Phys. Rev. B 60, 15345 (1999).
- [13] B.J. Suh, P.C. Hammel, M. Hücker, B. Büchner, U. Ammerahl and A. Revcolevschi, Phys. Rev. B61, R9265 (2000).
- [14] N.J. Curro, B.J. Suh, P.C. Hammel, M. Hücker, B. Büchner, U. Ammerahl and A. Revcolevschi, Phys. Rev. Lett. 85, 642 (2000) .
- [15] M. Matsumura, T. Ikeda and H. Yamagata, J. Phys. Soc. Jpn. 69, 1023 (2000).
- [16] J.M. Tranquada, Physica (Amsterdam) 241B-243B, 745 (1998) and Refs. therein.
- [17] See, for instance, R.F. Service, Science 283, 1106 (1999).
- [18] I.M. Abu-Shiekah, O.O. Bernal, A.A. Menovsky, H.B. Brom and J. Zaanen, Phys. Rev. Lett.83, 3309 (1999).
- [19] M.-H. Julien, P. Carretta, M. Horvatić, C. Berthier, Y. Berthier, P. Ségransan, A. Carrington and D. Colson, Phys. Rev. Lett. 76, 4238 (1996)
- [20] H. Kimura, K. Hirota, H. Matsushita, K. Yamada, Y. Endoh, S.-H. Lee, C.F. Majkrzak, R. Erwin, G. Shirane, M. Greven, Y.S. Lee, M.A. Kastner and R.J. Birgeneau, Phys. Rev. B 59, 6517 (1999).
- [21] J.M. Tranquada, B.J. Sternlieb, J.D. Axe, Y. Nakamura and S. Uchida, Nature 375, 561 (1995).
- [22] S. Ohsugi, Y. Kitaoka, K. Ishida, G.-q. Zheng and K. Asayama, J. Phys. Soc. Jpn.63, 700 (1994).
- [23] V. Kataev, Yu. Greznev, G. Teitel’baum, M. Breuer and N. Knauf, Phys. Rev. B48, 13042 (1993).
- [24] B.I. Kochelaev, J. Sichelschmidt, B. Elschner, W. Lemor and A. Loidl, Phys. Rev. Lett. 79, 4274 (1997).
- [25] E. Torikai, I. Tanaka, H. Kojima, H. Kitazawa and K. Nagamine, Hyp. Int. 63, 271 (1990).
- [26] K. Kumagai, K. Kawano, I. Watanabe, K. Nishiyama and K. Nagamine, Hyp. Int. 86, 473 (1994).
- [27] H. Nishihara, H. Yasuoka, T. Shimizu, T. Tsuda, T. Imai, S. Sasaki, S. Kanbe, K. Kishio, K. Kitazawa and K. Fueki, J. Phys. Soc. Jpn. 56, 4559 (1987).
- [28] R.E. Walstedt and S.-W. Cheong, Phys. Rev. B51, 3163 (1995). Larger values of have been put forward in the literature, but this is unimportant for the order of magnitude estimate performed here.
- [29] C.P. Slichter, Principles of Magnetic Resonance (Springer-Verlag, Berlin, 1990).
- [30] C. Pennington and C.P. Slichter, Phys. Rev. Lett. 66, 3812 (1991).
- [31] For the 63,65Cu NMR central line, and magnetic and frequency-independent fluctuations: .
- [32] N. Bloembergen and T.J. Rowland, Acta Met. 1, 731 (1953).
- [33] J. Winter, Magnetic Resonance in Metals (Oxford University Press, Oxford, 1971).
- [34] D.A. Levitt and R.E. Walstedt, Phys. Rev. Lett. 38, 178 (1977).
- [35] D.E. MacLaughlin and H. Alloul, Phys. Rev. Lett. 38, 181 (1977).
- [36] M.C. Chen and C.P. Slichter, Phys. Rev. B 27, 278 (1983).
- [37] A. Revcolevschi and J. Jegoudez, in Coherence in High Superconductivity, Edited by G. Deutscher and A. Revcolevschi (World Scientific, 1996), p.19.
- [38] S. Petit, A.H Moudden, B. Hennion, A. Vietkin and A. Revcolevschi, Eur. J. Phys. B 3, 163 (1998).
- [39] T. Nagano, Y.Tomioka, Y. Nakayama, K. Kishio and K. Kitazawa, Phys. Rev. B 48, 9689 (1993).
- [40] A.R. Moodenbaugh, L.H. Lewis and S. Soman, Physica (Amsterdam) 290C, 98 (1997).
- [41] J.E. Ostenson, S. Bud’ko, M. Breitwisch, D.K. Finnemore, N. Ichikawa and S. Uchida, Phys. Rev. B 56, 2820 (1997).
- [42] Y.M. Huh, J.E. Ostenson, F. Borsa, V.G. Kogan, D.K. Finnemore, A. Vietkin, A. Revcolevschi and M.-H. Julien, submitted.
- [43] In a field of 15 T, the width at half maximum of the sharp peak for (see Fig. 1) increases by a factor 2.2 from 57 K (55 kHz) to 10 K (123 kHz).
- [44] M.-H. Julien, T. Fehér, M. Horvatić, C. Berthier, O.N. Bakharev, P. Ségransan, G. Collin and J.F. Marucco, Phys. Rev. Lett.84, 3422 (2000).
- [45] T. Goto, S. Kazama, K. Miyagawa and T. Fukase, J. Phys. Soc. Jpn.63, 3494 (1994).
- [46] T. Goto, K. Chiba, M. Mori, T. Suzuki, K. Seki and T. Fukase, J. Phys. Soc. Jpn.66, 2870 (1997).
- [47] T. Suzuki, T. Goto, K. Chiba, T. Shinoda, T. Fukase, H. Kimura, K. Yamada, M. Ohashi and Y. Yamaguchi, Phys. Rev. B57, R3229 (1998).
- [48] A. Narath, Phys. Rev. 162, 320 (1967).
- [49] J.H. Cho, F. Borsa, D.C. Johnston and D.R. Torgeson, Phys. Rev. B 46, 3179 (1992).
- [50] An attempt to detect a possible enhancement of the quadrupolar relaxation channel, by comparing the recovery of for central and satellite NMR lines, at different temperatures, was unsuccessful.
- [51] For convenience, is defined as the time at which has decreased by a factor . The values defined in this way are close to those from a stretched exponential fit , which we attempted here, but found not entirely satisfactorily (this is better seen in a logarithmic horizontal scale and linear vertical scale). However, one should keep in mind that these values are artificially short: a fit with the theoretical law given in the text, which contains large numerical factors in some exponentials, leads to values longer by about an order of magnitude.
- [52] A. Suter, M. Mali, J. Roos and D. Brinkmann, J. Phys.: Cond. Matter 10, 5977 (1998).
- [53] G.S. Boebinger, Y. Ando, A. Passner, T. Kimura, M. Okuya, J. Shimoyama, K. Kishio, K. Tasmasaku, N. Ichikawa and S. uchida, Phys. Rev. Lett.77, 5417 (1996).
- [54] A. Malinowski, M.Z. Cieplak, A.S. van Steenbergen, J.A.A.J. Perenboom, K. Karpińska, M. Berkowski, S. Guha and P. Lindenfeld, Phys. Rev. Lett. 79, 495 (1997).
- [55] In order to compare with the work Cho et al. [49], values for this plot where obtained from the slope of the recovery plot for . For , the NMR data were rescaled by a factor of 1.55 in order to match NQR values (see Fig. 9).
- [56] A. Shengelaya, G.-m. Zhao, C.M. Aegerter, K. Conder, I.M. Savić and H. Keller, Phys. Rev. Lett.83, 5142 (1999).
- [57] M.E. Filipkowski, J.I. Budnick and Z. Tan, Physica (Amsterdam) 167C, 35 (1990).
- [58] F.C. Chou, N.R. Belk, M.A. Kastner, R.J. Birgeneau and A. Aharony, Phys. Rev. Lett. 75, 2204 (1995).
- [59] S. Wakimoto, S. Ueki, Y. Endoh and K. Yamada, cond-mat/9910400.
- [60] Each 139La nucleus is coupled to several Cu sites. If these Cu sites have different fluctuating frequencies, is determined by the fastest relaxation channel. This means that may only probe the slowest magnetic moment to which it is coupled. So, we cannot exclude, in principle, that some individual Cu2+ moments do not freeze. The data show however that ”non-freezing regions” of typical size larger than a few lattice spacings are not present in the sample. Furthermore, a situation with very different fluctuating frequencies on neighboring sites is quite unlikely.
- [61] B. Nachumi, Y. Fudamoto, A. Keren, K.M. Kojima, M. Larkin, G.M. Luke, J. Merrin, O. Tchernyshyov, Y.J. Uemura, N. Ichikawa, M. Goto, H. Takagi, S. Uchida, M.K. Crawford, E.M. McCarron, D.E. MacLaughlin and R.H. Heffner, Phys. Rev. B 58, 8760 (1998).
- [62] V. Kataev, B.Rameev, A. Validov, B. B chner, M. H cker and R. Borowski, Phys. Rev. B58, R11876 (1998).
- [63] N. Ichikawa, S. Uchida, J.M. Tranquada, T. Niemöller, P.M. Gehring, S.-H. Lee and J.R. Schneider, cond-mat/9910037.
- [64] K.S.D. Beach and R.J. Gooding, Eur. Phys. J. B 16 579 (2000); Schmalian and P.G. Wolynes, Phys. Rev. Lett.85, 836 (2000); N. Hasselman, A.H. Castro Neto and C. Morais Smith, cond-mat/0005486.
- [65] S. Tajima, N.L. Wang, N. Ichikawa, H. Eisaki, S. Uchida, H. Kitano, T. Hanaguri and A. Maeda, Europhys. Lett. 47, 715 (1999).
- [66] T. Noda, H. Eisaki and S.-i. Uchida, Science 286, 265 (1999).
- [67] W. Wagener, H.-H. Klau , M. Hillberg, M.A.C. de Melo, M. Birke, F.J. Litterst, B. B chner and H. Micklitz, Phys. Rev. B55, R14761 (1997).
- [68] J. Tranquada, J.D. Axe, N. Ichikawa, A.R. Moodenbaugh, Y. Nakamura and S. Uchida, Phys. Rev. Lett.78, 338 (1997).
- [69] V.J. Emery, Hyp. Int. 63, 13 (1990); V.J. Emery and S.A. Kivelson, Physica (Amsterdam) 209C, 597 (1993); V.J. Emery and S.A. Kivelson, J. Low. Temp. Phys. 117, 189 (1999).