[
Vertical Boundary at in the Structural Phase Diagram of the La1-xSrxMnO3 System
Abstract
The structural phase diagram of the La1-xSrxMnO3 system in the compositional range has been investigated by high-resolution synchrotron x-ray powder diffraction techniques between K. Recent studies have reported that there is an unusual rentrant-type phase transition in this range involving an abrupt change in lattice parameters but no change in the crystal symmetry, which remains orthorhombic . The transition to the reentrant phase is from a ferromagnetic metallic to a ferromagnetic insulating phase with some unusual properties. Our results demonstrate that for samples with there exist two lower-symmetry structural regions having monoclinic and triclinic symmetry respectively. There is a sharp first-order transition from the monoclinic to the triclinic phase coinciding with the transition to the ferromagnetic insulating phase, and an abrupt crossover from the orthorhombic region with a near-vertical phase boundary just below . The new phases indicate the presence of some novel type of orbital ordering unlike that found in LaMnO3.
]
I INTRODUCTION
Since the recent discovery of colossal magnetoresistance in doped rare-earth manganate perovskites of the type La1-xAxMnO3 (),[1] there has been an enormous amount of attention focussed on the relationships among magnetic, electrical and structural properties, especially with respect to the delicate and complex balance between charge, orbital and magnetic ordering. Considerable progress has been made in understanding the physics of these materials, and it is now widely accepted that although the traditional double-exchange mechanism originally proposed by Zener[2, 3, 4] is qualitatively able to account for the ferromagnetic metallic (FMM) state observed at intermediate doping levels of ,[5, 6] it is not capable of explaining many of the other magnetic and transport properties.[7] Some important recent advances have been the recognition of the importance of electron-phonon coupling effects,[8, 9] calculations which show a tendency for these materials towards phase separation,[10, 11] and the application of x-ray resonant scattering techniques as a probe of orbital ordering.[12] In the case of LaMnO3, such techniques have provided direct evidence of the orbital ordering of distorted MnO6 octahedra associated with a cooperative Jahn-Teller (JT) effect previously inferred on the basis of bond distances obtained from structure determinations.
One of the important and intriguing remaining questions is the nature of the ferromagnetic insulating (FMI) phase in lightly-doped La1-xSrxMnO3 with .[13] An usual feature of this phase is that neutron diffraction measurements have shown that for there is first a transition to a FMM phase from the paramagnetic insulating (PMI) state at higher temperatures, followed by an abrupt first-order transition to the FMI phase[14, 15], accompanied by the appearance of a weak antiferromagnetic component with the A-type magnetic structure similar to that found in LaMnO3.[16] In another neutron diffraction study of crystals with and 0.15, Yamada et al.[17] observed that the FMI phase gave weak superlattice peaks which they attributed to long-range ordering of Mn4+ ions over 1/8 of the Mn sites, and this type of charge-ordering scenario has been accepted in most subsequent publications in the literature. However, a recent neutron and synchrotron x-ray study of a crystal with has demonstrated that conventional charge-ordering does not occur, and that the key parameter in the transition to the FMI phase is the orbital degree of freedom of the electrons.[18, 19]
The present paper describes the results of a high-resolution synchrotron x-ray powder diffraction study carried out on several compositions in the range . The samples were obtained from fragments of crystals grown in exactly the same way as the one used by Endoh et al.[18] The results demonstrate the existence of two previously unreported lower-symmetry phases with monoclinic and triclinic symmetry respectively in this region of the phase diagram, separated by a sharp boundary at from the JT-ordered LaMnO3-type orthorhombic phase which exists at lower values of .
II STRUCTURAL CONSIDERATIONS
Before describing the results of the present study, we first review briefly some of the relevant structural literature. The room-temperature structure of the parent compound LaMnO3 has been reported by several groups to have a distorted perovskite-like structure with orthorhombic symmetry, and lattice parameters , , , where is the parameter of the ideal cubic lattice[20, 21, 22, 23]. As described in a detailed neutron powder diffraction study by Rodriguez-Carvajal et al.,[23] the structure has lattice parameters , , Å, and is characterized by an octahedral tilt arrangement of the type a-a-c+[24] and antiferrodistortive orbital ordering in the plane associated with a cooperative JT effect, resulting in two long Mn-O bond distances of 2.18 Å and four shorter ones ( and Å). Because of the orbital ordering, the spontaneous orthorhombic strain in the basal-plane (defined as ) is unusually large (about %) in LaMnO3 compared to that in most -type perovskites, and the axis is significantly shortened ( Å). The orbital ordering disappears at K, above which the lattice is metrically cubic. However, Rietveld refinements show that the octahedral tilt angle decreases very little through the transition, and the structure is still unequivocally orthorhombic. At K there is a further transformation to a rhombohedral structure with symmetry, but this phase will not be of any concern in the present paper. The JT-ordered structure is usually designated , and the “pseudocubic” disordered structure or . The latter notation will be used hereafter.
In contrast to the LaMnO3 samples used in the other structural studies, which were prepared by conventional solid-state synthesis, the one used by Rodriguez-Carvajal et al.[23] was prepared by crushing single-crystal ingots grown by the floating-zone method. They emphasize that the structural properties are very sensitive to the amount of Mn4+ introduced during synthesis; for example, the spontaneous orthorhombic strain decreases, the c parameter increases, and the transition temperatures to the pseudocubic and rhombohedral phases decrease quite rapidly with increasing Mn4+ content.
The influence of oxygen partial pressure and the formation of Mn4+ during the synthesis of ceramic samples was earlier discussed by Mitchell et al.[25] in an investigation of the room-temperature structural phase diagram of La1-xSrxMnO3+δ. For , oxygen partial pressures of are needed to stabilize the phase. These authors also report that LaMnO3 prepared under a of has a monoclinic structure with symmetry, but it seems clear from the lattice parameters and atomic positions that this structure is almost identical to the orthorhombic one.[26]
The variation of room-temperature lattice parameters in single crystals of La1-xSrxMnO3 with increasing is nicely illustrated in Fig. 1 of Urushibara et al.,[13] which shows a rapid decrease in spontaneous orthorhombic strain and an increase in up to , a pseusocubic cell at , and a transition to the rhombohedral structure at . The electronic phase diagram shows a narrow FMI region between at temperatures below K. Subsequent neutron diffraction studies on samples with [15, 27, 28] revealed a very unusual structural transition around 150 K from a JT-distorted phase to a pseudocubic structure metrically similar to that at 300 K and designated by Kawano et al.,[15] who described this as a “reentrant” transition, and presented schematic structural and magnetic phase diagrams. A more detailed structural phase diagram was reported by Pinsard et al.,[29] who found the low-temperature reentrant phase existed only in the narrow range of composition .
In the meantime, Yamada et al.[17] reported a neutron diffraction study of single crystals with and 0.15, in which they noted the appearance of superlattice peaks in the FMI region which could be indexed in terms of a doubling of the orthorhombic axis. They proposed a model structure consisting of alternating layers of Mn4+ ions ordered on 1/4 of the Mn sites interleaved with layers of orbitally-ordered Mn3+ ions similar to those in LaMnO3, but did not provide any quantitative intensity data in support of this model.
Similar superlattice peaks were observed in a high-energy synchrotron x-ray study of crystals with and 0.15 [30], and in a recent neutron and synchrotron x-ray study of a crystal with .[18] A striking result of the latter study was that x-ray resonant scattering techniques revealed the existence of orbital ordering in the FMI region below 145 K. Although this behavior shows a resemblance to that reported for LaMnO3,[12] there is a very significant difference, namely that a resonant signal was not observed in the JT-distorted region above the transition, but only in the pseudocubic reentrant region. Thus, the nature of the JT-type order in the intermediate region is clearly different from the ()-type orbital order in LaMnO3. Further evidence for such a difference is provided by the spin-wave dispersion measurements of Hirota et al.[31], who found a dimensional “crossover” at around from the two-dimensional state in LaMnO3 to a three-dimensional isotropic ferromagnetic state. Endoh et al.[18] also note that the superlattice peaks do not show the expected resonance features characteristic of charge-ordering. Thus although there is clearly some kind of structural modulation along the axis, it cannot be attributed to conventional charge or orbital ordering. Furthermore, magnetization measurements show clearly that the low-temperature ferromagnetic phase is stabilized by the application of a magnetic field,[32, 33, 34] whereas a charge-ordered structure would be be expected to melt in high magnetic fields. The experimental features of the transition are well accounted for by a theory in which the orbital degree of freedom is considered in the presence of strong electron correlations,[35] and Endoh et al.[18] conclude that it is this orbital degree of freedom which is the key parameter in the transition.
III EXPERIMENTAL DETAILS
Single crystals of La1-xSrxMnO3 with nominal compositions and 0.125 were grown in a floating-zone furnace. For subsequent powder diffraction studies, particular attention was given to the preparation of suitable samples in order to minimize possible broadening of the peak profiles due to induced microstrain or too small a particle size. Small fragments of the crystals were crushed and lightly ground in an agate mortar under acetone, and the fraction retained between mesh sieves ( m) was loaded into an 0.2 mm glass capillary which was then sealed. High-resolution synchrotron x-ray data were collected on several different occasions at beamline X7A at the Brookhaven National Synchrotron Light Source with a flat Ge(220) analyzer crystal, set for a wavelength between Å. With this diffraction geometry, the instrumental resolution over the 2 range is full-width at half-maximum (FWHM), an order-of-magnitude better than that of a typical laboratory diffractometer. In some cases, extended data sets were obtained with a linear position-sensitive detector, which has the advantage of giving greatly-improved counting statistics but with lower resolution (FWHM ).
For low-temperature runs the capillary was mounted in a closed-cycle helium cryostat, and scans were made over selected angular regions with a step-size of typically 0.005∘. During each counting interval, the sample was rocked over several degrees, which is essential to achieve powder averaging over crystallites of this size. For runs above room-temperature, the capillary was mounted in a wire-wound boron nitride tube furnace, and rotated continuously at about 1 Hz during data collection. Data were collected over regions corresponding to the pseudocubic (100), (110), (111), (200), (220) and (222) reflections, and also the orthorhombic (021) region on selected occasions. Least-squares fits to the observed peak profiles were made based on a pseuso-Voigt function with appropriate corrections for low-angle asymmetry due to axial divergence.[36] This procedure provides an accurate description of the peak shapes, which is crucial for the identification of coexisting perovskite-like phases with low symmetry and similar lattice parameters.
The crystal symmetry of a distorted perovskite-like structure can be determined uniquely from the characteristic splitting of the pseudocubic , and peaks. As mentioned above, the parent compound LaMnO3 has orthorhombic symmetry, with unit cell dimensions , , , where is the edge of the simple cubic cell, and the split peaks have the indices and relative intensities listed in Table I. For lower crystal symmetries, additional splittings of some of the peaks occur, as will be described later. Another feature of the distorted structure is the appearance of weak superlattice peaks resulting from a combination of octahedral tilts and shifts of the large A-site cations from the ideal cubic positions. The (021) superlattice peak is especially significant in this respect, since it provides the means to uniquely identify the parameter (the corresponding (201) reflection being forbidden in for symmetry reasons) and is well-resolved from the adjacent fundamental reflections. It cannot be overemphasized that for the very small distortions observed in some of these materials, extremely high resolution is needed for a correct assignment of the crystal symmetry. The task is further complicated by the coexistence of two phases in most of the samples.
IV RESULTS
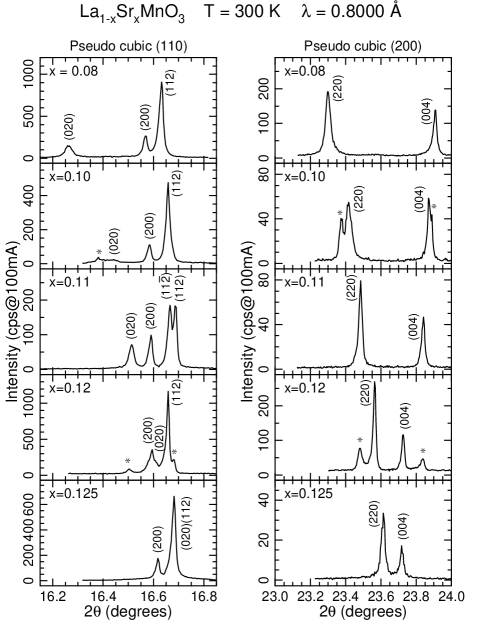
Some representative scans at 300 K over the pseudocubic (110) and (200) regions are shown in Fig. 1 for the five compositions. It is clear from these scans that the samples with and 0.12 contain substantial amounts of a second phase with slightly different lattice parameters. Furthermore, a careful analysis of the pseudocubic (200) peak profiles reveals that there is also a second minority phase in the samples with and 0.11, and that only the sample can be considered to be single phase. However, the most striking feature in Fig. 1 is the splitting at the orthorhombic (112) position for into two roughly equal components, which is conclusive evidence of a lower symmetry (Table I). Analysis of the complete set of peak profiles for this material revealed the true symmetry to be monoclinic. An approximate estimate of the phase fractions in the two-phase samples was obtained from the relative intensities of the two sets of peaks and consideration of the predicted intensity ratios in Table I.
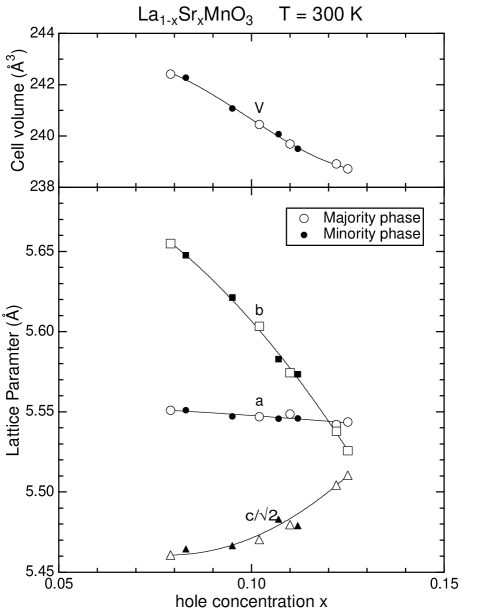
The lattice parameters at 300 K were determined from least-squares fits to the peak positions for each of the five samples, including the minority phases. If the nominal compositions of the samples are assumed to be correct, a fairly accurate estimate of the “true” compositions in the two-phase samples can be obtained from the estimated phase fractions and either the variation of the parameter or the unit-cell volume, both of which are quite sensitive to small changes in . The coexistence of two phases in crystals grown by the floating-zone technique can be attributed either to differences in oxygen content or to fluctuations in Sr concentration in different parts of boule. In either case, should be interpreted as the Mn4+ content or hole concentration, but only on a relative scale, since the actual oxygen stoichiometry of the as-grown sample is not known precisely. The lattice parameters and compositions derived from the above procedure are summarized in Table II and plotted as a function of in Fig. 2. These results are qualitatively similar to those reported by Urushibara et al,[13] i.e. decreases sharply, increases fairly rapidly, and decreases slowly with increasing . It is interesting to note that there is a “cross-over” at K for the and parameters at , signifying a change of sign in the basal-plane strain , corresponding to the disappearance of JT-type orbital ordering. The rapid change of as a function of is reflected in a tendency for the (020) peak to be somewhat broadened with respect to the others, as can be seen in Fig. 1 for and 0.10, for example. From the measured peak-widths it is possible to estimate the compositional fluctuation, , to be (FWHM) after correction for instrumental resolution.
Several sets of measurements were carried out as a function of temperature in order to map out the features of the structural transition. For nominal , JT-type orbital ordering transitions occurred for the majority () and minority () phases at and K respectively, as inferred by a sharp downturn in the parameter. No indication of any reentrant behavior was observed down to 20 K. The variation of the lattice parameters of the phase was qualitatively similar to that of LaMnO3,[23] but the maximum strain was much less, about % vs. %. Similar behavior was found for nominal , in which orbital ordering transitions were observed for the majority () and minority () phases at and K respectively, with values of of % and % respectively at 20 K.
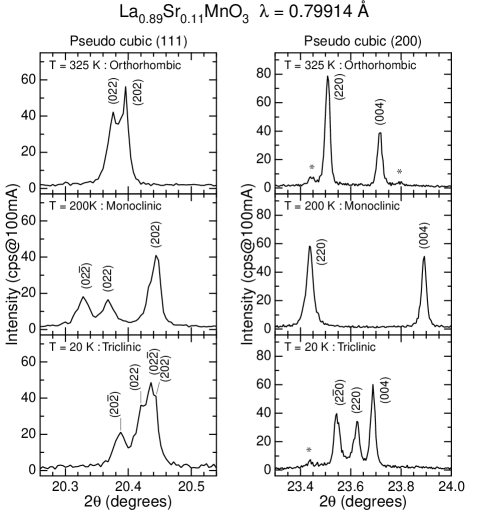
The behavior of the nominal sample was strikingly different, as illustrated by the scans of the pseudocubic (111) and (200) reflections shown in Fig. 3. At 325 K the peak splittings and intensity ratios confirm that the symmetry is orthorhombic (Table I). Between 320–105 K, the separation between the (220) and (004) peaks is approximately doubled, indicative of a cooperative JT ordered structure in the plane, and the (022) reflection is split into two roughly equal peaks, consistent with the monoclinic symmetry noted above. Quite remarkably, in addition to the abrupt change in lattice parameters previously reported[15, 27, 28, 29, 33] there is another distortion of the lattice below 105 K, clearly shown by the splitting of the (220) peak into two components with about the same intensity. Determination of the crystal symmetry is complicated by the large number of peaks and the high degree of overlap, but from a careful analysis of the peak positions and intensity ratios it is possible to conclude that the structure must be triclinic.
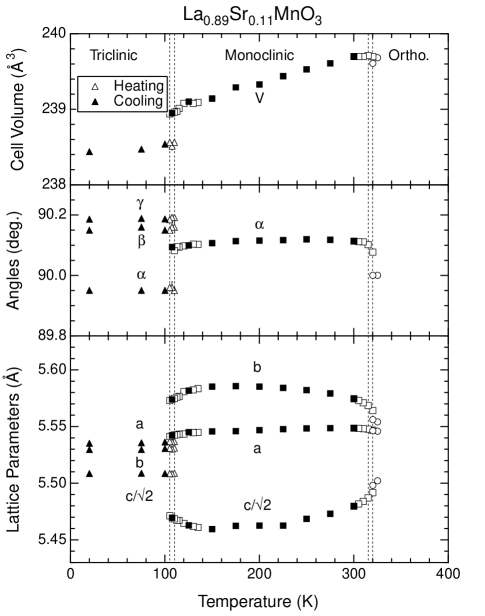
The variation of the lattice parameters and cell volume as a function of temperature is shown in Fig. 4. In order to differentiate between the and axes it was assumed that reflections derived from the forbidden orthorhombic (201) reflection were also absent in the lower symmetry phases. These assignments are consistent with those reported in previous studies of .[27, 29] The orthorhombic-to-monoclinic phase transformation occurs over a coexistence range of about 5 K centered around 320 K (Fig. 4), at which point the two phases are present in roughly equal proportions, and there are small but abrupt changes in , and respectively, indicative of a weakly first-order transition. In the coexistence region there are small changes in and for both phases which can be attributed to compositional fluctuations with . No hysteresis was observed within an experimental accuracy of K. Between K, there is a smooth increase in and , and a decrease in indicative of a cooperative JT ordering, but the orthorhombic strain is much less than in LaMnO3. Below 150 K there is a slight downturn in and upturn in , followed by an abrupt change at K associated with the reentrant-type transition from monoclinic to triclinic symmetry. There is coexistence of the two phases over K, with a hysteresis on heating of K. The behavior shown in Fig. 4 is qualitatively similar to that previously reported for samples with ,[27, 29] but the reentrant-type transition is much sharper in the present sample.
It is interesting to note the behavior of the very weak (220) peak from the minority phase with , which is well-resolved at 325 K and below 105 K (as shown by asterisks in Fig. 3), and just discernible as a small shoulder in between. There is very little change in the position of this peak over the whole temperature range, and it is accordingly clear that this phase does not undergo a reetrant transition.
The sample with nominal shows well-resolved peaks from two phases at 300 K in the approximate ratio 3:1 (Fig. 1). In this case, the majority phase with estimated transforms to an JT-ordered monoclinic phase at K and undergoes a reentrant transition at K. The behavior of the minority phase, with an estimated , is essentially the same as that of the sample, with transitions at K and K.
Finally, the nominal sample, which appears to be single phase at 300 K, undergoes a first-order transition from orthorhombic to monoclinic at K with a narrow range of two-phase coexistence. Between K, there is a fairly gradual approach to a reentrant transition with a complex two-phase coexistence region, followed by an abrupt jump into a single-phase reentrant region. However, in this case the only indication of lower symmetry is a slight broadening of the (220) peak. The overall variation of the lattice parameters is in good agreement with the results of Pinsard et al.[29]; in particular, the unit-cell volumes at 300 K agree very closely, indicating that the hole concentrations are the same within 0.002 of each other (see Fig. 2).
Values of the lattice parameters are listed in Table III for the majority phase in each of the five samples at selected temperatures in the different symmetry regions, designated by (pseudocubic), (JT-ordered orthorhombic), (JT-ordered monoclinic) and (triclinic). Also tabulated are the basal-plane strain, , which is seen to be positive in the and regions, but negative in the and regions. The assignment of triclinic symmetry to the sample at 75 K must be regarded as very tentative, since it relies mainly on the decomposition of the (220) profile into two peaks.
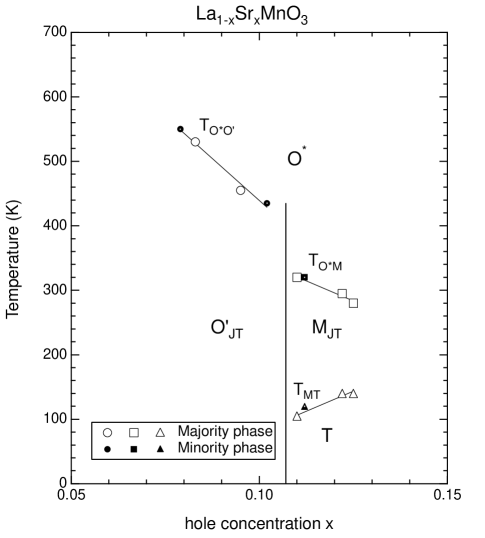
Based on the temperature dependence of the lattice parameters of both the majority and minority phases, it is possible to construct a revised structural phase diagram in this narrow region of composition, as illustrated in Fig. 5. This new phase diagram contains the essential features of the ones proposed by Kawano et al.[15] and Pinsard et al.[29]; in particular the existence of a narrow “reentrant” region between at low temperatures, associated with a transition from an JT-ordered phase to a less-distorted FMI phase. However, in striking contrast to the previous results, this region is structurally far more complex than hitherto supposed: it does not retain orthorhombic symmetry, but instead undergoes a sequence of transitions from orthorhombic-monoclinic-triclinic symmetry. Furthermore, the line separating the and regions is extremely sharp, lying within a narrow region of hole concentration between . In this region, there is also a distinct discontinuity between the rapidly-decreasing slope of the and the more gradually decreasing slope of . There is an indication of similar behavior in the data reported by Pinsard et al.,[29] although their values are significantly lower than those determined here. This could be due to small differences in hole concentration, which for lower values of is very sensitive to the final heat treatment and gas atmosphere.[25] In this context, we note that after heating one sample of to 550 K, the initial orthorhombic phase was not recovered on cooling, but instead a monoclinic phase. Inspection revealed that the capillary had not been properly sealed, from which we infer that some oxidation in air must have occurred even at this low temperature.
V DISCUSSION
The experiments described above have given a clear description of the different types of structure in terms of crystal symmetry, but a detailed determination of the corresponding atomic shifts in the monoclinic and triclinic phases is a far more difficult challenge. Extended data sets were collected with the linear PSD in these regions from the sample in order to check for any weak superlattice peaks associated with the lowering of symmetry, but no extra peaks were observed at intensity levels of % of those of the strong peaks. In a recent powder diffraction study of charge-ordering in La0.5Ca0.5MnO3, several superlattice peaks were found at this intensity level [37], but even if charge-ordering were to occur in the present samples one would anticipate that any additional peaks would be an order-of-magnitude weaker than for the latter compound due to the much smaller fraction of Mn4+ (1/8 vs. 1/2).
At this stage, we can only speculate about possible features of the structures which are consistent with the crystal symmetry and variation of the lattice parameters. In this context, it is important to note that pulsed neutron studies in this composition range have shown that a local JT distortion is present even when the long-range rystallographic structure shows no such distortion.[38]. What is quite clear from the present experiments is that there must be fundamental differences between the conventional JT-distorted structure in the orthorhombic region, the JT-distorted structure in the monoclinic region, and the orbitally-ordered triclinic structure in the FMI region. Although the behavior of the lattice parameters for in the region shown in Fig. 4 implies some kind of JT-ordering in the plane, the fact that there is a monoclinic distortion and the results of the x-ray resonant scattering experiments both demonstrate that this cannot be the usual C-type antiferrodistortive arrangement found in the region. The fairly abrupt crossover from the latter region to the region at , which may be related to the dimensional crossover in the magnetic excitations noted by Hirota et al.[31], is further evidence of a quite different type of orbital order.
One possible structural picture is suggested by the nature of the monoclinic distortion, namely that the unique axis is along [100] in the reference frame (, so that the glide-plane symmetry element is preserved while the and elements are lost. The loss of the mirror plane would be consistent with a change in JT order from C-type to G-type, in which there is antiferrodistortive coupling of MnO6 octahedra along the direction instead of parallel coupling. The corresponding space group ( in our non-standard setting) would now permit reflections of the type with , which are forbidden in space group . Although no peaks of this type can be detected in the diffraction pattern, intensity calculations suggest that such peaks would be very weak as long as there is no change in the octahedral-tilt system characteristic of symmetry. Note that the G-type JT order in the region is consistent with the disappearance of the C-type orbital order as inferred from the missing of resonant x-ray scattering at with of La0.88Sr0.12MnO3.[18] It is natural to assume that the G-type JT order is associated with the G-type orbital order, which should have resonant scattering at (101) and (011) instead of (001). Since (011) is structurally forbidden in , while (101) is permitted, we would be able to see the resonant scattering if the G-type orbital order is realized in the region. This structure is also related to the ordered-polaron model for the FMI phase proposed in Fig. 4 of Yamada et al.[17], to the extent that it corresponds to the configuration in the first and third layers along the doubled axis, with the charge-ordered second and fourth layers removed. Direct confirmation of such a structure from powder data would most likely require a combination of high-resolution and counting statistics that only an undulator beamline could provide, and may in fact require a very careful single-crystal study.
It is even more difficult to speculate about the nature of the triclinic structure. Clearly there is a drastic change in the type of orbital order in which the glide-plane is lost and presumably only the inversion center is retained. The doubling of the axis observed in single-crystal studies must also be taken into account. The behavior of the lattice parameters implies a much more complex type of JT orbital order which is no longer confined to the plane, possibly associated with orbital hybridization of the type proposed by Endoh et al.[18]. Elucidation of this structure will certainly have to await a detailed single-crystal study.
Acknowledgements.
Work at Brookhaven was supported by the U.S. Department of Energy, Division of Materials Sciences, under contract No. DE-AC02-98CH10886. The National Synchrotron Light Source is supported by the U.S. Department of Energy, Divisions of Materials Sciences and Chemical Sciences. This work was partly supported by a Grant-in-Aid for Scientific Research from the Ministry of Education, Science, Sports and Culture, by Core Research for Evolutional Science and Technology (CREST) from Japan Science and Technology Corporation †Present address: Lucent Technologies, P.I. Tres Cantos, s/n - Zona Oeste, 28760 Tres Cantos, Madrid, Spain. ‡Present address: Institute for Materials Science, National Center for Scientific Research “Demokritos”, 15310 Agia Paraskevi, Athens, Greece. ∗Present address: CREST, Institute for Materials Reserach, Tohoku University, Katahira 2-1, Aoba-ku, Sendai 980-8577, Japan.REFERENCES
- [1] S. Jin, T. H. Tiefel, M. McCormack, and R. A. Fatsnacht, Science 264, 413 (1994).
- [2] C. Zener, Phys. Rev. 82, 403 (1951).
- [3] P. W. Anderson and H. Hasegawa, Phys. Rev. 100, 675 (1955).
- [4] P.-G. de Gennes, Phys. Rev. 118, 141 (1960).
- [5] G. H. Jonker and J. H. Van Santen, Physica 16, 337 (1950).
- [6] J. H. Van Santen and G. H. Jonker, Physica 16, 599 (1950).
- [7] A. J. Millis, P. B. Littlewood, and B. I. Shraiman, Phys. Rev. Lett. 74, 5144 (1995).
- [8] H. Roder, J. Zhang, and A. R. Bishop, Phys. Rev. Lett. 76, 1356 (1996).
- [9] A. J. Millis, B. I. Shraiman, and R. Mueller, Phys. Rev. Lett. 77, 175 (1996).
- [10] S. Junoki, J. Hu, A. L. Malvezzi, A. Moreno, N. Furukawa, and E. Dagotto, Phys. Rev. Lett. 80, 845 (1998).
- [11] A. Moreno, S. Junoki, and E. Dagotto, Science 283, 2034 (1999).
- [12] Y. Murakami, J. P. Hill, D. Gibbs, M. Blume, I. Koyama, M. Tanaka, H. Kawata, T. Arima, Y. Tokura, K. Hirota, and Y. Endoh, Phys. Rev. Lett. 81, 582 (1998).
- [13] A. Urushibara, Y. Moritomo, T. Arima, A. Asamitsu, G. Kido, and Y. Tokura, Phys. Rev. B 51, 14103 (1995).
- [14] H. Kawano, R. Kajimoto, M. Kubota, and H. Yoshizawa, Phys. Rev. B 53, 2202 (1996).
- [15] H. Kawano, R. Kajimoto, M. Kubota, and H. Yoshizawa, Phys. Rev. B 53, R14709 (1996).
- [16] E.O. Wollan and W.C. Koehler, Phys. Rev. 100, 545 (1955).
- [17] Y. Yamada, O. Hino, S. Nohdo, R. Kanao, T. Inami, and S. Katano, Phys. Rev. Lett. 77, 904 (1996).
- [18] Y. Endoh, K. Hirota, S. Ishihara, S. Okamoto, Y. Murakami, A. Nishizawa, T. Fukuda, H. Kimura, H. Nojiri, K. Kaneko, and S. Maekawa, Phys. Rev. Lett. 82, 4328 (1999).
- [19] T. Inami, N. Ikeda, Y. Murakami, I. Koyama, Y. Wakabayashi, and Y. Yamada, Japan J. Appl. Phys. 38, 212 (1999).
- [20] J. B. A. A. Elemans, B. van Laar, K. R. van der Veen, and B. O. Loopstra, J. Solid State Chem. 3, 238 (1971).
- [21] P. Norby, I. G. Krogh Andersen, E. Krogh Andersen, and N. H. Andersen, J. Solid State Chem. 119, 191 (1995).
- [22] Q. Huang, A. Santoro, J. W. Lynn, R. W. Erwin, J. A. Borchers, J. L. Peng, and R. L. Green, Phys. Rev. B 55, 14987 (1997).
- [23] J. Rodriguez-Carvajal, M. Hennion, F. Moussa, A. H. Moudden, L. Pinsard, and A. Revcolevschi, Phys. Rev. B 57, R3189 (1998).
- [24] A. M. Glazer, Acta Crystallogr. B 28, 3384 (1972); A. M. Glazer, Acta Crystallogr. A 31, 756 (1975).
- [25] J. F. Mitchell, D. N. Argyriou, C. D. Potter, D. G. Hinks, J. D. Jorgensen, and S. D. Bader, Phys. Rev. B 54, 6172 (1996).
- [26] In fact, Rodriguez-Carvajal et al. note that this structure can be satisfactorily refined within symmetry.[23]
- [27] D. N. Argyriou, J. F. Mitchell, C. D. Potter, D. G. Hinks, J. D. Jorgensen, and S. D. Bader, Phys. Rev. Lett. 76, 3826 (1996).
- [28] L. Pinsard, J. Rodriguez-Carvajal, A. H. Moudden, A. Anane, A. Revcolevschi, and C. Dupas, Physica B 234-6, 856 (1997).
- [29] L. Pinsard, J. Rodriguez-Carvajal, and A. Revcolevschi, J. Alloys Compounds 262-3, 152 (1997).
- [30] T. Niemoller, M. von Zimmermann, S. Uhlenbruck, O. Friedt, B. Buchner, T. Frello, N. H. Anderson, P. Berthet, L. Pinsard, A. M. De Leon-Guevara, A. Revcolevschi, and J. R. Schneider, Eur. Phys. J. B 8, 5 (1999).
- [31] K. Hirota, K. Kaneko, A. Nishizawa, Y. Endoh, M. C. Martin, and G. Shirane, Physica B 237-8, 36 (1997).
- [32] R. Senis, V. Laukhin, B. Martinez, J. Fontcuberta, X. Obradors, A. A. Arsenov, and Y. M. Mukovskii, Phys. Rev. B 57, 14680 (1998).
- [33] S. Uhlenbruck, R. Teipen, R. Klingeler, B. Buchner, O. Friedt, M. Hucker, H. Kierspel, T. Niemoller, L. Pinsard, A. Revcolevschi, and R. Gross, Phys. Rev. Lett. 82, 185 (1999).
- [34] H. Nojiri, K. Kaneko, M. Motokawa, K. Hirota, Y. Endoh, and K. Takahashi, Phys. Rev. B 60, 4142 (1999).
- [35] S. Ishihara, J. Inoue, and S. Maekawa, Phys. Rev. B 55, 8280 (1997).
- [36] L. W. Finger, D. E. Cox, and A. P. Jephcoat, J. Appl. Crystallogr. 27, 892 (1994).
- [37] P. G. Radaelli, D. E. Cox, M. Marezio, and S-W. Cheong, Phys. Rev. B 55, 3015 (1997).
- [38] D. Louca, T. Egami, E. L. Brosha, H. Röder, and A. R. Bishop, Phys. Rev. B 56, R8475 (1997).
| Cubic | Orthorhombic | Monoclinic | Triclinic | |||
|---|---|---|---|---|---|---|
| 110 (4) | 110 (4) | 110 (2) 10 (2) | ||||
| 100 (6) | ||||||
| 002 (2) | 002 (2) | 002 (2) | ||||
| 200 (2) | 200 (2) | 200 (2) | ||||
| 020 (2) | 020 (2) | 020 (2) | ||||
| 110 (12) | 112 (4) | 112 (2) 12 (2) | ||||
| 112 (8) | ||||||
| 11 (4) | 11 (2) 1 (2) | |||||
| 202 (4) | 202 (4) | 202 (2) 20 (2) | ||||
| 111 (8) | 022 (2) | 022 (2) | ||||
| 022 (4) | ||||||
| 02 (2) | 02 (2) |
| Ratio | Vol. | ||||||||
| (x-ray) | (Å3) | (K) | (K) | ||||||
| 0.08 | 0.079 | 80 % | 242.41 | 550 | – | ||||
| 0.083 | 20 % | 242.27 | 530 | – | |||||
| 0.10 | 0.102 | 75 % | 240.45 | 435 | – | ||||
| 0.095 | 25 % | 241.07 | 455 | – | |||||
| 0.11 | 0.110 | 95 % | 239.69 | 320 | 105 | ||||
| 0.107(a) | 5 % | 240.07 | – | ||||||
| 0.12 | 0.122(b) | 75 % | 238.91 | 295 | 140 | ||||
| 0.112(b) | 25 % | 239.50 | 320 | 120 | |||||
| 0.125 | 0.125 | 100 % | 238.72 | 280 | 140 |
(a) Estimated from lattice parameters at 325 K.
(b) Lattice parameters from interpolation between 295 K and 305 K.
| (K) | (Å) | (Å) | (Å) | Phase | ||
| 0.079 | 580 | 5.5675(6) | 5.5496(6) | 7.8560(9) | ||
| 20 | 5.5497(9) | 5.6646(9) | 7.6845(18) | |||
| 0.102 | 570 | 5.5678(5) | 5.5344(4) | 7.8387(7) | ||
| 20 | 5.5534(3) | 5.6212(11) | 7.7108(15) | |||
| 0.110 | 325 | 5.5459(2) | 5.5542(2) | 7.7811(2) | ||
| 200 | 5.5468(2) | 5.5853(2) | 7.7251(2) | |||
| .115(4) | ||||||
| 20 | 5.5353(5) | 5.5295(5) | 7.7903(1) | |||
| .95(1) | .15(1) | .19(2) | ||||
| 0.122 | 305 | 5.5425(5) | 5.5346(5) | 7.7857(4) | ||
| 175 | 5.5448(4) | 5.5690(4) | 7.7243(3) | |||
| .103(9) | ||||||
| 65 | 5.5315(8) | 5.5196(8) | 7.7893(1) | |||
| .93(2) | .18(1) | .09(1) | ||||
| 0.125 | 300 | 5.5437(6) | 5.5257(6) | 7.7929(8) | ||
| 200 | 5.5455(2) | 5.5622(2) | 7.7333(3) | |||
| .134(2) | ||||||
| 75 | 5.5338(1) | 5.5180(3) | 7.7879(1) | |||
| .96(1) | .14(1) | .03(1) |