[
Continuum in the spin excitation spectrum of a Haldane chain, observed by neutron scattering in CsNiCl3.
Abstract
The spin excitation continuum, expected to dominate the low-energy fluctuation spectrum in the Haldane spin chain around the Brillouin zone center, , is directly observed by inelastic magnetic neutron scattering in the quasi-1D antiferromagnet CsNiCl3. We find that the single mode approximation fails, and that a finite energy width appears in the dynamic correlation function for . The width increases with decreasing , while acquires an asymmetric shape qualitatively similar to that predicted for the 2-magnon continuum in the nonlinear -model.
pacs:
PACS numbers: 75.10.Jm, 75.40.Gb, 75.50.Ee]
Experiments on low-dimensional magnets are an invaluable source of insight into the fundamental properties of quantum spin models and field theories, many of which are still awaiting theoretical solutions. A vivid example is provided by the one-dimensional (1D) Heisenberg antiferromagnet (HAFM). It was conjectured by Haldane [1], and then confirmed by experiments [2, 3, 4, 5] and numerical studies [6, 7, 8, 9, 10, 11], that its ground state (GS) exhibits a robust quantum disorder, characteristic of the 1D nonlinear model (NLM). In striking contrast with the almost ordered ”marginal liquid” state of the chain [12], the Haldane GS is a ”dense spin gas”, with a short correlation length of lattice repeats, and a gap ( is the exchange coupling) in the spin excitation spectrum. The excitations’ spectral weight is concentrated in a long-lived massive triplet mode in the vicinity of the Brillouin zone (BZ) boundary , somewhat similar to the spin-wave doublet in the classical S AFM with easy-axis anisotropy [4]. Any remains of the spectacular continuum at , found in the HAFM chain [12, 13], is attributed to 3(5,7,…)-magnon states, and predicted to be extremely weak [6, 7, 14]. Although no quantitative theory of the excitation spectrum in the whole BZ exists, a continuum is expected in the vicinity of the zone center , where the lowest energy excitations are pairs of magnons.
The two-magnon nature of the lowest excited state in the 1D HAFM at was first stipulated by the Monte Carlo (MC) numerical study [6]. It established, that the gap in the magnon spectrum at is about twice as large as that at . It was later supported by MC simulations on larger systems [6, 7, 8], and exact diagonalization (ED) for rings with up to 18 spins [6, 9]. A semi-quantitative illustration of the lattice periodic quasiparticle dispersion, crossing the two-particle energy at a , was obtained in the physically motivated variational theory [15], based on the mapping of the spin Hamiltonian on a system of spinless fermions. Not only does this simple theory correctly capture the fermion-like nature of the magnons observed in experiment [16], but it also gives a correct functional form for the single-magnon dispersion,
| (1) |
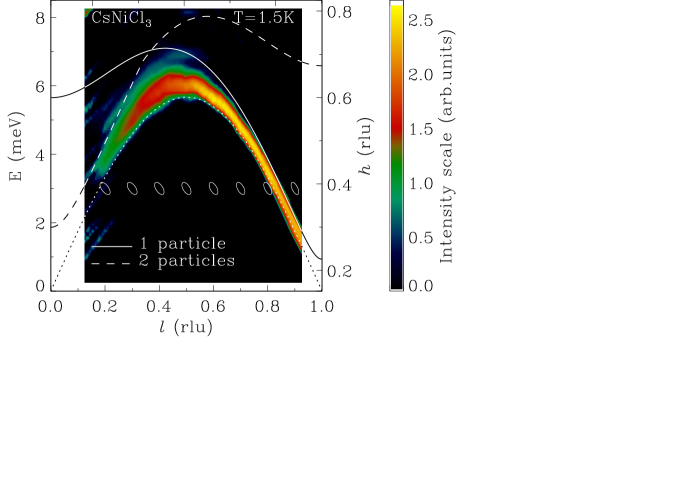
which for is in a very good agreement with MC [6]. In fact, the dispersion, measured by neutron scattering in the Haldane chain compound NENP [3], was found to coincide with (1) in a large part of the BZ, at , if the parameter is adjusted from [15] to . In this paper we use (1) to describe the 1D excitation spectrum in CsNiCl3 (solid lines in Fig.1,3). We find that it gives an excellent fit to the measured excitation energies, bringing an end to the existing controversy [4]. Using meV, independently determined from the high field magnetization [17], we obtain , in a remarkable agreement with the numerical result [11]. Most importantly, we find that spectral density deviates from the SMA at , and present the first resolved measurement of the continuum part of the excitation spectrum of a Haldane spin chain.
In spite of extensive theoretical evidence for existence of the continuum in the spectrum of a 1D HAFM, its limits and extent remain unclear and controversial, while its experimental characterization is considered practically impossible because of the rapid decrease of the static spin structure factor at small . This follows from the first moment sum rule [18], which establishes an exact relation between and the excitation average energy . For the 1D HAFM,
| (2) |
where [10] is the GS energy per site. For a gapful spectrum of (2) vanishes at . Where the SMA holds, is uniquely determined by the dispersion, . In addition, experimental characterization of the continuum is challenged if the excitation spectrum is split by the anisotropy, as in NENP and related Ni-organic model compounds, or if the excitations acquire a temperature-activated damping.
CsNiCl3 is one of the most isotropic and best studied quasi-1D HAFM model compounds (see [4, 5] and references therein). It has a hexagonal crystal structure, space group P63/mmc; at K the lattice spacings are Å, Å. Chains of Ni2+ ions run along the axis and form a triangular lattice in the plane. There are two equivalent ions per spacing, so that in reciprocal lattice units (rlu) corresponds to in the 1D BZ of a chain. A very reliable estimate for the in-chain exchange coupling, meV, is obtained from the measured spin-flip (saturation) field T [17]. A spin-flop (reorientation) field T implies a negligible single-ion anisotropy, .
We measured the dependence of the energy spectrum of the spin dynamic structure factor on the wavevector transfer along the chains for a CsNiCl3 sample made of two large crystals with total mass g, at K. The sample was mounted with the zone in the scattering plane, and had effective mosaic spread . To increase the data collection rate, the SPINS 3-axis cold neutron spectrometer at NIST Center for Neutron Research was equipped with a position sensitive detector (PSD), matched in size to the large PG(002) flat analysing crystal. The analyser’s central energy was fixed at meV; its angular acceptance was . Calibration of the neutron final energy and the sensitivity across the PSD was done using elastic incoherent scattering from Vanadium. Beam divergence was defined by the 58Ni neutron guide and a radial collimator in front of the PSD. To perform energy scans at constant , the wavevector transfer along was varied, so that chains were always aligned with the analyser [002] Bragg wavevector . Typical variation of , imposed by this condition, is illustrated by the right and top axes of Fig. 1, which shows the contour plot of the raw spectral density of the scattering intensity (), with the -dependent flat background subtracted. It is evident from Fig. 1, that the spectrum acquires a finite width in energy at . Although the effect is somewhat exaggerated by the resolution, careful accounting for the latter shows that intrinsic width, where it is non-zero, accounts for of the total width. Curves show the prediction of [15], obtained from (1) with meV, , and .
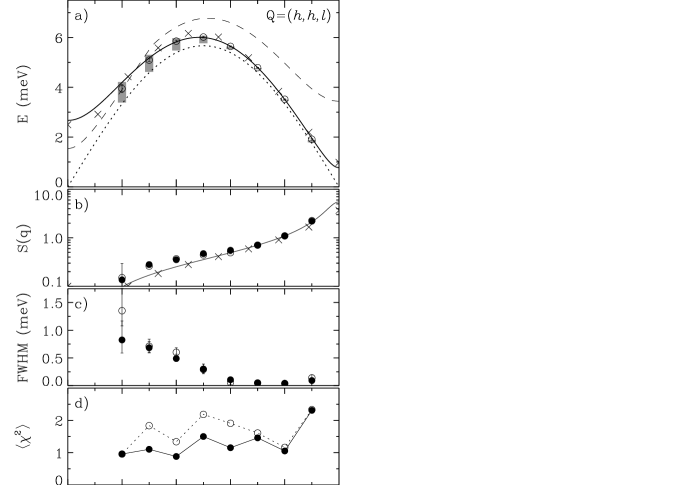
For the quantitative analysis of the energy dependence of the measured cross-section, we use the normalized scattering function of the damped harmonic oscillator (DHO), parametrized in terms of the position , and the full width at half maximum (FWHM) of the corresponding antisymmetrized Lorentzian peak [5]. Alternatively, to describe the asymmetric peak shape at lower , we use a ”half-Lorentzian” truncated DHO (TDHO), which is obtained by multiplying the above by . The TDHO fits to several constant- scans are shown in Fig. 2. As quantified by in Fig. 3(d), TDHO is in better agreement with experiment at , where a sharper onset of the scattering at low energies, characteristic of a continuum, is observed. Note, that an opposite asymmetry [3] would result from the interplay of the dispersion with the instrument resolution.
Peak parameters, refined for both DHO and TDHO fits, are detailed in Fig. 3. The dispersion of the center of mass of the excitation spectrum, captured by the position of the DHO peak (circles in Fig 1(a)), is nicely described by (1). For meV, the best fit, shown in the figure, gives , , and . While at the spectrum is not very sensitive to , the agreement of the magnon velocity with calculations [11] is impressive. The energy integrated intensity of both DHO and TDHO peaks, Fig. 3(b), is in good agreement with the sum rule (2). A slight deviation, concomitant with non-zero peak energy width (Fig. 3(c)), is due to the extra intensity in the unphysical high-energy tail, and can be completely removed by imposing an upper boundary on the continuum.
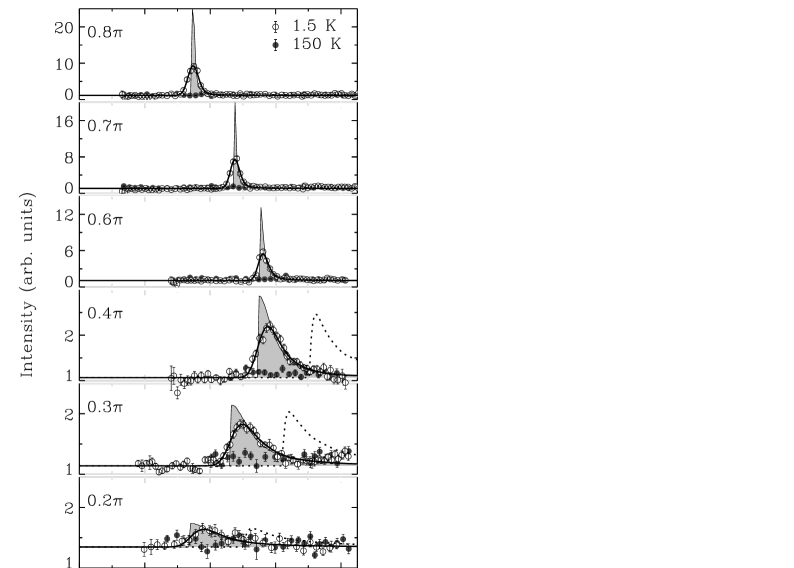
The peaks at , are very similar in shape and intensity to the two-magnon continuum, calculated for the 1D NLM [19], which correctly describes the HAFM chain in the vicinity of . We show the NLM prediction by dotted lines in Fig 2. Even though we used the realistic magnon dispersion (1), instead of the relativistic form , which fails for , the calculated continuum is still too high in energy. In fact, this discrepancy does not simply show the limitation of the -model, but also reveals the importance of magnon interactions. Indeed, a careful examination of Figs. 1, 3(a) shows, that the lower boundary of the observed continuum lies below the lowest energy of two non-interacting magnons. This could be understood, if there is an attraction between the quasiparticles, which form the continuum states.
To understand how our findings compare with existing results, it is important to realize that the extent of the observed continuum is rather small, as it should be, according to the calculations [19]. At , the FWHM is , or only of the peak energy, and requires high resolution and low temperature, , to be detected. Previous attempts to measure the in-chain dispersion in CsNiCl3 [4] were, on the contrary, done with rather coarse resolution of the thermal neutron spectrometer, and at , where temperature damping dominates the spectral width. It is more interesting to compare our data with the neutron scattering study in NENP [3], where the authors measured the dispersion for at , and found no appreciable deviation from the SMA. Consequently, a picture for the excitation spectrum of the 1D HAFM, where a single-mode dispersion merges into a broad, but unmeasurable, continuum at , became broadly popular [6, 10]. The results of [3] are, however, easily reconciled with our data, if we note that, to observe magnetic scattering at small , the authors had to relax the spectrometer resolution so much that almost a quarter of the 1D dispersion was within their wavevector acceptance. The effect we observe is simply unresolved in such a measurement. The splitting of the spectrum by single-ion anisotropy, which is rather large in NENP [16], presented another obstacle to the characterization of the continuum. A crossover to a continuum at is also supported by numerical calculations [7, 11, 16].
Finally, the main disadvantage of CsNiCl3 as a model 1D HAFM is the supercritical inter-chain coupling , which leads to a 3D order with the propagation vector , at K. The relevance of the Haldane conjecture in this situation was the subject of a long-lasting controversy. It was established that a gap opens in the spin excitation spectrum at , and in this so-called ”1D phase” it recovers the features of a Haldane chain. However, since , the spectra also acquire significant temperature broadening [5]. In fact, we argue that 3D order in CsNiCl3 is so weak, that even at it causes no significant change in the spectrum throughout the better part of the BZ. This agrees with the simple physical argument that excitations whose energies are sufficiently large compared to are not sensitive to it. Indeed, elastic Bragg intensity, corresponding to the ordered spin value , observed in experiment [20], accounts for only of the spin fluctuation spectrum. In the 1D HAFM this fraction of the spectral weight is concentrated in the tiny region of the BZ, at . Experiments also show, that the Haldane gap triplet mode is split in the 3D ordered phase only in the close vicinity of the magnetic Bragg peaks, at , where the Goldstone acoustic magnons appear [4, 5].
To quantify our arguments, we consider corrections to the of (2) for the ordered quasi-1D HAFM. The right-hand side is modified in three ways. First, the exchange energy of an individual chain changes on account
of the static order. In the mean field (MF) approximation, at , it increases by , which is less than , due to the large static staggered susceptibility of a Haldane chain [9, 21]. Second, the numerator has to be amended by adding the interchain correlation, , being the wavevector component, perpendicular to the chain. In MF this is , where is the Fourier transform of the interchain coupling, and can be neglected for . Finally, the interchain dispersion appears, which changes the magnon average energy in the denominator. In the random phase approximation (RPA), , where and are the magnon energy and the spin susceptibility for a single chain. From the boundaries of the interchain dispersion at , measured for CsNiCl3 in [4] at K, and using [3], we find . Plugging this value in the above estimates, we conclude, that the purely 1D expression for the static structure factor (2), and, by definition, the energy integrated scattering intensity, holds for CsNiCl3 within at , and within at .
Thus, our measurements present a detailed characterization of the non-hydrodynamic part of the excitation spectrum in the 1D HAFM. We find that single-mode dispersion gradually crosses over to a narrow continuum at . The continuum starts below the lowest possible energy of the two non-interacting magnons, indicating their attraction.
We gratefully acknowledge discussions with C. Broholm, L.-P. Regnault and A. Zheludev, which inspired us throughout this study. This work was carried out under Contract DE-AC02-98CH10886, Division of Materials Sciences, US Department of Energy. The work on SPINS was supported by NSF through DMR-9986442.
REFERENCES
- [1] F. D. M. Haldane, Phys. Lett. 93A, 464 (1993); Phys. Rev. Lett. 50, 1153 (1983).
- [2] J.-P. Renard et al , Europhys. Lett. 3, 949 (1987); L.-P. Regnault et al , Phys. Rev. B 50, 9174 (1994).
- [3] S. Ma, C. Broholm et al , Phys. Rev. Lett. 69, 3571 (1992); Phys. Rev. B 51, 3289 (1995).
- [4] W. J. L. Buyers et al , Phys. Rev. Lett. 56, 371 (1986); R. M. Morra et al , Phys. Rev. B 38, 543 (1988); Z. Tun et al , Phys. Rev. B 42, 4677 (1990).
- [5] M. Steiner et al , J. Appl. Phys. 61, 3953 (1987); I. A. Zaliznyak et al , Phys. Rev. B 50, 15824 (1994).
- [6] M. Takahashi, Phys. Rev. Lett. 62, 2313 (1989); Phys. Rev. B 48, 311 (1993); Phys. Rev. B 50, 3045 (1994).
- [7] S. V. Meshkov, Phys. Rev. B 48, 6167 (1993).
- [8] S. Yamamoto, Phys. Rev. Lett. 75, 3348 (1995).
- [9] O. Golinelli et al, Phys. Rev. B 46, 10854 (1992); J. Phys.: Condens. Matter 5, 1399 (1993); S. Haas et al, Phys. Rev. B 48, 3281 (1993).
- [10] S. R. White, Phys. Rev. Lett. 69, 2863 (1992); S. R. White, D. A. Huse, Phys. Rev. B 48, 3844 (1993).
- [11] E. S. Sorensen, I. Affleck, Phys. Rev. B 49, 13235, (1994); Phys. Rev. B 49, 15771 (1994).
- [12] H. Bethe, Z. Phys. 71, 205 (1931); L. Hulthén, Arkiv Mat. Astron. Fysik 26A, 1 (1938); J. des Cloiseaux, J. J. Pearson, Phys. Rev. B 128, 2131 (1962).
- [13] D. C. Dender et al , Phys. Rev. B 53, 2583 (1996).
- [14] P. Horton and I. Affleck, cond-mat/9907431.
- [15] G. Gómez-Santos, Phys. Rev. Lett. 63, 790 (1989).
- [16] L.-P. Regnault et al, J. Phys.: Condens. Matter 5, L677 (1993).
- [17] H. A. Katori et al, J. Phys. Soc. Jpn. 64, 3038 (1995).
- [18] P. C. Hohenberg, W. F. Brinkman, Phys. Rev. B 10, 128 (1974).
- [19] I. Affleck, R. A. Weston, Phys. Rev. B 45, 4667 (1992).
- [20] W. B. Yelon and D. Cox, Phys. Rev. B 7, 2024 (1972).
- [21] A. Zheludev et al, Phys. Rev. Lett. 80, 3630 (1998).