Cellular solid behaviour of liquid crystal colloids
1. Phase separation and morphology
Abstract
We study the phase ordering colloids suspended in a thermotropic nematic liquid crystal below the clearing point and the resulting aggregated structure. Small () PMMA particles are dispersed in a classical liquid crystal matrix, 5CB or MBBA. With the help of confocal microscopy we show that small colloid particles densely aggregate on thin interfaces surrounding large volumes of clean nematic liquid, thus forming an open cellular structure, with the characteristic size of inversely proportional to the colloid concentration. A simple theoretical model, based on the Landau mean-field treatment, is developed to describe the continuous phase separation and the mechanism of cellular structure formation.
pacs:
61.30.-vLiquid crystals. and 82.70.-yDisperse systems. and 64.74.+gSolubility, segregation and mixing; phase separation.1 Introduction
The phase separation and ordering of multi-phase systems, and their resulting physical properties, have been the subject of much active research over the past twenty years. Such a high interest in this field arises from a combination of challenging, fundamental physics (of phase equilibria and dynamics) with a large number of viable applications. Research in liquid crystals has also remained active for decades, for similar fundamental and practical reasons. However, the applications of thermotropic liquid crystals have always focussed on display technology, somewhat overlooking their unique mechanical properties. In the early 1990’s a new field, now called “liquid crystal colloids”, was opened to research by an experimental and theoretical study of suspensions of colloidal particles in a lyotropic liquid crystal by Poulin et al. roux . The key idea of introducing a large amount of mobile interface into the liquid crystal, which generates nontrivial topological constraints and singularities, has been fruitfully explored by further experimental and theoretical work coll95 ; luben ; rama ; interac .
The problem studied is that of a spherical particle with nematic director anchored on its surface, suspended in a nematic liquid crystal matrix. When the director is anchored rigidly, a closed inner surface creates a topological mismatch between the director field on the particle surface and the uniform director at large distances from it. This mismatch leads to topological defects, i.e. regions where the liquid crystal order and the continuity of break down. A connected closed surface represents a point topological charge . Since the overall sample has to be topologically neutral, the charge produced by the inner surface must be balanced by an associated opposite charge. There are two basic possibilities. The assumption, that a spherical particle in a quadrupolar nematic medium creates deformations that are quadrupolar too, results in the mismatch balanced by a circular loop of disclination with linear strength and overall point charge , in the equatorial plane of the particle: a “Saturn ring” ukra , see fig.1(a).
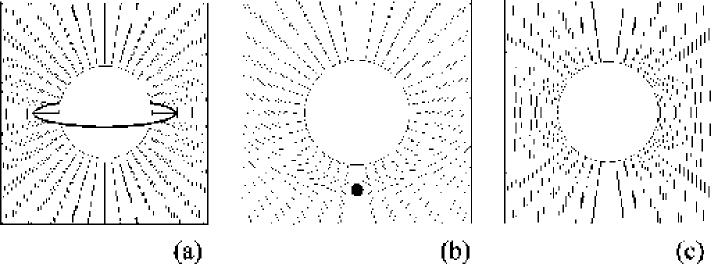
The other possibility is a dipolar configuration with a satellite point defect, a monopole with near one of the particle poles luben , see fig.1(b). It appears that, although both situations are possible, the dipolar structure with satellite defect occurs more readily, e.g. in experiments luben ; poulin98 for water droplets dispersed in a thermotropic nematic matrix. When several such droplets come to a near-contact, the effect of chaining occurs, with satellite defects sandwiched between inclusion particles and shared between them, providing a strong and anisotropic interaction force.
On the other hand, when the strength of director anchoring is rather weak, the particle introduces only a small perturbation into the nematic matrix, see fig.1(c). Albeit small, the non-uniform distortion of n is spreading over long distances from the particle – the exact solution for the angle of director deviation from the uniform axis can be obtained in terms of the multipole expansion and reads, e.g. ukra (in spherical polar coordinates),
| (1) |
In this expression, is the particle radius and the nematic constants and are the anchoring energy on its surface and the Frank elastic constant respectively degen . Their typical values in a thermotropic nematic liquid crystal are and , for homeotropic director anchoring as in fig.1.
The parameters in eq. (1) identify the important dimensionless ratio which controls the outcome of the single particle behaviour. measures the relative effect of the particle surface (characteristic energy ) and the bulk director deformations (Frank energy scale ), and can be large or small. When the anchoring should be considered weak and not capable of producing large deformations in the surrounding nematic matrix. In contrast, when rigid anchoring can be assumed and topological singularities result. For typical parameters, particles of m represent the border between the two topologically distinct regimes in fig.1: submicron colloid particles create small long range director distortions of quadrupolar symmetry, eq.(1), while larger objects most frequently have a dipolar configuration with a satellite defect.
The second physical idea relevant to our work is using the process of phase separation in a liquid crystal phase as a means of creating internal interfaces. The orientational symmetry breaking and the additional curvature elastic energy in the liquid crystal microconfined by such interfaces should have a profound effect on the whole process of phase ordering. Both phase equilibrium and kinetics are altered in non-trivial ways due to the underlying frustrated liquid crystalline order.
Although the progress in the single-particle description of liquid crystal colloids has been noticeable, little experimental work exists in this area of colloid collective behaviour. One of the main questions here is the macroscopic morphology of a colloid and the change in rheological behaviour on increasing concentration of particles, when the suspending matrix would possess a dense network of interaction forces creating high barriers to deformation. One may expect a glass-like freezing of motion at sufficiently high concentrations – an interesting possibility that needs to be thoroughly explored.
The work of Poulin et al. poulin98 on water droplets in a nematic matrix confirmed the ideas about topological defects and their long-range interactions – but they only studied the structure around a single or few very large droplets. In contrast, Tanaka et al. tanaka studied phase ordering in mixture of a nematic 5CB and a surfactant, which forms very small nano-micelles. They reported some provocative results on a phase they named “transparent nematic”. One could speculate that in this case the colloid parameter is so small that the mean-field description of nematic order would fail altogether. Recently, Zapotocky et al. martin examined the colloid rheology of a cholesteric liquid crystal filled with silica particles of size m. They have found a variety of rich behaviour due to topological defect-driven enhancement of dynamic elastic properties and the formation of a weak gel with the estimated static modulus of . However, in their work small silica particles have aggregated into much bigger objects (flocs) that produced strong topological forces and ended up in the nodes of a network of disclination lines, which has been carrying the elastic function of the resulting material.
A simpler system has been discovered recently by Meeker et al. wilson . A “classical” liquid crystal colloid has been prepared by mixing a well-characterised thermotropic nematic liquid crystal, 5CB, with sterically-stabilised PMMA particles, imposing radial boundary conditions in the nematic matrix. Mixtures of particle volume fraction resulted in a soft solid with significant storage modulus, . Such a remarkable mechanical transformation requires further investigation, which is reported in the companion paper no2 . Bright field microscope observations by Meeker et al. suggest that the soft solid comprises a network of particle aggregates, formed by the exclusion of particles from emergent nematic domains as the mixture is cooled below the isotropic-nematic transition . However, their optical observations were limited to low particle volume fractions , and depended on reheating the samples back into the isotropic phase to view the particle aggregate structure, since direct optical study in the bulk of a highly non-uniform birefringent system is difficult due to the strong scattering of light: the nematic colloids are opaque below . In this paper we use a confocal microscopy technique to study directly the structures in the bulk of the nematic liquid crystal colloid samples, for a wide range of particle concentrations .
In addition to the remarkable mechanical response, the second aspect of interest in this system is the time required for the formation of an aggregated state below . The characteristic time required for particle movement under the influence of long range attraction forces has been estimated in interac and gives, for our example of particle size and concentration in the limit of weak anchoring, (here Pa.s is the relevant viscosity coefficient of the nematic liquid crystal). We shall see that a rigid gel is formed in a much shorter time after the colloid mixture is brought below the nematic transition point . It appears that the phenomena observed in our liquid crystal colloid system cannot be purely due to the topological defects and their networks: their elastic energy is not enough to explain the modulus and, more importantly, there should be no topological defects at small .
Here we study the formation process of the resulting near-solid liquid crystal colloid aggregates in more detail. We show that a process of continuous phase separation of small particles takes place in our system. This separation occurs immediately after the nematic transition and results in the formation of a metastable but very long-lived rigid cellular structure of very thin interfaces, where the particles are densely packed, encapsulating large volumes of nearly pure nematic liquid. We develop a mean-field theoretical model describing the phase stability and the mechanism of cellular solid formation.
2 Sample preparation and experimental methods
In order to investigate the robustness of the process discovered by Meeker et al. wilson , we study two materials: 5CB and MBBA, both archetypical thermotropic nematics lcbase . The case of -pentyl--cyanobiphenyl, abbreviated as 5CB, obtained from Aldrich Chemicals Co., has already been examined in wilson . This pure material has a stable nematic phase below C, followed by a crystal phase at C. No crystallisation was observed down to C when the colloid particles were added.
In contrast, the MBBA (--methoxybenzylidene--butylaniline, from Aldrich), although one of the most common nematic materials in the literature, has a practical complication of being susceptible to hydrolysis. The bond in the rigid molecular section dissociates in the presence of water. The reaction is reversible, meaning that at a given temperature and humidity there is an equilibrium balance of proper MBBA compound and its hydrolysis products, which act as impurities and weaken the nematic order. The effect is most noticeable in the depression of the phase transition points: in the “dry” MBBA the nematic transition point is at C lcbase , followed by a crystal phase at C, while we have used MBBA in hydrolysis equilibrium at ambient conditions, with C and no crystallisation down to C. We employed this as a model for a “dirty”, weakly nematic liquid.
Theoretical arguments suggest that the best phase separation conditions are achieved for small colloid particles (the ones with , but not too small so that the reversal of this relation can occur near ), see section 4 below. We use monodisperse PMMA spheres (polymethylmetacrylate, bulk glass transition at C) of radius , with a polydispersity of about 0.04 (as determined by dynamic light scattering). Particles were covered with chemically grafted poly--hydroxystearic acid (PHSA) chains (prepared by Dr. A. Schofield in Edinburgh). On grafting, the short stabilising chains adopt a conformation radially extending from the grafting surface, making a “hairy” particle. In isotropic suspending liquids, these particles behave like almost ideal hard spheres. In addition, in the nematic suspending matrix, the grafted chains provide a homeotropic (radial) director anchoring with a typical strength . With the typical Frank constant this makes the dimensionless colloid parameter to take the value .
The preparation procedure described in wilson was followed. The liquid crystal was added to the dried particles at room temperature, i.e. while in the nematic phase (one does not expect good mixing in this situation). We then raise the temperature to well above and subject the sample to the ultrasonic excitation. In this way the particles were gradually dispersed in the isotropic phase of 5CB or MBBA; the samples were stored at C (above ) in a tumbling device to ensure that the mixtures were homogeneous before any experiment was started. The particle concentration has been measured by weight. Although the theoretical arguments require a proper (global average) volume fraction , we consider the two adequately close because the densities of PMMA and of nematic liquid are not very different. Differential scanning calorimetry (DSC, Perkin-Elmer Pyris 1) was used to identify the phase behaviour of the resulting mixtures.
For this work the major advantage of the confocal optical microscope is that it can produce a three-dimensional image of a relatively thick and optically inhomogeneous sample. Ordinary polarised microscopy, commonly used in studies of liquid crystals, does not produce results here because the aggregated colloid samples strongly scatter light – the samples are opaque. The employment of a pinhole to eliminate the out-of-focus light from planes above and below the focal plane in a confocal microscope produces a sharp picture of optical contrast in this plane. We use a Laser Scanning Confocal Microscope (LSCM 510, by K. Zeiss) in the reflection mode which does not require fluorescent labelling, illuminated by the monochromatic nm laser, without polarisers. In this mode, the images could be collected at a depth of up to m under the top sample surface.
3 Experimental results
3.1 Calorimetry
The starting point of practically any theoretical description of thermotropic nematic colloid phase behaviour, e.g. roux , is the assumption that the nematic transition temperature in the homogeneously mixed colloid is a linearly decreasing function of particle concentration . In fact, below we shall explicitly calculate the slope of this linear dependence: , eq. (3). Of course, such a linear variation means that the particles are regarded as fully independent, non-interacting – which cannot be true for high concentrations. Also, this estimate for is based on a value reversal of the colloid parameter near the transition. This requires a subtle balance of material constants. If remains large deep in the nematic phase, the particles will quickly aggregate under the action of strong attraction forces, see poulin98 ; martin . If remains small even near in spite of its tendency to grow as the nematic order parameter decreases (cf. section 4), the particles will not have a strong elastic energy around them and the system will behave more like a molecular mixture, a nematic with impurities – a well studied subject with a different phase morphology mixtures .
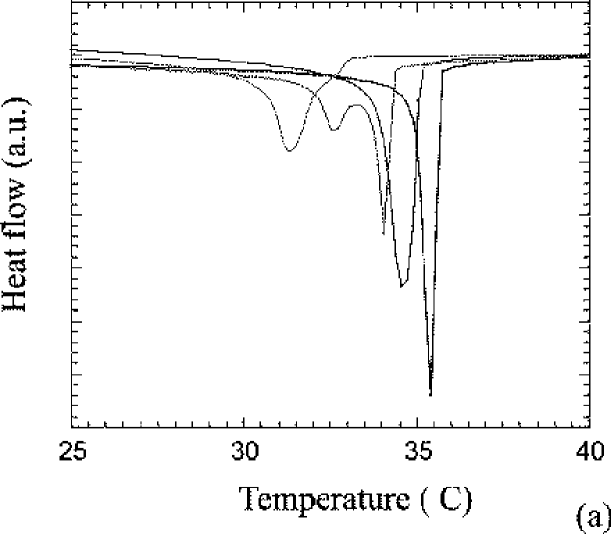
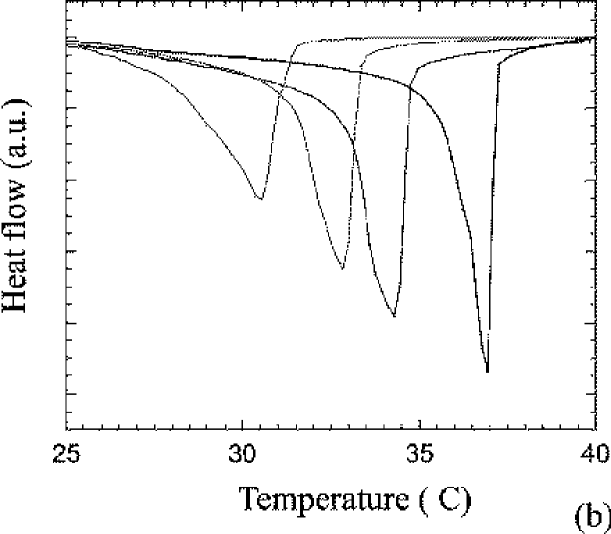
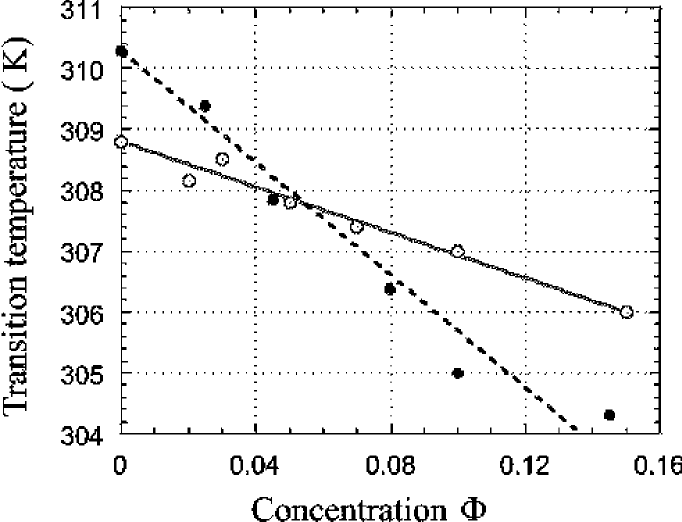
In order to determine the coupling energy between the nematic field and the individual colloid particle we study the isotropic-nematic phase transition on cooling from a homogeneously mixed state with a small particle volume fraction . The differential calorimetry shows an exothermal latent heat peak at this weakly first-order transition. Figure 2 shows the evolution of this peak on increasing the particle concentration, in 5CB and MBBA colloids. Two main features have to be noted. First, the dependence of (determined by the peak onset) on concentration shows a monotonic trend, fig. 3. The linear fits appear to be quite good, with the slope consistent with theoretical estimates of section 4. Secondly, one finds that the peaks become broader and of lower total area on increasing the particle concentration. This is not unexpected, the first order transition should become more and more diffuse with added impurities. In fact, there is a theoretical view aw ; cardy that such a transition should become continuous in equilibrium. We did not address this question in detail, which would have required significantly lower DSC cooling rates, at the very least.
3.2 Cellular structure
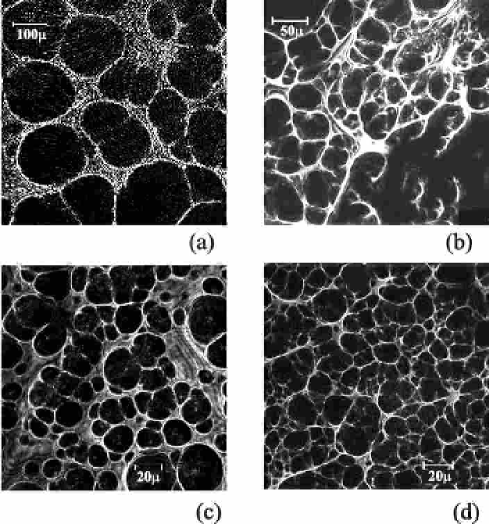
Here we present the confocal images of horizontal cross-sections of aggregated nematic colloids. The samples studied here were prepared by simply depositing a portion of isotropic homogeneous mixture (at C) on a slide and allowing it to cool to the room temperature, without top cover. The contrast mechanism between the nearly pure nematic regions and the densely aggregated PMMA particles is due to a different average refractive index in the reflection mode of the microscope.
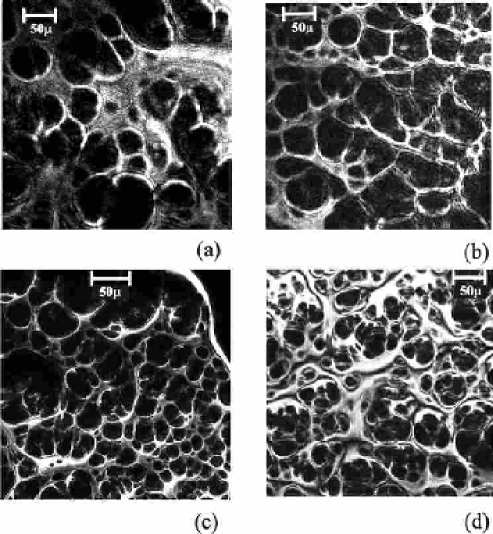
The cellular morphology of aggregated nematic colloids is apparent in fig. 4 for the 5CB system and in fig. 5 for the MBBA system. The relatively large cavities are separated by thin interfaces providing an optical contrast. The proportion of volume between these two fractions indicates that the cavities are filled with the nematic liquid (the majority phase) and the interfaces are made of PMMA particles.
The sizes of cells appear very irregular. One of the reasons is that the thickness of confocal imaging plane is much smaller than the cells and one obtains their different cross-sections. However, it is also clear that cells are very polydisperse both in size and in shape. One may argue that the way of sample preparation has caused the polydispersity: the relatively slow cooling under ambient conditions passes through the binodal regime of nucleation and growth in the phase diagram, see later (fig. 9), and would result in a variety of sizes of growing nematic nuclei. This should be contrasted with a rapid cooling deep into the spinodal decomposition regime, where a characteristic size is selected. We shall see later that samples cooled in the rheometer (at a rate of , with an additional small vibration aiding interface packing) have a significantly more regular cellular superstructure.
Another fact, evident in the confocal images, figs. 4 and 5, is that the cell walls are perforated. This is especially evident in the image (b) for the 7% colloid, where most of the walls are continuous in the cross-section, but some are clearly interrupted. This observation brings our system into the class of “open-cell” structures, cf. ashby . Figure 6 shows the microstructures of a free surface of aggregated cellular nematic colloid prepared in the ambient conditions. The difference with the internal cellular morphology is striking. Nevertheless, in spite of a much more regular surface, representing an effective cell wall meeting the outer interface, the perforations of the interface are evident.
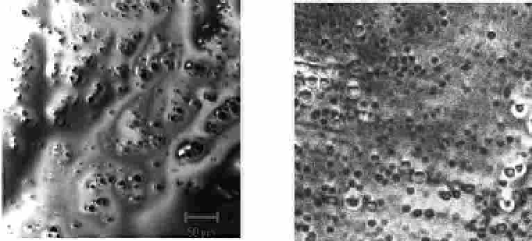
Image analysis, which should provide the statistical distribution of cell sizes, is difficult for the confocal scans of different cell cross-sections. Even if the cells were monodisperse, their areas crossing the focal plane would appear broadly distributed. Although there is a clear decrease in cell size with increasing particle concentration in fig. 4, the distribution is too irregular and asymmetric to allow accurate quantitative conclusions.
4 Theoretical model
First of all, let us re-iterate that the proposed regime of phase separation as a mechanism of particle aggregation in the nematic phase is taking place due to the smallness of the liquid crystal colloid parameter . In the opposite case, the study of which has been attempted several times over the years, the topological defects around particles result in strong interaction forces. If there are only few large particles in the system, they often form “strings” – chains of alternating spheres and topological defects luben ; poulin98 . When the particle concentration is finite, the colloid undergoes fast aggregation into 3-dimensional flocs. Big flocs with stronger relative anchoring (planar on silica surface, as in martin ) fall into the category of . An intermediate stage of evolution is the network of disclinations connecting the flocs and having an effective modulus . The topological defect network would eventually reach the global equilibrium by clearing the nematic volume altogether. (This final state is the eventual fate of all other metastable modes of aggregation, including our cellular solids).
We now return to the case of weak anchoring, , and consider the behaviour of a system of small particles near the nematic transition, where the amplitude of the nematic order parameter becomes small (the N-I transition is weakly first order, so that the latent heat and the jump of at the transition are small). Both relevant elastic parameters, the Frank constant and the anchoring energy vanish as , but with different rates: , while in the first approximation. Therefore, in the immediate vicinity of the ratio should become large and the topological regime of nematic director distortions around even very small particles may prevail. This would certainly be the case if a critical second-order transition occurred at . As it is, since never reaches zero, only a certain combination of material parameters would allow to change from small to large.111If remains small throughout the nematic phase, the elastic energy of deformations, ukra , has only a weak dependence on the nematic order parameter and results in long aggregation times. The elastic energy of these distortions is, near the N-I transition, . This makes an addition to the Landau free energy density describing the nematic transition, for local particle concentration it takes the form , with the particle volume, giving
| (2) |
Here the shift in the critical point is due to the elastic energy around the particles:
| (3) |
where the second, very approximate, equation uses the fact that the nematic correlation length is actually given by the ratio of parameters and , see Appendix. The experimental data in fig. 3 show that the slope of is indeed noticeable. The experimental estimate obtained from the linear fit is not wholly unreasonable, albeit slightly larger than one could expect for our particles and a typical correlation length .
4.1 Phase separation below
Immediately after the transition, the growing nematic nuclei start expelling the particles in the drive to reduce its thermodynamic free energy (2). The initial average particle volume fraction splits into locally different valuesin phase separating regions; we now use the notation for the local concentration. The equilibrium nematic order parameter of the mixed phase is
| (4) |
with the reduced temperature and the coefficient , using the data of fig. 3. Accordingly, the upper limit of stability of homogeneously mixed nematic phase is at the concentration
| (5) |
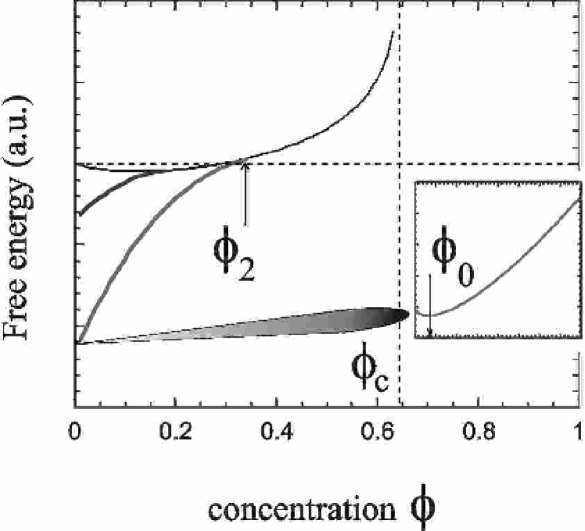
The equilibrium free energy density then becomes a function of local particle concentration , see eq. (4.1) below. The principal feature of this optimised free energy density of a nematic mean field is the rapid increase of with increasing particle concentration and the non-convex form of this dependence. This feature is the driving force for phase separation.
This energy penalty on having the particles uniformly dispersed in the nematic matrix has to be added to the free energy of mixing. The Carnaham-Starling excess free energy density of a hard-sphere suspension fluid is a very good approximation of the equation of state:
| (6) | |||||
where is the particle volume and the two expressions are matched by an adjustable parameter at a concentration , with the random close-packing fraction. The full free energy of nematic colloid, , then becomes, in dimensionless form,
at small concentrations (), where the dimensionless parameters and are estimated in Appendix, eq. (11). The factor in front of the nematic mean field energy measures the local proportion of the solvent in the colloid mixture.
This is the simplest possible model of nematic colloid phase ordering, essentially the same as used in roux , with minor deviations in the interpretation of nematic order-composition coupling and material constants. This interpretation, however, determines the results and predictions. All parameters entering the free energy will be determined from experiment, thus providing the phase diagram in the temperature-composition plane with no adjustable free parameters.
At low initial average particle volume fraction, the structure of eq. (4.1) is reminiscent of the Flory-Huggins model for demixing. The nematic mean-field energy plays the role of the effective -parameter potential term in that model, providing non-convex variation in . Figure 8 shows a series of plots of eq. (4.1) for the set of Landau parameters corresponding to 5CB nematic liquid crystal, eqs. (10) and (11) in Appendix. There is always a well-defined minimum at very small concentrations,
due to the entropy contribution in eq. (6). The usual common-tangent construction for the connects two branches of the free energy: one non-convex, at very low , in an almost pure liquid crystal, and the other fully convex, in the high- phase where the nematic order is unstable and the particles are densely compacted.
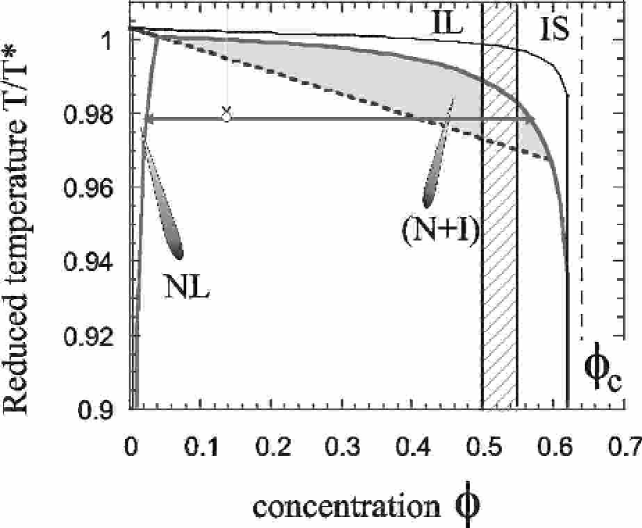
The schematic phase diagram of the nematic colloid is shown in fig. 9 in coordinates of reduced temperature and concentration . At high temperature the colloid behaves as a standard athermal hard-sphere system, which crystallises above and reaches the maximum random close-packing level at . At an extremely low particle concentration, corresponding to the expanded insert in fig. 8, there is a region of homogeneous nematic mixture, labelled NL in the phase diagram. This region is artificially expanded in fig. 9, the real numbers make it invisible in the plot. A very good analytical approximation for this phase boundary is
| (8) |
The spinodal on the high- branch is determined by the point of contact between the nematic (concave, locally unstable) and the isotropic (fully convex) parts of the free energy, which is marked as in fig. 8. Its analytical estimate,
is practically indistinguishable from the stability limit in eq. (5). This expresses the known fact about the “weakness” of first order nematic transition: the width of nematic coexistence is very small in ordinary thermotropic liquid crystals. Below the spinodal line the homogeneous particle mixture is unstable. Above this line, the shaded region in fig. 9 shows the zone of coexistence between the low- (nematic) and the high- (isotropic) phases. The upper boundary of this region, the high-concentration binodal line is calculated numerically from the common-tangent condition for in fig. 8, for the set of parameters given by eq. (11) (thin solid line) and the artificially scaled down nematic energy (bold solid line) to expose the critical point, where this binodal merges with the low- phase boundary .
Note that the high-concentration phase is in the state of colloidal solid. This is a consequence of very large relative strength of nematic mean field, expressed by the large dimensionless parameter in eq. (11). One may say that the effective pressure from the nematic liquid to expel the particles and compact them in high- regions is rather high.
A word of caution has to be sounded at this point, regarding the continuing usage of the linear law at relatively high particle concentrations. This approximation is not likely to be valid in the regime of high interparticle interactions and, therefore, the spinodal would deflect down from the straight line in fig. 9. We, however, are mostly interested in small particle concentrations where the approximation of independent particles would hold.
4.2 Cellular structure
We thus envisage the following mechanism of phase evolution of the nematic colloid on its cooling from the isotropic homogeneously mixed phase:
-
•
After quenching the homogeneous colloid suspension below the nematic transition point, the system phase separates into growing regions of pure nematic liquid, from which the particles are expelled into the boundaries.
-
•
On these interfaces of growing nematic nuclei, the concentration of particles is so high that the colloid solidifies and the remaining mesogenic liquid is in the isotropic state.
Clearly, the fine balance of kinetic effects is essential: the phase separation should have a higher rate to develop within growing nematic nuclei. The driving force for this process is the thermodynamic free energy gain in having the high nematic order in a clean system at a given , in comparison with the uniformly dispersed nematic colloid, which is expressed by non-convexity of plots in fig. 9.
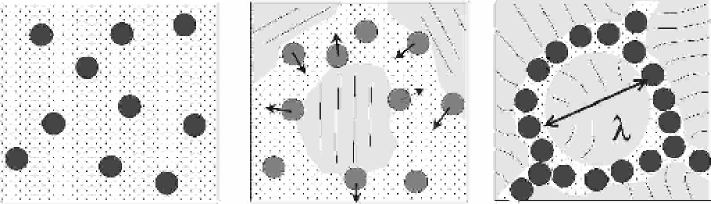
Eventually, when the clean nematic regions grow to come into the near-contact with each other, the particles are only allowed to pack on narrow interfaces. The sample transforms into a cellular superstructure with rather thin densely-packed walls encapsulating nematic volumes of characteristic size . This cell size is determined by the initial average colloid concentration and the thickness of interfaces. Let us define this thickness as , several times the particle radius (the smallest possible is in fig.10). Then the total area of such interface in the sample volume is . This leads to the order of magnitude estimate for the mesh size
| (9) |
This gives for this perhaps unrealistic case of , and and . The analysis of structures in the next section obtains , see fig. 7, i.e. interfaces of particles thick and for .
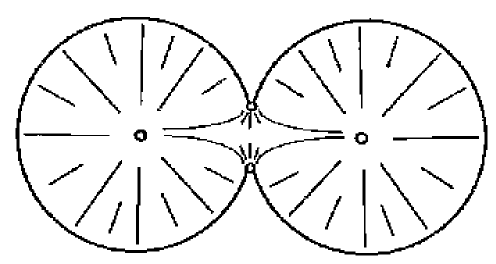
The cellular solid with thin high-tension interfaces is not the globally equilibrium state. It is obvious that the free energy can be further lowered by aggregating all particles into a 3-dimensional densely packed group, leaving the whole volume for the pure nematic liquid phase. However, the metastable cellular structure may become frozen, trapped by high energy barriers for disrupting the formed interfaces. Several mechanisms contribute to creating such barriers. Possibly the largest contribution arises from the nematic topological argument similar to that in liquid crystal emulsions emuls95 . Consider the nematic alignment in one cell, regarding the interface as a continuous wall imposing a homeotropic director anchoring energy . When the mesh size increases so that the familiar dimensionless parameter , the nematic liquid crystal within this cell has to possess the topological charge . When one attempts to break through the cell interface, two topologically charged volumes come into contact and their coalescence must comply with the law of this charge conservation. Therefore, in the moment of formation of a channel between the cells, a new topological defect of the charge must be created emuls95 . Later this defect may travel towards one of existing monopoles and annihilate it to minimise the elastic energy of the final joint volume. However, this cannot happen instantly and the formation of each new topological defect costs an elastic energy . This energy barrier can be very high: , compared with , and the system may remain trapped in the metastable state of random cellular structure. One then expects to find the effects of ageing and time translation invariance breaking, characteristic of weakly non-ergodic glassy dynamics and rheology bouchaud ; sollich .
5 Conclusions
We have reported the results of a structural study of nematic colloids based on a classical thermotropic liquid crystals matrix with small monodisperse polymer particles suspended in it wilson . The hydrophobic sterical stabilisation ensures the radial anchoring of the director on particle surface. At relatively small concentrations of particles, we observe good mixing above the clearing point of isotropic-nematic phase transition and a rapid aggregation of the homogeneous mixture into a rigid gel-like solid, completely opaque optically at and below . The properties of the phase ordering and the morphology of the phase-separated aggregates were the primary focus of this study.
On cooling from the homogeneous isotropic mixture, we observe a decrease in the transition temperature as a function of average colloid concentration , which follows a reasonably linear law in the region of small concentrations studied here. This is an expected and frequently observed phenomenon, accompanied by a noticeable diffusion of the weak first-order phase transition, which is otherwise sharp in a pure nematic liquid crystal.
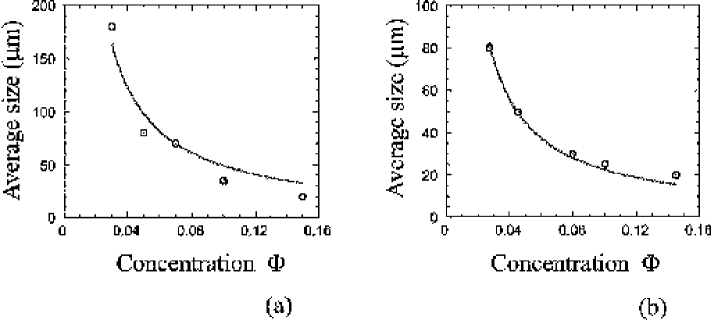
Below the colloids undergo phase separation with the resulting structure best described as an open cellular solid, with the particles densely packed in thin walls and the cavities filled with a pure liquid crystal. The characteristic cell size is of the order of m and appears to follow the inverse-proportionality law , also confirmed by a simple theoretical estimate. Since the nematic director is anchored on cell walls, the resulting randomly quenched birefringent texture strongly scatters light, giving the material its opaque appearance. The remarkable mechanical rigidity of the resulting cellular solids, stemming from the high effective surface tension of interfaces, is the subject of the companion paper no2 .
Colloid suspensions in nematic liquid crystal matrices, thermotropic and lyotropic, have been studied before. Particle aggregation is an unavoidable result in all cases, since the system below tends to minimise the elastic energy of director distortions around individual particles. However, the cellular solid morphology, first observed in wilson , is new. We believe that two main factors contribute to the reason why we obtain such an effect. The particles have to be small and have sufficiently low anchoring energy to ensure that the colloid parameter is small just below . On the other hand, our theoretical model suggests that this parameter has to become substantial again, to provide a required thermodynamic force for phase separation. This rather restricts a range of particle sizes and surface treatments that allow for such a compromise to occur. Secondly, we find that the rate of cooling through the first-order nematic transition has an important effect. The cellular structure is much more regular and robust when the homogeneous isotropic colloid is quenched rapidly deep below . The theoretical phase diagram suggests that in order to achieve a good selection of size one needs to avoid a binodal region just below . In many cases of slow-rate cooling and a colloid material parameters making the binodal gap wider (such as in our example of MBBA system), the mixture would separate in a different fashion – perhaps totally avoiding the cellular solid regime.
Although the details of aggregation mechanism and forces that hold
particles together at interfaces are somewhat unclear, the
suggested theoretical “toy model” offers a possible explanation
for the formation of cellular structure. Still, many questions
remain open. Such an unusual phase behaviour and remarkable
rheological properties of the liquid crystal colloid suspensions
require further detailed study, both theoretical and experimental.
We appreciate valuable discussions with M.E. Cates, S.M. Clarke, P.D. Olmsted and M. Warner. The help of I. Hopkinson with the confocal microscope is gratefully acknowledged. This research has been supported by the UK EPSRC.
Appendix:
Parameters of Landau free energy
It is useful to find the values of the three phenomenological parameters describing the transition, coefficients and in eq. (2), although different materials will have these parameters slightly different. It is nevertheless instructive to examine the characteristic orders of magnitude. In order to determine three parameters one needs three independent measurements. We are fortunate that there are, in fact, four available:
1) The jump of order parameter at the weak first-order transition is . There might be some error in its determination, which should depend (among other factors) on the rate of cooling through the transition. However, because only varies between and and because a number of molecular theories predict this jump explicitly, one can take qualitatively , giving .
2) The second measurement can be the interval between the transition temperature and the critical point (the latter may be determined by extrapolating the inverse susceptibility, ). In usual thermotropic nematic liquid crystals this interval is rather small, . This gives K. (Note that the dimensionality of and is energy density, while has the dimensions of ).
3) The latent heat of the first-order phase transition is , per unit volume. It is typically obtained from calorimetry by integrating the characteristic peak. Again, a large uncertainty may accompany such a measurement because at any non-zero cooling rate the conditions are not exactly equilibrium. However, keeping up the qualitative approach, the value of transition enthalpy per unit mass is of the order for 5CB at a reasonably slow cooling rate. Taking the density and the K, we obtain
| (10) | |||||
4) It is important that the three measurements above give estimates that agree with the fourth way of accessing . The nematic correlation length may be determined by the ratio of the bare Frank elastic constant to the thermodynamic energy density: . There are many ways of confirming that the characteristic magnitude of is . For usual values and we obtain , in a very reasonable agreement with the previous estimate.
Finally, we may estimate the dimensionless factors entering the final expression for the free energy (4.1). At K () and particle volume we obtain
| (11) |
References
- (1) P. Poulin, V.A. Raghunathan, P. Richetti and D. Roux, J. Physique II 4 (1994) 1557.
- (2) E.M. Terentjev, Phys. Rev. E 51 (1995) 1330.
- (3) P. Poulin, H. Stark, T.C. Lubensky and D.A. Weitz, Science 275 (1997) 1770.
- (4) S. Ramaswamy, R. Natyananda, V.A. Raghunathan and J. Prost, Mol. Cryst. Liq. Cryst. 288 (1996) 175.
- (5) R. Ruhwandl and E.M. Terentjev, Phys. Rev. E 55 (1997) 2958.
- (6) O.V. Kuksenok, R.W.Ruhwandl, S.V. Shiyanovskii, and E.M. Terentjev, Phys. Rev. E 54 (1996) 5198.
- (7) P. Poulin and D.A. Weitz, Phys. Rev. E 57 (1998) 626.
- (8) P.G. de Gennes and J. Prost, Physics of Liquid Crystals (Clarendon, Oxford, 1993).
- (9) H. Tanaka and J. Yamamoto, Nature to be published (2000)
- (10) M. Zapotocky, L. Ramos, P. Poulin, T.C. Lubensky and D. Weitz, Science 283 (1999) 209.
- (11) S.P. Meeker, W.C.K. Poon, J. Crain and E. Terentjev, Phys. Rev. E (2000) accepted.
- (12) V.J. Anderson, E.M. Terentjev and A.N. Other, the companion paper on Mechanical Properties.
- (13) D. Demus, Handbook of Liquid Crystals (Wiley-VCH, Weinheim, 1998).
- (14) P.K. Mukherjee, Liq. Cryst. 22 (1997) 239.
- (15) M. Aizenman and J. Wehr, Phys. Rev. Lett. 62 (1989) 2503.
- (16) J. Cardy, J. Phys. A - Math. Gen. 29 (1996) 1897.
- (17) M.F. Ashby and L.J. Gibson, The mechanical properties of cellular solids (Cambridge University Press, 1983).
- (18) N.F. Carnaham and K.E. Starling, J. Chem. Phys. 51 (1969) 635.
- (19) E.M. Terentjev, Europhys. Lett. 32 (1995) 607.
- (20) J.P. Bouchaud, L.F. Cugliandolo, J. Kurchan and M. Mézard, in: Spin Glasses and Random Fields, Y.P. Young ed. (World Scientific, Singapore, 1998).
- (21) P. Sollich, F. Lequeux, P. Hébraud and M.E. Cates, Phys. Rev. Lett. 78 (1997) 2020.