Thermal conductivity of Mg-doped CuGeO3 at very low temperatures: Heat conduction by antiferromagnetic magnons
Abstract
Thermal conductivity is measured at very low temperatures down to 0.28 K for pure and Mg-doped CuGeO3 single crystals. The doped samples carry larger amount of heat than the pure sample at the lowest temperature. This is because antiferromagnetic magnons appear in the doped samples and are responsible for the additional heat conductivity, while of the pure sample represents phonon conductivity at such low temperatures. The maximum energy of the magnon is estimated to be much lower than the spin-Peierls-gap energy. The result presents the first example that at very low temperatures probes the magnon transport in disorder-induced antiferromagnetic phase of spin-gap systems.
pacs:
PACS numbers: 66.70.+f, 75.30.Kz, 75.50.EeRecently, impurity-substitution effect on the spin-singlet ground state has been intensively studied in a variety of low-dimensional spin systems, and the results indicate that only a slight substitution of non-magnetic impurity essentially changes the ground state. When the disorder is introduced by the non-magnetic impurity, antiferromagnetic (AF) ordering immediately appears without destroying the spin-gap feature, commonly in a spin-Peierls (SP) compound CuGeO3, [2, 3, 4, 5, 6] a ladder compound SrCu2O3,[7] and a newly found Haldane system PbNi2V2O8.[8, 9] Since it was believed that spin-singlet state and antiferromagnetism are mutually exclusive, the case of CuGeO3, in which both the remaining SP ordering and the AF ordering developing with impurity-doping turned out to be long-range order,[4] is remarkable. Fukuyama et al. proposed a theoretical model for this anomalous phase, i.e., dimerized antiferromagnetic (D-AF) phase.[10] In their model, staggered AF moments and lattice dimerization are spatially modulated, keeping the AF and SP long-range correlations; degree of the lattice dimerization is larger in between the impurity sites than around the impurity sites and magnitude of the staggered moments are larger near the impurity sites.
Even though the coexistence of the two long-range orders are established in lightly-doped CuGeO3, it is to be elucidated how low-energy spin excitations of SP state, which holds spin gap, and those of AF state, which is gapless in isotropic systems, compromise with each other in D-AF phase. Recently, Saito and Fukuyama extended the theory of Ref. [10] and predicted that a “slow” gapless AF-magnon branch shows up in addition to the gapped SP mode when impurity is doped.[11] They predicted that the energy scale of the magnon branch is smaller than the SP gap ( 24 K). Existence of this in-gap magnon branch is observed by neutron scattering for rather highly substituted samples. [12, 13, 14] (Zn concentration was 3.2% for the sample used in Ref. [12], for example). However, since recent study using high-quality Mg-doped single crystals, in which impurities distribute more homogeneously than in Zn-doped systems, has revealed disorder-induced first-order transition around the Mg concentration of ,[15] only below which the long-range SP ordering is established, [16] it is essential to examine the magnetic excitations of samples with impurity concentration less than . In this work, we have measured thermal conductivity at very low temperatures, using lightly Mg-doped samples. The samples are cooled down to 3He temperatures, in order to study the low-lying excitations. The thermal conductivity of the doped samples exceeds that of the pure sample at the lowest temperature. We will show that the in-gap magnons, which is intrinsic to D-AF phase, indeed exist and are responsible for the excess low-temperature heat transport in the doped samples.
The Cu1-xMgxGeO3 single crystals were grown with a floating-zone method. The Mg-concentration is determined by inductively coupled plasma-atomic emission spectroscopy (ICP-AES).[15, 16] For the thermal conductivity measurement, we use pure, , and samples, all of which were already well characterized using dc susceptibility and synchrotron x-ray diffraction measurements. [15, 16, 17] The transition temperatures are shown in Table I for each sample. SP long-range order is observed at as a resolution limited FWHM of the x-ray Bragg peak from lattice dimerization. The Néel temperature is determined by the magnetic susceptibility.[16]
Thermal conductivity is measured down to 0.28 K with 3He refrigerator using “one heater, two thermometers” technique. Gold wires, which are tightly connected with
| Sample | [K] | [K] | [mm] | [m/s] | |
|---|---|---|---|---|---|
| A | 0 | 14.5 | 0.17 | ||
| B | 0.016 | 10.5 | 2.5 | 0.17 | 70 |
| C | 0.016 | 10.5 | 2.5 | 0.24 | 70 |
| D | 0.0216 | 8.5 | 3 | 0.10 | 140 |
a microchip heater and two calibrated RuO sensors, are attached on the samples by GE-varnish. Temperature difference between the two thermometers are typically 3% of the sample temperature. Since we will discuss the thermal conductivity in the low-temperature limit (Casimir’s limit),[18, 19] where heat carriers are scattered dominantly by crystalline boundaries, we paid special attention both to the sample size and to the smoothness of the boundaries. Typical dimension along the -axis is around 3 mm and thermal gradient is applied along the axis. As shown in Table I, the geometrical mean widths (square root of the cross section), which is proportional to the mean free path in the Casimir’s limit, [18] of the pure sample (Sample A) and one of the samples (Sample B) are set identical for direct comparison in . The smooth boundaries of the crystal is achieved by cleaving for the b-c surfaces and by cutting with a sharp razor blade for the a-c surfaces. Also, we have measured specific heat , in order to derive the mobility of the relevant heat carriers. The specific heat measurement is carried out down to 0.4 K with the commercial PPMS (Quantum Design) heat-capacity probe, using a relaxation method. The mass of the samples is typically 3 mg. The samples used for the specific heat and the thermal conductivity measurements are cut from the same piece of the crystals.
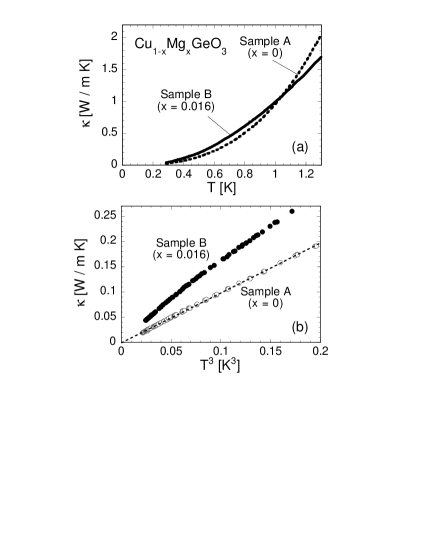
Figure 1(a) shows temperature dependence of for Samples A and B below 1.3 K. In Fig. 1(b), in the temperature range below 0.58 K ( K3) is plotted as a function of . of the pure sample rapidly decreases with decreasing temperature and becomes proportional to below 0.58 K. At 1.3 K, of the sample is smaller than that of the pure sample, so that our previous results in higher temperature range are reproduced. [20] It is natural that is suppressed in the presence of impurities owing to the scattering by disorders. However, of the sample exceeds that of the pure sample below 1 K down to the lowest temperature, which is not explained by the above simple picture.
First, let us discuss of the pure sample. Magnetic excitations are negligible in the pure sample below 1.3 K, because the spin-gap energy of CuGeO3 is more than one order of magnitude larger than the temperatures.[21] Therefore, the heat is dominantly carried by phonons there. Assuming kinetic approximation, the phonon thermal conductivity is written as
| (1) |
where is specific heat, is velocity and is mean free path of the phonons. Since also depends on temperature as at such low temperatures, should be independent of temperature below 0.58 K. This result means that the phonon conductivity reaches the Casimir limit, where the mean free path is determined simply by the dimension of the crystal. [18, 19, 22] For a rectangular-shaped crystal is given as
| (2) |
assumimg isotropic phonons. [23] We have measured the specific heat independently and examined the validity of Eqs. (1) and (2). First, is calculated from and data by Eqs. (1) and (2), as 1600 m/s. [24] On the other hand, can be estimated only from the low-temperature data, assuming the Debye model. Thus obtained value of is 1800 m/s, which is in good agreement with the estimation from the data. The result shows that the relation of Eqs. (1) and (2) is satisfied at the temperatures shown in Fig. 1(b) for the crystal used.
Noting that phonon conductivity governed by the boundary scattering gives the maximum value of (any additional scattering would suppress the conductivity), we can notice that of Sample B cannot exceed of Sample A in Fig. 1(b), using Eqs. (1) and (2), because of Sample A and B is identical (Table I) and little dependence is expected for and . Therefore, the result of the excess in Sample B requires an additional excitations which can carry heat at low temperatures down to 0.28 K in the Mg-doped sample. Considering the AF ordering in the impurity-doped CuGeO3, it is most likely that antiferromagnetic magnons are responsible for this excess low-temperature heat conductivity in the Mg-doped sample.
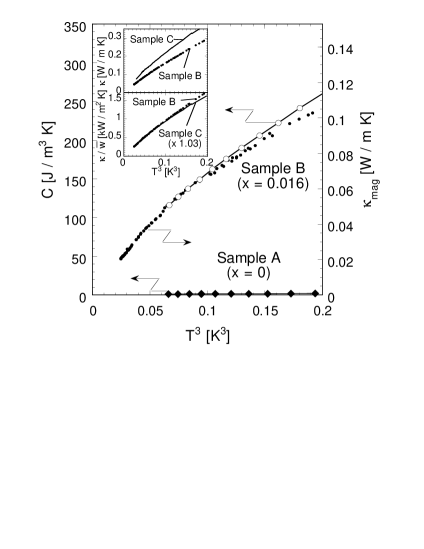
In order to examine whether the Mg-doped sample also satisfies the Casimir’s condition, under which more quantitative discussion is possible, we compare low-temperature of Sample B and that of another sample with different (Sample C). The upper inset of Fig. 2 shows that the values of are different between Samples B and C. On the other hand, as shown in the lower inset, the low-temperature data ( K) of the two samples show only 3% difference, which is mainly due to the error in determining the distance between the gold wires connected to the thermometers. Since the result means that differs in proportion to at low temperatures, it is strongly suggested that the Casimir’s condition is satisfied for both samples and that both and the magnon heat transport are governed by the boundary scattering there, i.e.,
| (3) |
[ () is a factor due to the anisotropy of the magnon velocity [19] and is the magnon velocity in the -th-axis direction).
Assuming Eq. (3), we can crudely estimate with the value of obtained by the independent specific-heat measurement and examine whether the magnon branch is in the SP gap. The specific heat of Samples A and B is shown in Fig. 2 as a function of in the temperature range below 0.58 K3 ( K). Since of the pure sample (diamonds in Fig. 2), which represents in this temperature region, is more than one order of magnitude smaller than that of the Mg-doped samples, we can neglect and assume for the doped sample. of the sample is estimated by subtracting of the pure sample and is plotted together in Fig. 2. The data show exactly the same temperature dependence as the data below 0.46 K ( K), indicating again that Eq. (3) is satisfied in this temperature range. Assuming and ,[25] is estimated approximately to be 70 m/s from Eq. (3). The AF-magnon energy is lower than meV [ () is the wave number at the center of the Brillouin zone and ( Å) is the distance between adjacent Cu atoms along the Cu-O chain]. Since this value is two orders of magnitude lower than the SP gap ( meV), we can conclude that the additional heat transport observed in the Mg-doped CuGeO3 is due to the in-gap AF-magnons. [26]

The magnon velocity can be estimated also for the sample (Sample D) in the same manner. In order to subtract , it is convenient to compare of Sample D to that of Sample A, which represents the phonon contribution. of Samples A and D is plotted against in Fig. 3(a). of Sample D is larger than that of the pure sample. The difference corresponds to the magnon contribution of Sample D. In Fig. 3(b), and independently obtained data are plotted together. Following the same discussion as that for the sample, is estimated approximately to be 140 m/s. The upper limit of the magnon energy is meV, which is twice as high as that of the sample but is still much lower than the .
The velocity of AF-magnon for the usual uniform Néel state is given by ,[27] where is a factor of order unity, is the interaction energy and is the spin in each magnetic site. Even when quantum fluctuations, which diminish the effective value of to 0.2 times smaller,[28] is taken into account, the magnon velocity of as fast as 1000 m/s is expected, (assuming K).[25] Since we obtained much smaller , it is shown that effective is significantly suppressed owing to the SP ordering. In the model of Refs. [10] and [11], the staggered moment is strongly suppressed in between the impurity sites. As the result, a sort of spatially “averaged” spin, which is directly proportional to the magnon velocity, becomes much smaller than 1/2. Our crude estimation from the low-temperature gives of the sample approximately twice as large as that of the sample, indicating that rapidly increases with . Such dependence is consistent with the calculation in Ref. [11]. Note that of around 1300 m/s can be estimated for the Zn-3.2%-doped sample from the neutron data, [12] which is nearly one order of magnitude larger than the value estimated for our sample.
It should be emphasized that the mean free path of the AF-magnon in the SP gap reaches as long as 18 m, according to Eq. (3), i.e., the magnons are mobile to a distance 60,000 times longer than the spin-distance () without being scattered. Such coherent motion of the magnons is only possible with extremely long correlation length of the corresponding magnetic order.[29] Therefore, the mixture of SP and AF ordering in the doped CuGeO3 is certainly a true long-range order.
In summary, we have measured thermal conductivity of pure and Mg-doped CuGeO3 single crystals at very low temperatures, in order to examine the anomalous low-temperature phase in the impurity-doped CuGeO3, where SP and AF order coexists. While the low-temperature thermal conductivity is dominated by in the pure CuGeO3, magnons also carry considerable amount of heat in the Mg-doped samples. Estimating the magnon velocity, we have shown that the AF-magnons are present in the SP gap, as predicted by Saito and Fukuyama. It is demonstrated that thermal conductivity is a powerful tool in elucidating the low-energy magnetic excitations in the disorder-induced AF phase of spin-gap systems. Our next step is to examine the excitations in the uniform AF phase in highly substituted CuGeO3, and to seek differences from that of D-AF phase.
We acknowledge H. Fukuyama, who first suggested this experiment. We also thank M. Saito, M. Nishi and M. Ishikawa for helpful discussions. The work done at the University of Tokyo is supported in part by the Grant-in-Aid for COE Research of the Ministry of Education, Science, Sports, and Culture.
REFERENCES
- [1]
- [2] M. Hase, N. Koide, K. Manabe, Y. Sasago, K. Uchinokura, and A. Sawa, Physica (Amsterdam) 215B, 164 (1995).
- [3] S. B. Oseroff, S.-W. Cheong, B. Aktas, M. F. Hundley, Z. Fisk, and L. W. Rupp, Jr., Phys. Rev. Lett. 74, 1450 (1995).
- [4] L.-P. Regnault, J. P. Renard, G. Dhalenne, and A. Revcolevschi, Europhys. Lett. 32, 579 (1995).
- [5] Y. Sasago, N. Koide, K. Uchinokura, M. C. Martin, M. Hase, K. Hirota, and G. Shirane, Phys. Rev. B 54, R6835 (1996).
- [6] K. Manabe, H. Ishimoto, N. Koide, Y. Sasago, and K. Uchinokura, Phys. Rev. B 58, R575 (1998).
- [7] M. Azuma, Y. Fujishiro, M. Takano, M. Nohara, and H. Takagi, Phys. Rev. B 55, R8658 (1997).
- [8] Y. Uchiyama, Y. Sasago, I. Tsukada, K. Uchinokura, A. Zheludev, T. Hayashi, N. Miura, and P. Böni, Phys. Rev. Lett. 83, 632 (1999).
- [9] K. Uchinokura, Y. Uchiyama, Y. Sasago, I. Tsukada, A. Zheludev, T. Hayashi, N. Miura, and P. Böni, to be published in Physica B, proceedings of LT22, Espoo, Finland, August, 1999.
- [10] H. Fukuyama, T. Tanimoto, and M. Saito, J. Phys. Soc. Jpn. 65, 1182 (1996).
- [11] M. Saito and H. Fukuyama, J. Phys. Soc. Jpn. 66, 3259 (1997).
- [12] M. C. Martin, M. Hase, K. Hirota, G. Shirane, Y. Sasago, N. Koide, and K. Uchinokura, Phys. Rev. B 56, 3173 (1997).
- [13] K. Hirota, M. Hase, J. Akimitsu, T. Masuda, K. Uchinokura, and G. Shirane, J. Phys. Soc. Jpn. 67, 645 (1998).
- [14] P. M. Gehring, S-H. Lee, K. Hirota, T. Masuda, K. Uchinokura, M. Hase, and G. Shirane, J. Phys. Soc. Jpn. 69, 592 (2000).
- [15] T. Masuda, A. Fujioka, Y. Uchiyama, I. Tsukada, and K. Uchinokura, Phys. Rev. Lett. 80, 4566 (1998).
- [16] T. Masuda, I. Tsukada, K. Uchinokura, Y. J. Wang, and V. Kiryukhin, and R. J. Birgeneau, Phys. Rev. B, 61, 4103 (2000).
- [17] Y. J. Wang, V. Kiryukhin, R. J. Birgeneau, T. Masuda, I. Tsukada, and K. Uchinokura, Phys. Rev. Lett. 83, 1676 (1999).
- [18] H. B. G. Casimir, Physica 5, 495 (1938).
- [19] R. Berman, Thermal Conduction in Solids (Oxford University Press, Oxford, 1976), p. 61.
- [20] J. Takeya, I. Tsukada, Y. Ando, T. Masuda, and K. Uchinokura, Phys. Rev. B, in press, cond-mat/9905228.
- [21] In Ref. [6], considerable magnetic susceptibility is observed below 1 K, because of incoherent magnetic excitations due to residual impurities and/or defects. However, such incoherent excitations do not contribute to heat transport. Also, magnetic specific heat is negligibly small, as will be shown later (Fig. 2).
- [22] Defect scattering would give -dependence of the mean free path. Since scattering rate of the defect scattering decreases with temperature, it will exceed of the boundary scattering at the low- limit, so that the Casimir’s condition is satisfied. See Ref. [19], p. 73, for example.
- [23] P. D. Thacher, Phys. Rev. 156, 975 (1967).
- [24] It is reported that ultrasonic-sound velocity of CuGeO3 measured by a time-of-flight method is around 4100 m/s [M. Poirrier, M. Castonguay, A. Revcolevschi, and G. Dhalenne, Phys. Rev. B 51, R6147 (1995), for example]. The discrepancy of 2.5-times in magnitude may be because time-of-flight methods measure the velocity of the fastest phonon-mode, while measures averaged velocity.
- [25] M. Nishi, O. Fujita, and J. Akimitsu, Phys. Rev. B 50, R6508 (1994).
- [26] Although an anisotropy gap of around 1 K is reported for a Zn-3%-doped sample,[12] the large magnetic specific heat observed at least down to 0.4 K (Fig. 2) indicates that is suppressed in the lightly doped samples to a value comparable to or smaller than the lowest temperature of our measurement. It is reported for Si-doped samples that increases with .[13, 14]
- [27] C. Kittel, Quantum Theory of Solids (John Wiley and Sons, New York, 1963), for example.
- [28] M. Hase, K. Uchinokura, R. J. Birgeneau, K. Hirota, and G. Shirane, J. Phys. Soc. Jpn. 65, 273 (1996).
- [29] B. I. Halperin and P. C. Hohenberg, Phys. Rev. 177, 952 (1969).