[
Electric field induced memory and aging effects in pure solid N2
Abstract
We report combined high sensitivity dielectric constant and heat capacity measurements of pure solid N2 in the presence of a small external ac electric field in the audio frequency range. We have observed strong field induced aging and memory effects which show that field cooled samples may be prepared in a variety of metastable states leading to a free energy landscape with experimentally “tunable” barriers, and tunneling between these states may occur within laboratory time scales.
pacs:
64.60.Cn, 67.00, 77.22.-d]
The interplay of geometric frustration and strong ferromagnetic as well as antiferromagnetic interactions in magnetic systems such as Gd3Ga5O12, Y2Mo2O7, Ho2Ti2O7 and SrCr9pGa12-9pO19 with have been the subject of intense interest [1, 2, 3, 4, 5]. In these systems, frustration is caused by competition between nearest neighbor exchange interaction which leads to macroscopic degeneracies and can lead to a variety of new phenomena at low temperatures including spin glasses, spin liquids and magnetic analogs of ice. However, a good understanding of these systems is hindered by the fact that these systems are highly complicated, and the interactions are often complex. In the present work we show that there exists a simple electrical analog of such systems, namely pure solid N2, where the lattice geometry at temperatures above is incompatible with the symmetry of the interactions and the resulting geometrical frustration destroys the long range orientational order favored by the electric quadrupolar interactions between molecules. There are several unique features that make solid N2 an ideal system to study the interplay of geometric frustration and interactions: (i) It is a simple system with well understood molecular interactions [6, 7]. (ii) Solid N2 undergoes structural transition from to at which significantly lowers the geometric frustration; this gives us the unique opportunity to study the effects of geometric frustration by comparing the system in the two geometries. (iii) As we will show in the present work, but unsuspected previously, the system can be manipulated to become trapped in a variety of metastable states by cooling it in a small ac electric field in the audio frequency range. (iv) The time scale involved for the system to tunnel between these trapped macroscopic states can be several hours (short compared to silicate glasses), which allows for the possibility of studying the nonequilibrium behavior including aging effects in the laboratory[8, 9]. (v) It is easy to increase the disorder by small amounts at a time by replacing some of the quadrupolar N2 molecules by spherical Ar atoms [6, 7]. This allows one to explore the interplay of disorder and frustration along with interactions; these studies will be reported elsewhere.
It is generally believed that the orientational ordering in N2 is nucleated at a temperature above 36 K although no experiment has indicated the temperature at which this ordering begins [7]. The high temperature or -phase does not support long range orientational order but there can still be some short range local ordering. In this phase, N2 is known to show hindered rotation due to the incompatibility between the lattice and the molecular sizes resulting in a complex free energy landscape. Recently we showed that the dielectric constant () of pure solid N2 exhibited unexpected hysteresis in in the audio frequency range whenever the sample is heated above an onset temperature 42 K, in the presence of the bias electric field [10, 11]. However, the significance of the small external ac field was not obvious. In this paper we present systematic dielectric as well as high sensitivity heat capacity data for samples that are cooled either in the presence or absence of an external ac electric field. These results show that when field-cooled in a small ac field in the audio frequency range, solid N2 shows remarkable glass-like memory and aging effects which are readily observable within the laboratory time scales. In contrast, the zero-field cooled samples do not show these effects.
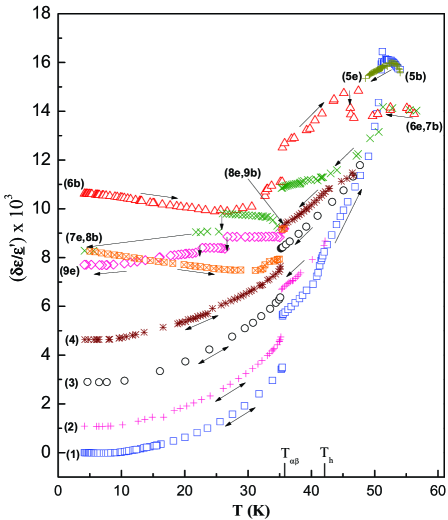
The dielectric measurements were carried out using a three terminal ac capacitance bridge having a sensitivity of two parts per billion [12]. The high sensitivity heat capacity measurements were carried out using an advanced dual-slope method [13]. Figure 1 shows the relative change in in 4.2-55 K range (melting temperature is 63 K). Curve (1), taken from ref. REFERENCES, shows the zero-field cooled result. The (lower) family of curves (2-4) show when the sample is cooled in the presence of a bias field of 5 kV/m at 1kHz, after warming up to K. The difference in these curves is mainly due to the final temperature () in the above range from which the sample is cooled. As reported previously [10, 11], once cooled down along any one of these curves, thermal cycles are completely reversible along the same curve as long as the highest temperature remains below . The onset of strong hysteresis upon warming above was noted in ref. REFERENCES, but the significance of the field-cooling was not appreciated. In the (upper) family of curves (5-9), we show the results when the sample temperature is raised to K, annealed at K (for 10 to 12 h.), and then field-cooled in the presence of the above bias field. The increases sharply, reaching a maximum at K, and then decreases slowly. When cooled from this temperature, the warm-up and cool-down curves are no longer similar even in the -phase and are very different from the zero-field cooled (curve (1)) or other lower family of reversible curves (2-4). For K, the decreases linearly with during warm-up cycle, while it increases linearly with during cool-down cycle. Also, we have observed spontaneous change in at various temperatures indicated by in Fig. 1. We note that the spontaneous changes in occur at apparently random temperatures and these are present in both the as well as the -phases but only during the cool-down cycle. Thus the field cooled sample becomes trapped in metastable configurations and the free energy barriers vary from very large for the lower family of curves to sufficiently small for the upper family of curves to allow random tunneling to lower states. Remarkably, the value of is the same for all curves to within 0.1 K although the change in at can be different. If the system is left isolated with the external field turned off and annealed above for several hours and then cooled, retraces the lowest curve in Fig. 1, independent of the sample history. This shows that the sample can be brought back to its original state by appropriate annealing, and that the memory and aging effects are induced by cooling in the small ac field, and not due to lattice dislocations or other defects.
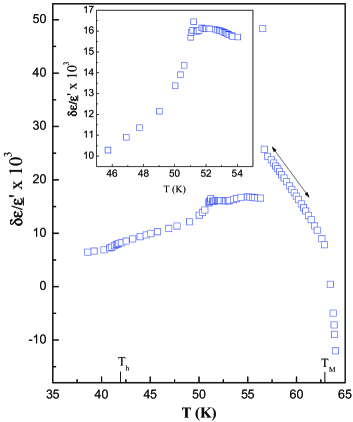
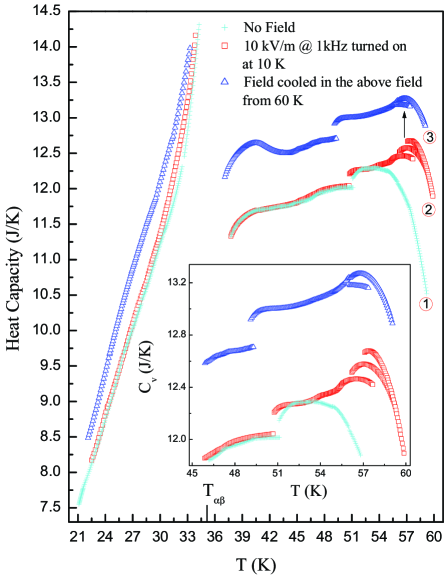
When the sample temperature is further raised to 57 K, we observed a massive, spontaneous change in () at 56.5 K shown in Fig. 2. This temperature is highly reproducible to within 0.1 K for various samples, though small hysteresis ( 1 K) in temperature is present between warm-up and cool-down cycles (not shown). No anomaly near this temperature has been observed in previous experiments, either in dielectric measurements at microwave frequencies [14] or in heat capacity measurements [7]. The fact that such a significant transition has not been observed before prompted us to suspect that the transition may occur only in the presence of the audio frequency electric field. However, because the dielectric measurements always involve an external ac field, and the bias field itself affects the measurement, it is not possible to carry out a true zero-field cooled dielectric measurements at these temperatures. We therefore carried out very sensitive heat capacity measurements at constant volume [13] for both field cooled and zero-field cooled samples. Note that, unlike the previous heat capacity data obtained using adiabatic methods, our high sensitivity nonadiabatic method revealed, in the absence of any external field (curve (1) in Fig. 3), a new critical behavior at 51 K in the heat capacity. This critical behavior is in striking agreement with our dielectric data (inset of Fig. 2). In particular, in the absence of the external electric field, retraces curve (1) in Fig. 3 upon thermal recycling and the general behavior of near 56.5 K agrees very well with the previously reported values [7]. When a uniform 10 kV/m, 1 kHz field is applied across the sample from 10 K, the difference in is negligible up to the continuous transition near 51 K, but significant deviation from the of zero-field cooled samples can be observed for K (see curve (2), Fig. 3). When the above sample exposed to the external field from 10 K is cooled down from 60 K and its heat capacity is obtained once again during the warm-up cycle (while leaving the field on through out), the observed (curve (3), Fig. 3) is larger than that of zero-field cooled sample in the as well as -phases well above the sensitivity of our apparatus. It should be noted that the structural transition as well as the new continuous transition at 51 K remain the same independent of the field. The data clearly shows that in the field cooled samples, there exits a sharp time-dependent rise in near 56.5 K (indicated by ) which finally gives rise to a peak at this temperature. Different curves in Fig. 3 near 56.5 K (in curves (2) and (3)) obtained with 3 h. intervals indicate the slow thermal evolution of with time. (In contrast, our dielectric data (Fig. 2) shows rapid change in at this temperature.) The absence of a peak in Cv for the zero-field cooled sample (curve (1), Fig. 3) near 56.5 K indicates that the observed anomaly at 56.5 K is due entirely to the external electric field. Comparison of curves (1) and (3) clearly demonstrates the strong effect of the external ac field on the thermodynamic behavior of solid N2.
We have carried out several dielectric measurements to determine the dependence on excitation field strength and frequency for which solid N2 shows this remarkable field-induced nonequilibrium behavior. Several samples were initially zero-field cooled down to 4.2 K, carefully annealed at K for 6 to 8 h., and then annealed once again at K for 10 to 12 h. at various external field strengths and frequencies. After cooling the samples to 4.2 K, a standard 100 V/m bias field at 1 kHz was applied to obtain the warm-up data in the -phase for excitation field strengths 100 V/m and frequencies 20 kHz. For other excitation field strengths and frequencies, the bias field and the excitation field are the same. This particular sequence is followed because the ac capacitance bridge has the required sensitivity only for bias fields larger than 100 V/m, and in the audio frequency range [12]. Also, as pointed out previously [10], once the sample temperature is below , the bias field has no observable effect on the nonequilibrium behavior (and hysteresis) of the samples. From these experiments we observed strong field-induced nonequilibrium behavior for external electric fields stronger than 20 V/m (peak-to-peak). The curves of the samples field cooled in fields stronger than 20 V/m are very similar to those shown in Fig. 1. For dc 1 kV/m as well as ac 2 V/m field cooled samples, the is only slightly different from the zero-field cooled case (not shown). In particular we do not observe spontaneous and random jumps in and linear temperature dependence at these temperatures, which characterize the nonequilibrim nature of the field cooled samples. To find out the upper limit of the frequency of the electric field for which we observe the nonequilibrim behavior, we field cooled the sample in 5.2 kV/m, 90 MHz external uniform field. We observed no spontaneous and random jumps in for this sample, but the small hysteresis is still present and the curve is close to that of the zero-field cooled sample. This indicates that the glass-like states can be excited only at low frequencies extending up to perhaps hundreds of kHz and for field strengths greater than 20 V/m. This could be one of the reasons for the failure of the previous microwave measurements [14] to observe the remarkable effect of the external electric field on the thermodynamics of solid N2.
We would like to point out that while for K the field cooled -phase N2 shows remarkable aging behavior, for , where lattice defects may be dominant due to the proximity to melting, is linear as well as reversible with thermal recycling (see Fig. 2). Here we would like to emphasize that the hysteresis values shown in the various plots are accurate to within 1%, and for zero-field cooled samples, we observed no hysteresis or shift in the absolute value of at 4.2 K even after annealing the sample for long time (few hours) at 50 to 55 K (without any external field). This shows that the lattice defects present near the melting temperature can not be the driving mechanism for the aging and memory effects. The external electric field indeed is responsible for the memory effects observed in solid N2 whose origin is not understood.
The strong effect of cooling in the presence of a small ac field in the audio frequency range at such high temperatures is puzzling. The audio frequency field corresponds to a temperature scale of a few K, and the strength of the electric field coupling to the molecular polarizability is negligible compared to the dominant electric quadrupole-quadrupole (EQQ) interactions. Clearly the process of orientational ordering is disrupted by the presence of the field, although the field itself is not strong enough to make a difference if the system is already ordered (uniform field has no effect on EQQ). The presence of short range ordering in the -phase along with the strong effect of field-cooling therefore implies that the formation or growth of these clusters is inhibited by the presence of the field.
The geometrical frustration generated by the symmetry incompatibility of local and extended degrees of freedom results in a thermodynamically large number of accessible ground states. This macroscopic ground state degeneracy presents a new paradigm with which one views condensed matter systems that form glass-like states. The characteristic glass dynamics and aging effects result from the relaxation among a large number of nearly degenerate ground states. In the present case where in the absence of substitutional disorder the frustration is due entirely to the symmetry properties of the interaction, the application of an applied electric field, although small, can perturb the energy landscape of the interacting molecules and result in the field-cooled memory effects. Thermal cycling to temperature where the relaxation rate becomes sufficiently rapid is required to erase the memory effect. In the case of pure N2, typical energy spacings are of the order of 1K [15, 16] (the - spacing for local ordered clusters) and ac fields of the order of 10 kHz are therefore most effective in creating transfers among the energy landscape profile. As a result of these transitions, a cluster of orientatinally ordered molecules will find the molecular orientations slightly changed from the locked ordering directions leading to a partial destruction of the ordering, provided the clusters are small enough. As observed, the effect is absent for rf as well as pure dc electric fields. Upon field-cooling from K where large ordered clusters are not present, the ac field modifies the landscape of metastable states and can generate spontaneous tunneling to lower energy states (e.g., curve (8) in Fig. 1). However, when we begin the field-cooling from K where a broad distribution of ordered cluster sizes already exists, the small changes in the orientation of the molecules can only affect the small clusters (giving rise to hystersesis only). Thus the system can be prepared in a variety of trapped metastable states (with small differences in the ground state energies but high barriers), leading to a free energy landscape with experimentally tunable (large or small) barriers, by cooling from different temperatures in the presence of an external electric field. In conclusion, solid N2 provides a unique opportunity to quantitatively address a variety of questions in the rapidly evolving area of aging and nonequilibrium phenomena in glass-like materials. This work is supported by a grant from the National Science Foundation No. DMR-962356.
REFERENCES
- [1] Y. K. Tsui, C. A. Burns, J. Snyder, and P. Schiffer, Phys. Rev. lett. 82, 3532 (1999).
- [2] O. A. Petrenko, C. Ritter, M. Yethiraj, and D. McK Paul, Phy. Rev. Lett. 80, 4570 (1998).
- [3] M. J. P. Gingras, C. V. Stager, N. P. Raju, B. D. Gaulin, and J. E. Greedan, Phys. Rev. lett. 78, 947 (1997).
- [4] M. J. Harris, S. T. Bramwell, D. F. McMorrow, T. Zeiske, and K. W. Godfrey, Phy. Rev. Lett. 79, 2554 (1997).
- [5] A. P. Ramirez, G. P. Espinosa, and A. S. Cooper, Phys. Rev. lett. 64, 2070 (1990).
- [6] T. A. Scott, Phys. Rep. 27, 89 (1976).
- [7] V. G. Manzhelii and Y. A. Freiman, Physics of Cryo Crystals (AIP Press, Woodbury, NY, 1997).
- [8] F. Alberici, P. Doussineau, and A. Levelut, Europhys. Lett. 39, 329 (1997).
- [9] S. Franz, M. M zard, G. Parisi, and L. Peliti, Phy. Rev. Lett. 81, 1758 (1998).
- [10] S. Pilla, J. A. Hamida, K. A. Muttalib, and N. S. Sullivan, Phy. Lett. A 256, 75 (1999).
- [11] S. Pilla, J. A. Hamida, K. A. Muttalib, and N. S. Sullivan, Physica B (in press).
- [12] S. Pilla, J. A. Hamida, and N. S. Sullivan, Rev. Sci. Instrum. 70, 4055 (1999).
- [13] S. Pilla, J. A. Hamida, and N. S. Sullivan, e-print cond-mat/0003086 [Rev. Sci. Instrum. (to be published)].
- [14] W. Kempinski and J. Stankowski, Low Temp. Phys. 21, 74 (1995).
- [15] R. F. Curl, H. P. Hopkins Jr., and K. S. Pitzer, J. Chem. Phys. 48, 4064 (1968).
- [16] J. C. Raich, J. Chem. Phys. 56, 2395 (1972).