[
The monoclinic phase in PZT: new light on morphotropic phase boundaries
Abstract
A summary of the work recently carried out on the morphotropic phase boundary (MPB) of PZT is presented. By means of x-ray powder diffraction on ceramic samples of excellent quality, the MPB has been successfully characterized by changing temperature in a series of closely spaced compositions. As a result, an unexpected monoclinic phase has been found to exist in between the well-known tetragonal and rhombohedral PZT phases. A detailed structural analysis, together with the investigation of the field effect in this region of compositions, have led to an important advance in understanding the mechanisms responsible for the physical properties of PZT as well as other piezoelectric materials with similar morphotropic phase boundaries.
]
Introduction
***To appear in the proceedings of the Workshop on Fundamental Physics of Ferroelectrics held in Aspen, Feb. 2000. 1Present address: Physics department, Brookhaven National Lab., Upton, NY 11973.The morphotropic phase boundary (MPB) of PbZr1-xTixO3 (PZT) has been finally characterized on extremely homogeneous ceramic samples by high resolution x-ray measurements. The boundary has been found to define the limit between the tetragonal phase and a new PZT phase with monoclinic symmetry. The recent work on this finding is reviewed [1, 2, 3, 4].
The remarkable physical properties of the ferroelectric system PbZr1-xTixO3 (PZT) for compositions close to x= 0.47 have been known for many years. In particular, its high piezoelectric response has made PZT one of the most widely used materials for electromechanical applications. PZT was first studied five decades ago [5, 6] and the main structural characteristics of the system were investigated at that time. At high temperatures PZT is cubic with the perovskite structure. When lowering the temperature the material becomes ferroelectric, with the symmetry of the ferroelectric phase being tetragonal (FT) for Ti-rich compositions and rhombohedral (FR) for Zr-rich compositions. Subsequent studies led to the generally accepted phase diagram after Jaffe et al.[7], which covers temperatures above 300 K. Jaffe’s phase diagram is represented by open circles in Fig. 1 for 0.33x 0.63. A complete phenomenological theory was developed for this system that is able to calculate thermal, elastic, dielectric and piezoelectric parameters of ferroelectric single crystal states [8].
The boundary between the tetragonal and the rhombohedral phases, at compositions close to x= 0.47, the so-called morphotropic phase boundary (MPB)[7], is nearly vertical in temperature scale. It has been experimentally observed that the maximum values of the dielectric permittivity, as well as the electromechanical coupling factors and piezoelectric coefficients of PZT at room temperature occur on this phase boundary. However, the maximum value of the remanent polarization is shifted to smaller Ti contents [7].
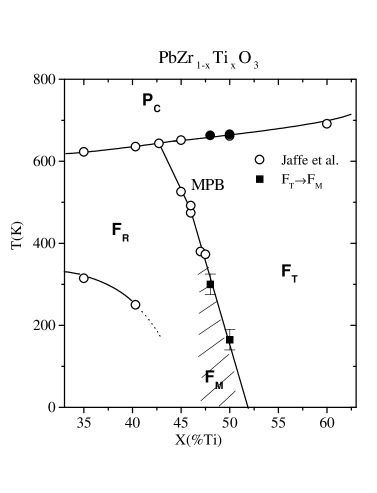
The space groups of the tetragonal and rhombohedral phases (P4mm and R3m, respectively) are not symmetry-related, so a first order phase transition is expected at the MPB. However, this has never been observed and, as far as we know, only composition dependence studies are available in the literature. One of the main difficulties in the experimental approach to this problem is the lack of single crystals of PZT. Because of the steepness of the phase boundary, any small compositional inhomogeneity leads to a region of phase coexistence (see e.g.[9, 10, 11, 12]) that conceals the tetragonal-to-rhombohedral phase transition. The width of the coexistence region has been also connected to the particle size [13] and depends on the processing conditions, so a meaningful comparison of available data in this region is often not possible.
On the other hand, the richness of phases in PZT and the simplicity of its unit cell have encouraged important theoretical efforts in recent years. So far, the first-principles studies have been successful in reproducing many of the physical properties of PZT [14, 15]. But, in spite of the proven validity, these calculations had not yet accounted for the remarkable increment of the piezoelectric response observed when the material approaches its MPB.
It was accordingly clear that there was something missing in the understanding of PZT, mainly due to experimental difficulties, and we addressed our efforts in this direction. The slight deviation from verticality of the MPB encouraged us to attempt the investigation of a temperature driven phase transition knowing that only samples of exceptional quality would allow us to succeed. With this purpose such ceramics were prepared by the Penn. State group. Our collaboration has resulted in the discovery of a new monoclinic phase (FM) in this ferroelectric system [1, 2]. The detailed structural analysis of tetragonal [3] and rhombohedral[16] phases of PZT seemed to indicate that the local structure is different from the average one and that, in both phases, such local structure has monoclinic symmetry. This local structure would be the precursor of the observed monoclinic phase. Diffraction measurements of the effect of the electric field on ceramic samples have confirmed this model [4]. Measurements on PZT samples with x= 0.48 and x= 0.50 allowed for a modification of the PZT phase diagram as shown in Fig. 1. It should be noted that the MPB defined by Jaffe et al. is still a perfectly valid line that corresponds to the FT-FM phase transition.
Experimental
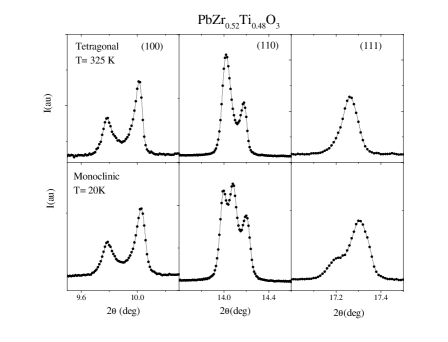
PZT samples were prepared by conventional solid-state reaction techniques as described in refs.[1, 3] at the MRL, Penn. State University, and samples with x= 0.50 were prepared at ICG, CSIC, Spain, as described in ref.[2]. High-resolution synchrotron x-ray powder diffraction measurements were carried out at the X7A diffractometer, at the Brookhaven National Synchrotron Light Source. Two types of experiments were done, as explained in ref. [3]. In the first one, data were collected from a disk in a symmetric flat-plate reflection geometry over selected angular regions as a function of temperature. These measurements demonstrated the high quality of the ceramic samples, whose diffraction peaks in the cubic phase have full-widths at half-maximum of 0.02∘ for x= 0.48. By means of a Williamson-Hall analysis in the cubic phase, a compositional error of less than was estimated [3] for this composition. To perform a detailed structure determination, additional measurements were made for PZT with x= 0.48, at 20 and 325 K, in the monoclinic and tetragonal phases, respectively. In this case, the sample was loaded in a rotating capillary of 0.2 mm diameter to avoid texture and preferred orientation effects [3].
The monoclinic phase
According to the PZT phase diagram[7], a sample with x= 0.48 is tetragonal just below the Curie point and rhombohedral below room temperature. The measurements on the pellets for selected diffraction peaks, with decreasing temperature from the cubic phase, showed the expected tetragonal phase down to 300 K. Below this temperature however new features appeared in the diffractograms, but they were not compatible with either a rhombohedral phase or with a mixture of both phases (tetragonal and rhombohedral), and they clearly corresponded to a monoclinic phase with b as a unique axis [1]. This can be observed in Figure 2 where selected parts of the diffraction profile are plotted for the monoclinic (20 K) and the tetragonal (325 K) phases.
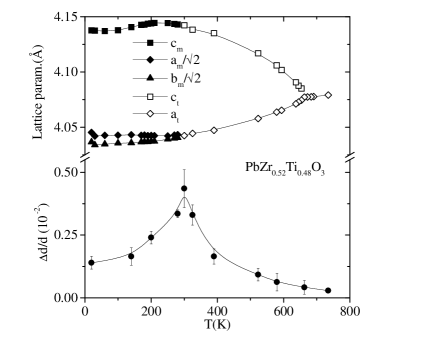
The cell parameters of PZT (x=0.48) are represented in Fig. 3 as a function of temperature. In the tetragonal phase (below Tc= 660 K), the tetragonal strain , increases as the temperature decreases. At T 300K the tetragonal-to-monoclinic () phase transition takes place and the ratio starts decreasing slightly. The microstrain present in the sample during the evolution of the tetragonal phase seems to play a crucial role in the phase transition. is obtained from a Williamson-Hall analysis of the diffraction line widths[3] and is shown as a function of temperature at the bottom of the plot. At high temperatures, increases as the temperature decreases. At first, the increment is slow and no anomaly is observed at the cubic-to-tetragonal transition. At lower temperatures shows a rapid increase that reaches a sharp maximum just at the phase transition. For this amount of Zr substituted, the tetragonal phase cannot support the stress in the structure, which is to a large extent released by the onset of the monoclinic phase. Further analysis is being done in order to compare the microstrain exhibited by different compositions with that observed in pure PbTiO3, where the tetragonal phase is stable at very low temperatures.
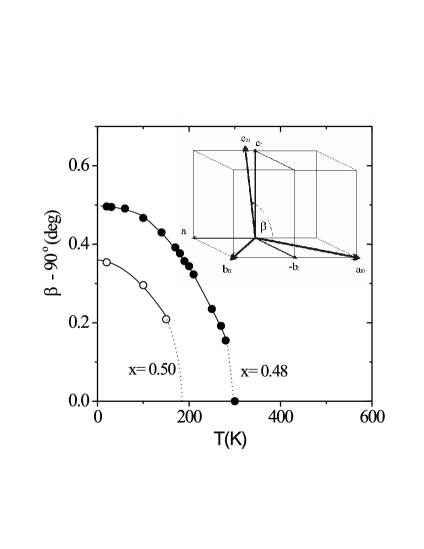
The monoclinic unit cell is doubled with respect to the tetragonal one: and are aligned along the [ and [1] directions, respectively, and remains approximately equal to the tetragonal but it is tilted with respect to it in the monoclinic plane, as illustrated in the inset in Fig. 4. Such a unit cell is chosen in order to have a monoclinic angle, , larger than 90∘ (according to the usual convention) and is then defined as the order parameter of the transition. Its temperature evolution is depicted in Fig. 4. The transition seems to be of second order which is allowed in this case, since Cm is a subgroup of P4mm. PZT samples with x= 0.50, prepared in a slightly different way [2], showed also a monoclinic phase for temperatures below 200 K. In this case is approximately equal to and the monoclinic angle, was found to be smaller than that observed for x= 0.48. Its evolution with temperature is also plotted in Fig.4 [2]. A direct comparison of these data for samples from different origins must be regarded with caution. Further work is being carried out in which samples with compositions in the range x= 0.42-0.51 processed under the same conditions are studied. However, with the data obtained so far it is already possible to represent a modification of the PZT phase diagram as the one shown in figure 1. It can be observed that the MPB established by Jaffe et al.[7] above room temperature seems to lie exactly along the FT-FM phase boundary.
Contrary to what occurs in the tetragonal and rhombohedral phases, in the monoclinic phase the polar axis is not determined by symmetry and could be along any direction within the monoclinic plane. To determine this direction the atom positions need to be known. A detailed structure investigation by means of a Rietveld profile analysis of the tetragonal and monoclinic phases of PZT (x= 0.48) has produced interesting results [3]. In the tetragonal phase at 325 K the unit cell has and and the atoms were found to be displaced in the same way as in pure PbTiO3: Pb and Zr/Ti were shifted 0.48 Å and 0.27 Å, respectively, along the polar [001] axis. Anisotropic temperature factors gave a much better refinement but the resultant thermal ellipsoids were unphysically flattened perpendicularly to the polar direction. This is not a new problem in PZT: Rietveld refinement of the rhombohedral PZT[17] structure also produced thermal disk-shaped ellipsoids flattened perpendicular to the rhombohedral polar axis [111]. This observed behavior has been previously associated with the existence of certain local ordering different from the long-range order.
The local order has been studied in rhombohedral PZT by means of the Pair Distribution Function [18] and, more recently, by modelling local disordered cation shifts by means of a Rietveld profile refinement [16]. The authors found that by considering three equivalent disordered displacements along the 001 directions, superimposed on the rhombohedral cation displacement along [111] (see figure 5) the refinement produced much more reasonable temperature factors.
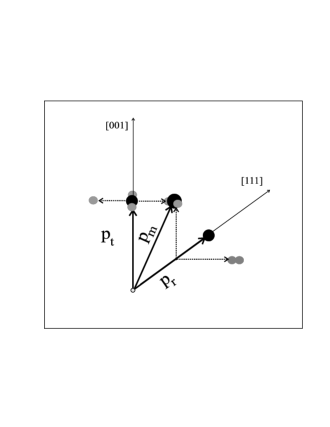
In the same way, for tetragonal PZT(x= 0.48) at 325 K, we can model local disordered sites for the lead atoms perpendicular to the polar axis, that is, we allow Pb to move towards the four sites allowed by symmetry, i.e. at the xxz positions [3], which give an average tetragonal (00z) cation shift (see figure 5). Similar results are obtained if the refinement is carried out modelling local disorder shifts along the x0z directions. The refinement gives local shifts of 0.2 Å perpendicular to the polar axis in adition to the common shift of 0.48 Å along the polar axis, which is similar to that of PbTiO3, and gives also physically reasonable isotropic temperature factors.
The structure of the monoclinic phase at 20 K does not present this kind of problems. The refinement is very good considering isotropic temperature factors for all atoms except lead, and the resulting anisotropy for lead is not unreasonable [3]. The refined unit cell was , , with . The results os the refinement [3] have defined the monoclinic polar axis. This lies within the monoclinic plane along a direction between the polar axes of the tetragonal and the rhombohedral phases, away from the former (see figure 5). This value could become slightly different after the oxygen positions are more accurately determined by a neutron study that is underway. This is the first example of a ferroelectric material with , where , and are the Cartesian components of the spontaneous polarization.
Although this result is interesting, the striking fact about it is that the monoclinic shifts exactly corresponds to one of the four locally disordered shifts proposed for the tetragonal phase, as it can be observed in fig.5. The monoclinic phase appears, as the temperature is lowered, by the condensation of one of the local shifts existing in the tetragonal phase. Most interesting is the fact that the monoclinic displacement also corresponds to one of the three locally disordered shifts proposed by Corker et al.[16] for the rhombohedral phase (see fig. 5), so the condensation of this particular site would also give rise to the observed monoclinic phase.
Field effect
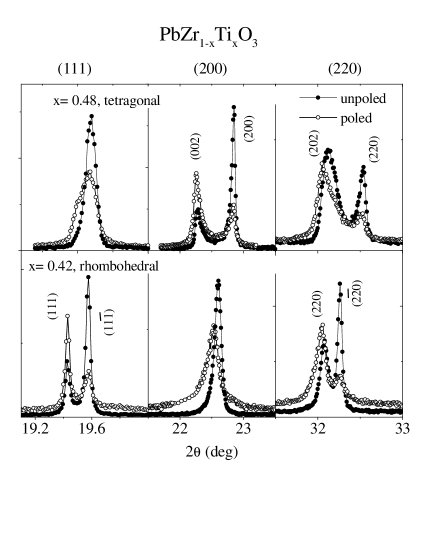
Diffraction experiments with poled ceramics as well as with PZT ceramics under electric field applied in-situ were carried out. This measurement were taken on the flat plate on symmetric reflection, which means that only scattering vectors perpendicular to the surfaces are measured [4]. A plot of selected diffraction peaks of poled and unpoled samples (Fig. 6) shows the expected intensity differences which are attributed to differences in domain populations after poling, in both the tetragonal (x= 0.48) and a rhombohedral (x= 0.42) compositions. The behavior of the peak positions after poling was, however, unexpected. As shown in the same figure for the rhombohedral composition, the (hhh) diffraction peaks, corresponding to the polar direction, were not shifted after poling. A large shift of the (h00) peak position was observed, however, which means that the piezoelectric elongation of the unit cell is not along the polar direction, but along [001]. In a similar way, for the tetragonal composition (x= 0.48), no shift was observed along the polar [001] direction, while clear poling effects were evident in the (hhh) peaks. The explanation of this striking behavior lies in the monoclinic phase. The piezoelectric strain occurs, for compositions close to the MPB not along the polar axes but along the directions that induce the monoclinic distortion.
All these observations lead us to propose that the so-called morphotropic phase boundary is not a boundary but rather a phase with monoclinic symmetry. This new phase is intermediate between the tetragonal and rhombohedral PZT phases. Its symmetry relates both phases (Cm being a subgroup of both P4mm and R3m) through the only common symmetry element, the mirror plane. Both, the tetragonal and rhombohedral phases (at least in the proximity of the MPB) have a local structure different from the long-range one and at low temperatures a monoclinic long range order is established by the freezing-out of one of the ”local monoclinic structures” in both the rhombohedral and the tetragonal phases. Under the application of an electric field, one of the locally disordered sites becomes preferred, inducing the monoclinic distortion. This induced monoclinic phase is stable and remains after the field is removed.
These results can explain some of the puzzles in PZT, such as the larger piezoelectric coefficient found in rhombohedral PZT along the tetragonal direction [19]. Taking into account the monoclinic phase, very recent ab initio calculations have been able to explain the high piezoelectric response of these materials by considering rotations of the polar axis in the monoclinic plane () [20]. Indications of a phase of lower symmetry than tetragonal have been found by optical measurement on single crystals of PZN-PT close to the MPB [21]. Something similar could be true in other ferroelectric systems with similar MPBs as PMN-PT or some Tungsten-Bronzes.
We thank L. Bellaiche, T. Egami, A.M. Glazer and C. Moure for helpful discussions, B. Jones for the excellent samples, and A. Langhorn for his technical support during the field experiments. Financial support by the U.S. Department of Energy under contract No. DE-AC02-98CH10886 and ONR under project MURI (N00014- 96-1-1173) is also acknowledged.
REFERENCES
- [1] B. Noheda, D.E. Cox, G. Shirane, J.A. Gonzalo, L.E. Cross, and S-E. Park, Appl. Phys. Lett. 74, 2059 (1999).
- [2] B. Noheda, J.A. Gonzalo, A.C. Caballero, C. Moure, D.E. Cox, and G. Shirane, presented at the 9th European Meeting on Ferroelectricity, Prague, July1999 (to be published in Ferroelectrics, March 2000). e-print:cond-mat/9907286.
- [3] B. Noheda, J.A. Gonzalo, L.E. Cross, R. Guo, S-E. Park, D.E. Cox, and G. Shirane, Phys. Rev. B 61 (in press), 1 April (2000). e-print:cond-mat/9910066
- [4] R. Guo, L.E. Cross, S-E. Park, B. Noheda, D.E. Cox, and G. Shirane, e-print:cond-mat/9912118 (to be published).
- [5] G. Shirane and K. Suzuki. J. Phys. Soc. Japan 7, 333 (1952).
- [6] E. Sawaguchi, J. Phys. Soc. Japan 8, 615 (1953).
- [7] B. Jaffe, W.R. Cook, and H. Jaffe, Piezoelectric Ceramics (Academic Press, London, 1971). We are unable to locate the original publication that describes how the MPB was determined.
- [8] M. J. Haun, E. Furman, S.J. Jang, and L.E. Cross, Ferroelectrics 99,13 (1989).
- [9] K. Kakewaga, O. Matsunaga, T. Kato, and Y. Sasaki, J. Amer. Ceram. Soc. 78, 1071 (1995).
- [10] S. K. Mishra, D. Pandey. Appl. Phys. Lett. 69, 1707 (1996)
- [11] S. Zhang, X. Dong, S. Kojima. Jpn. J. Appl. Phys. 36, 2994(1997).
- [12] A.P. Wilkinson, J. Xu, S. Pattanaik and J.L. Billinge, Chem. Mat. 10, 3611 (1998).
- [13] W. Cao and L.E. Cross, Phys. Rev. B 47, 4825 (1993).
- [14] G. Saghi-Szabo, R. Cohen, and H. Krakauer, Phys. Rev. B 59, 12771 (1999).
- [15] L. Bellaiche and D. Vanderbilt, Phys. Rev. Lett. 83, 1347 (1999).
- [16] D.L. Corker, A.M. Glazer, R.W. Whatmore, A. Stallard, and F. Fauth, J. Phys.:Condens. Matter 10, 6251 (1998).
- [17] A.M. Glazer and S.A. mabud, Asta Cryst. B34, 1060 (1978).
- [18] S. Teslic, T. Egami, and D. Viehland, J. Phys. Chem. Solids 57, 1537 (1996); Ferroelectrics 194, 271 (1997).
- [19] X-h Du, J. Zheng, U. Belegundu, and K. Uchino, Appl. Phys. Lett 72, 2421 (1998).
- [20] L. Bellaiche, A. Garcia, and D. Vanderbilt (to be published).
- [21] K. Fujishiro, R. Vlokh, Y. Uesu, Y. Yamada, J-M. Kiat, B. Dkhil, and Y. Yamashita, presented at the 9th European Meeting on Ferroelectricity, Prague, July 1999 (to be published in Ferroelectrics, March 2000).